magazine
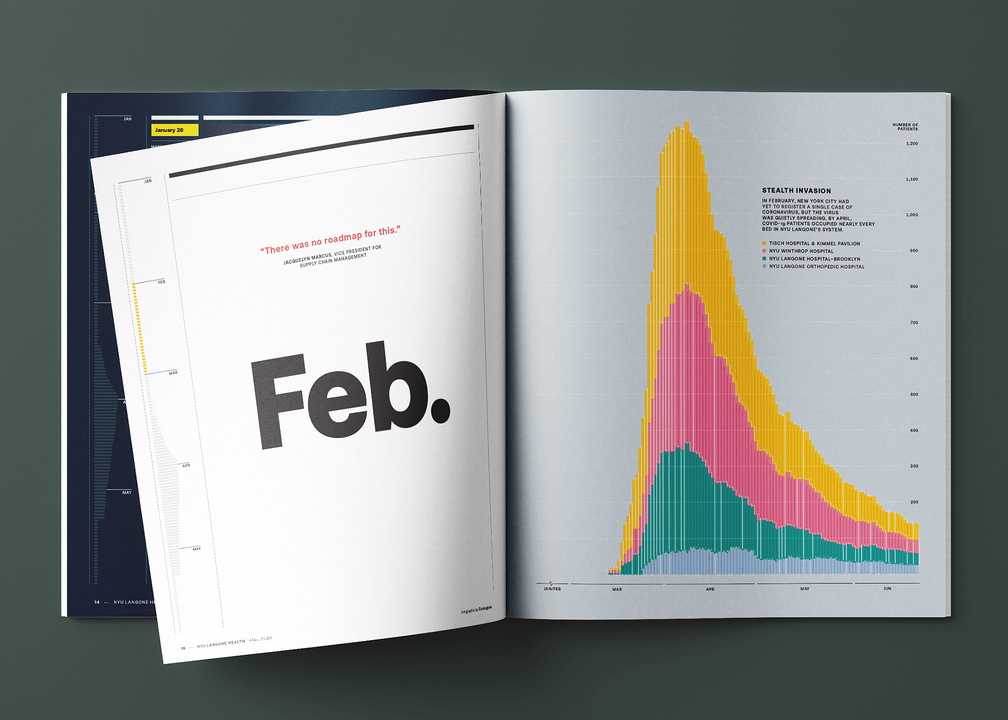
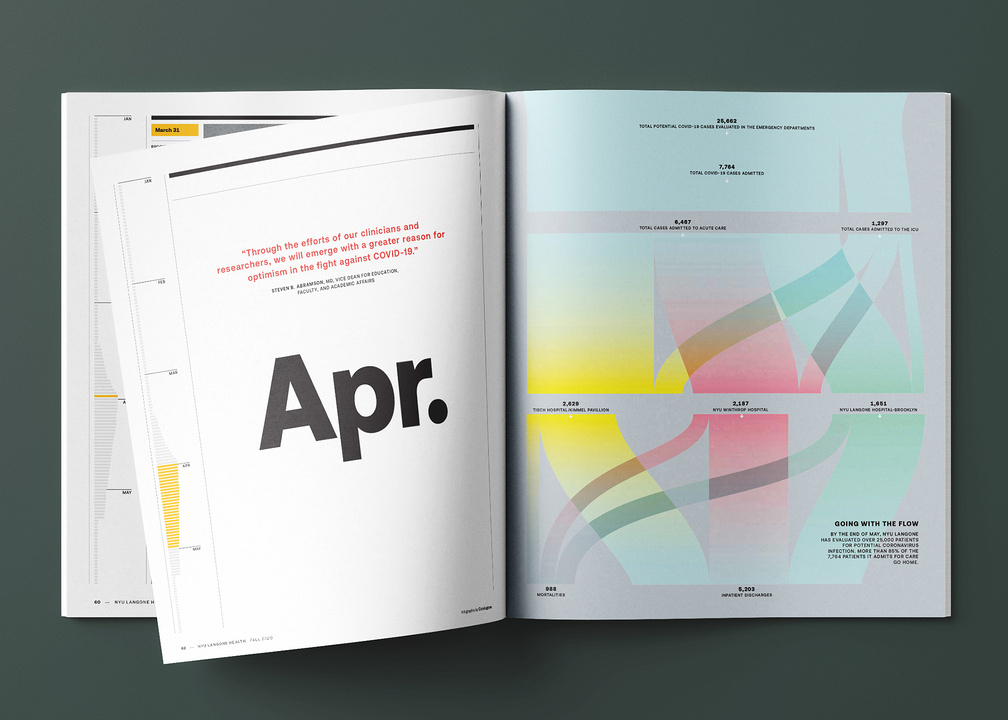
July 2020 – Infographics and openers for "How We Saved Lives", a special issue of the NYU Langone Health Magazine, New York (USA).


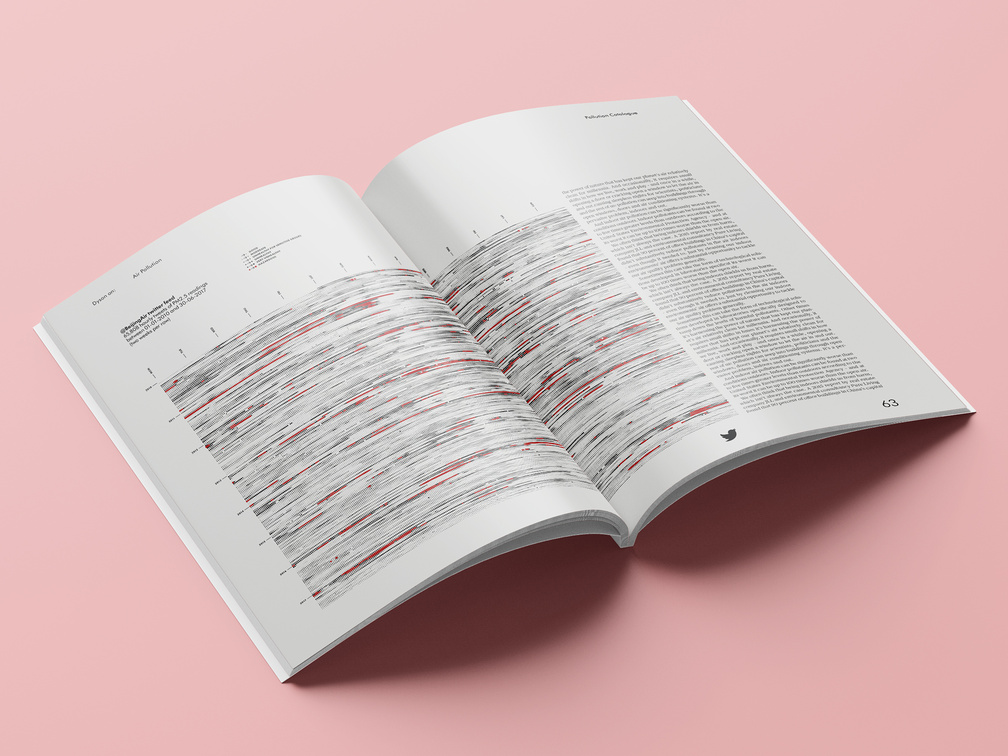
How competition makes us creative
July 2019 – Graphics on air pollution for the second issue of Dyson on: Magazine.
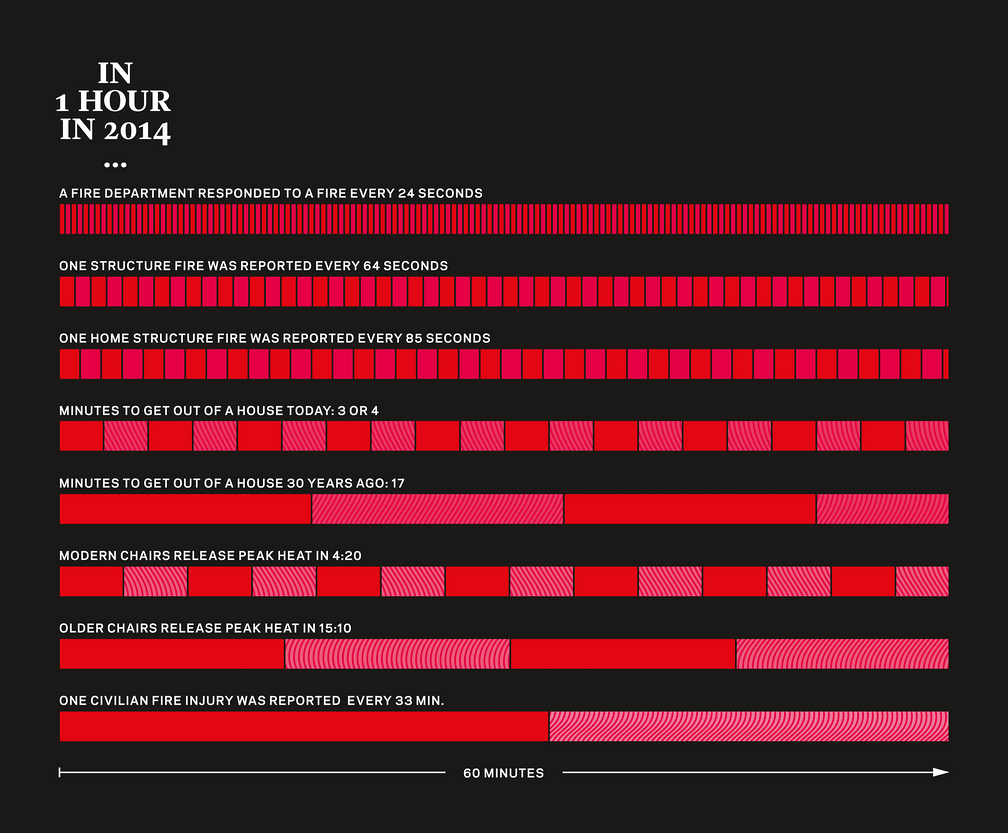
November 2015 – Various graphics on Home Fires in the US for the November Issue of BUILDER Magazine, Washington D.C. (US).
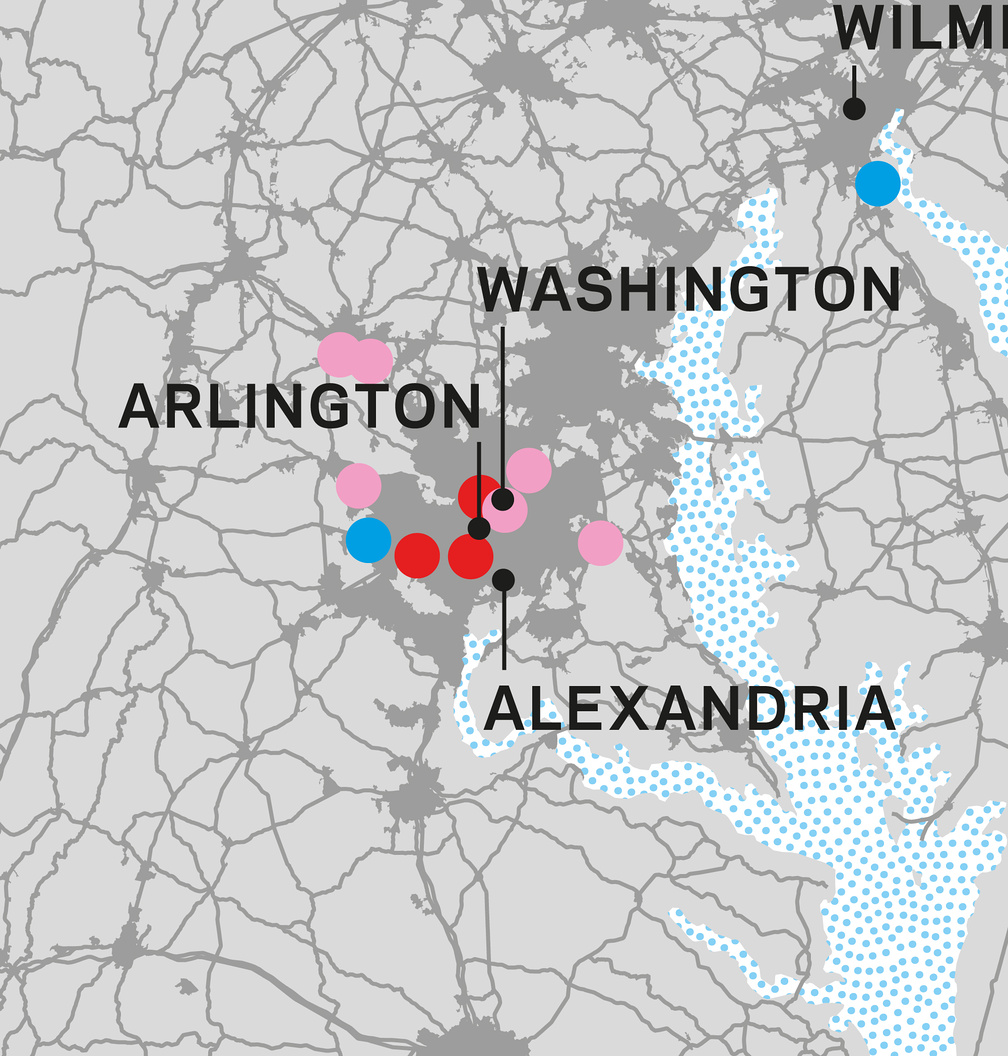
June 2015 – Maps and charts on new community sales in the US for BUILDER Magazine, Washington D.C. (US).
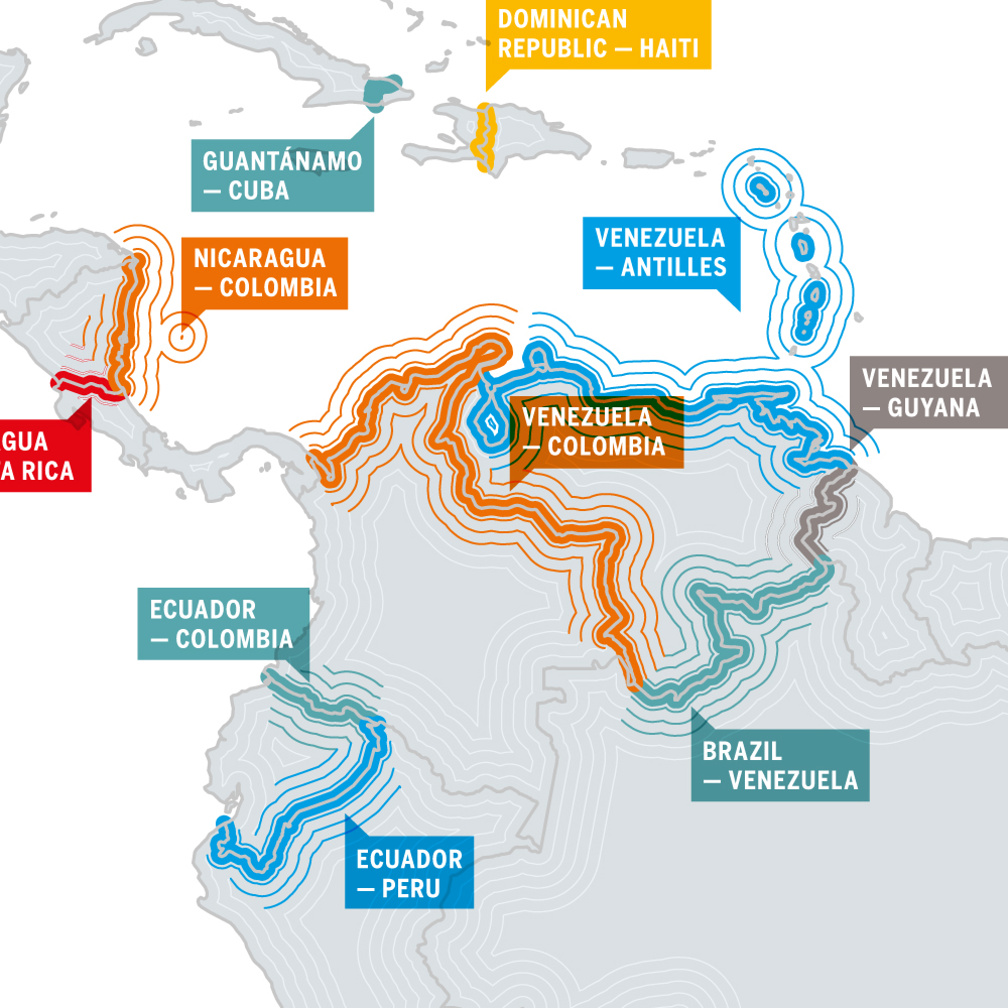
Hot or Not? Border Conflicts in the Americas
February 2015 – A map on border conflicts in The Americas for Americas Quarterly, North Hollywood (US).
February 2015 – Responsive website for TVTOR magazine, ‘a concentrated collection of short stories from a variety of regular and irregular authors’.

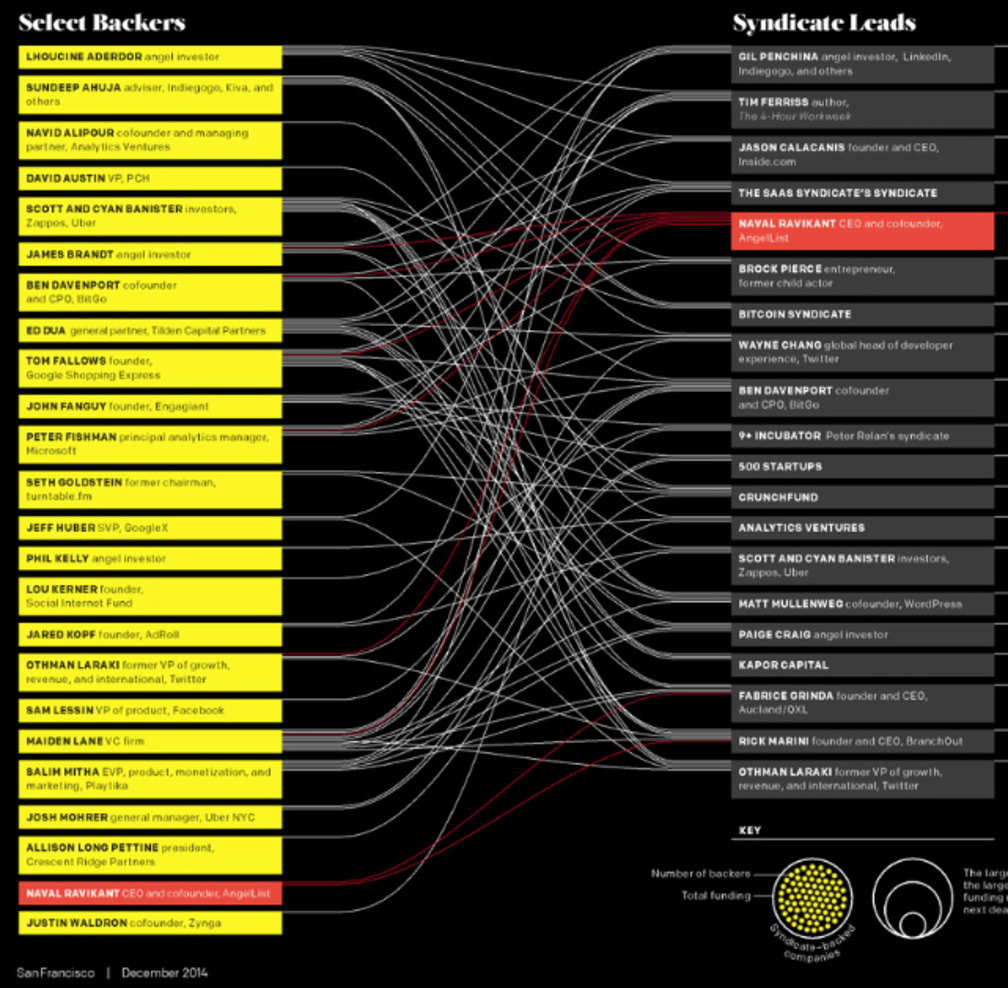
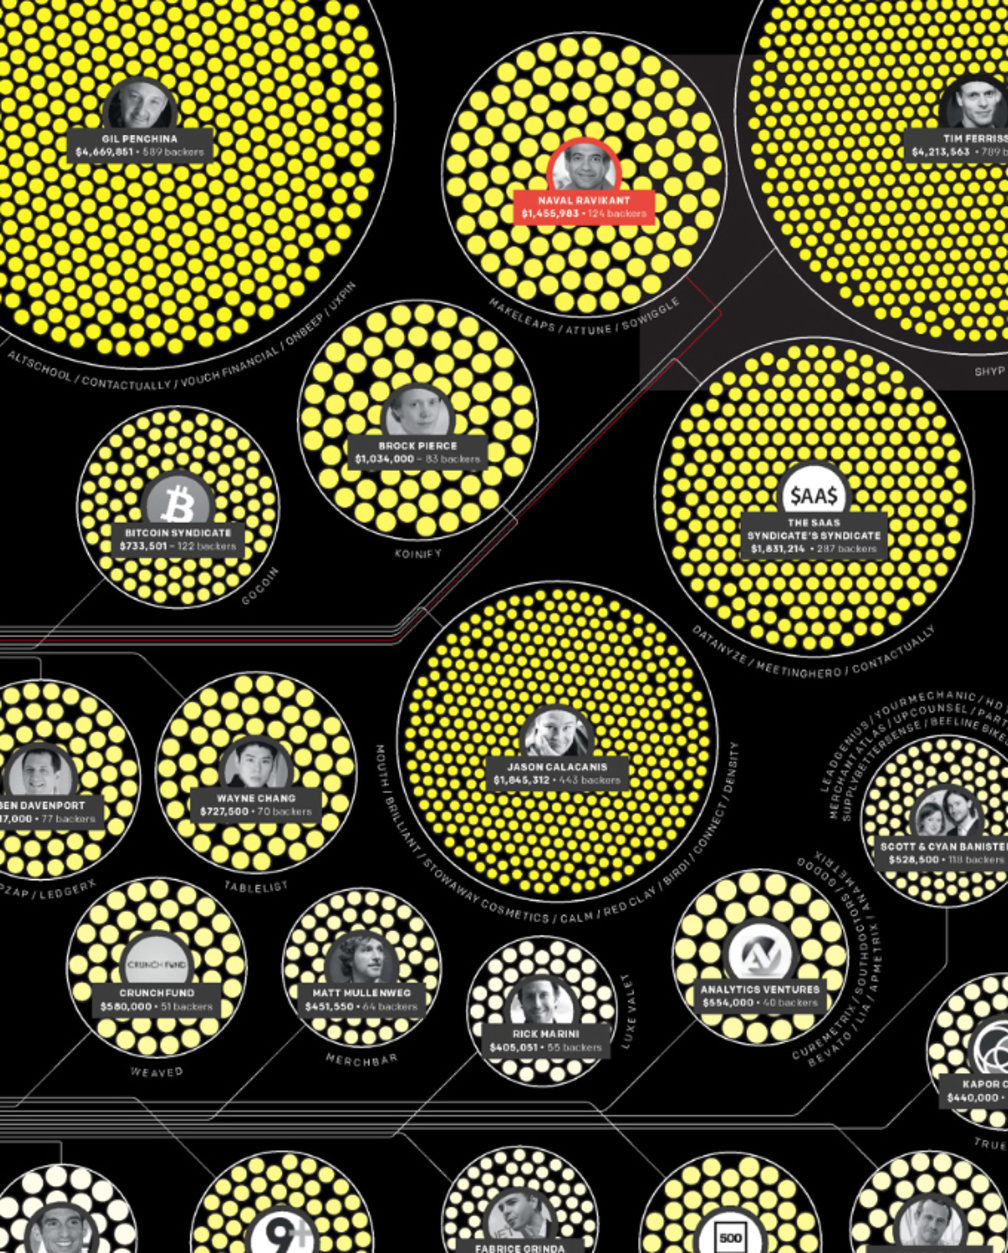
Silicon Valley Dart Club
December 2014 – Infographic for San Francisco Magazine showing the powerful syndicates on the crowdsourcing platform Angellist.

TVTOR logo
October 2013 – Masthead design for Matthias Vriens-McGrath's new biannual magazine 'TVTOR'. In collaboration with Bernd Volmer (type design) .
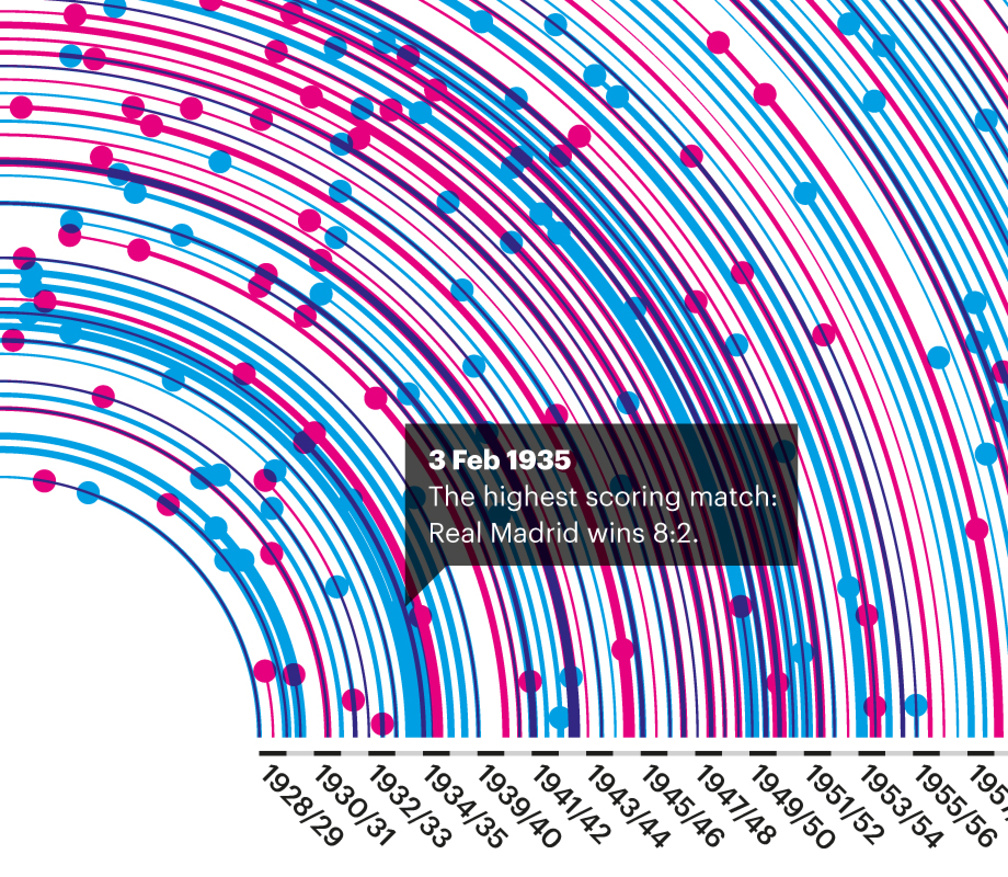
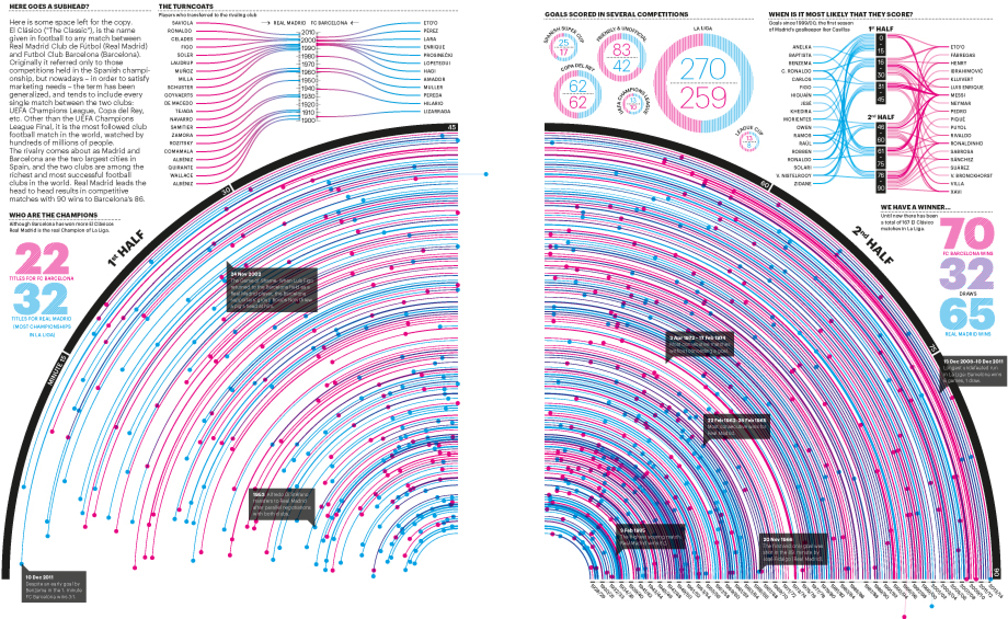
El Clásico
October 2013 – Infographics about the rivalry between Real Madrid C.F. and FC Barcelona for 8x8, a football magazine from the US. The main graphic shows all 166 'El Clásico' matches in the Spanish football league until 2013.
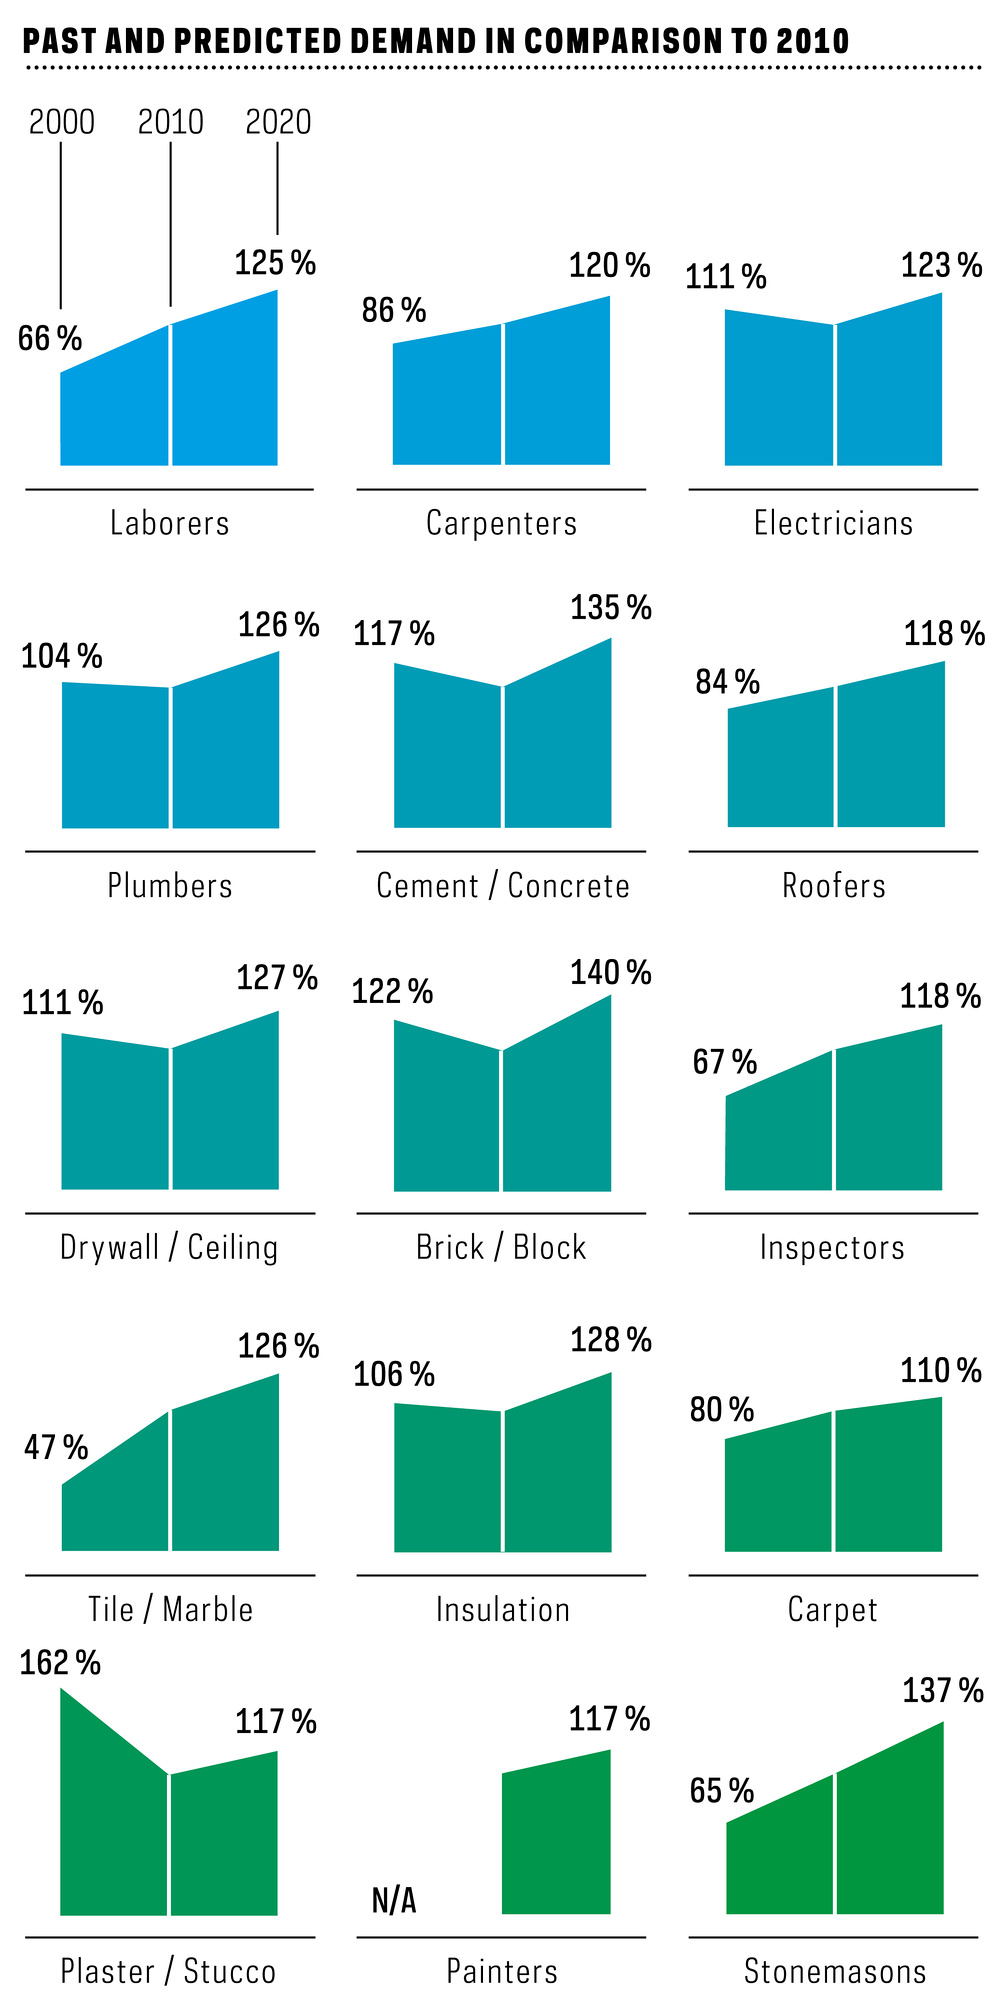
August 2013 – Various graphics on construction labor for the August Issue of BUILDER Magazine, Washington D.C. (US).
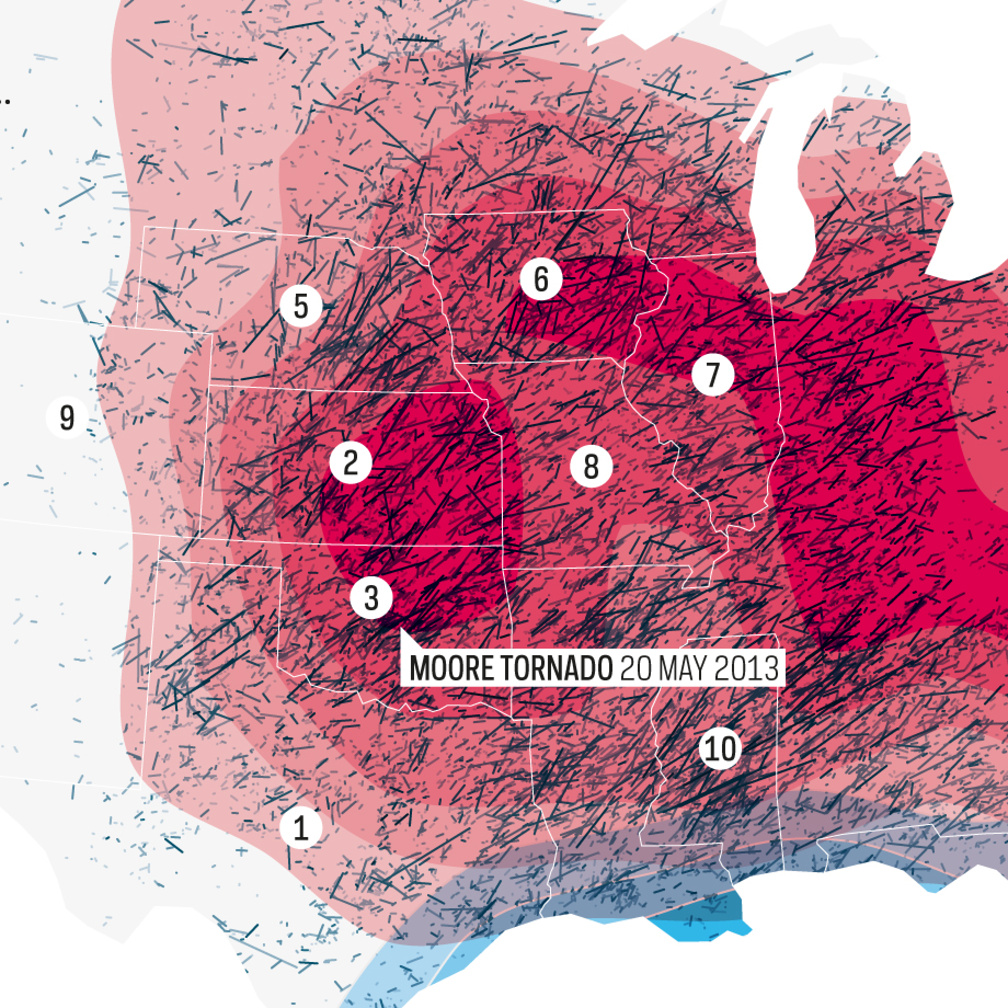
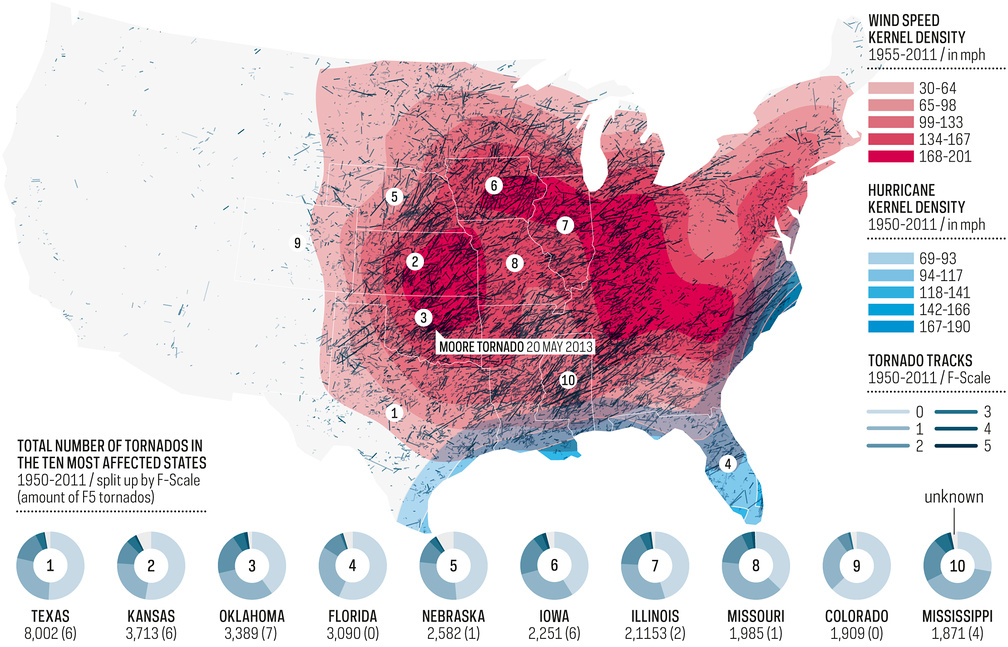
Disaster Strikes
June 2013 – Map for BUILDER Magazine, Washington D.C. (US) showing severe weather in the US over the past 50 years: Tornado Tracks, Kernel Wind and Hurricane Density.
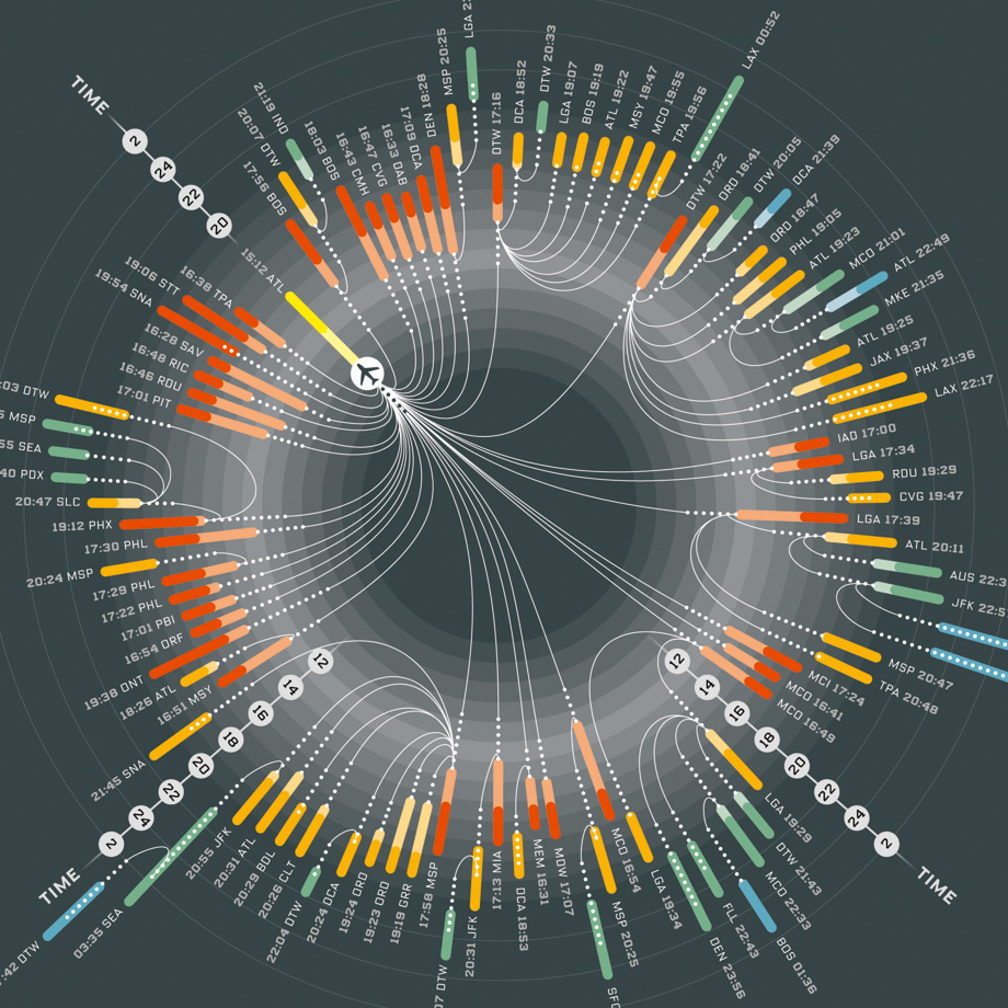
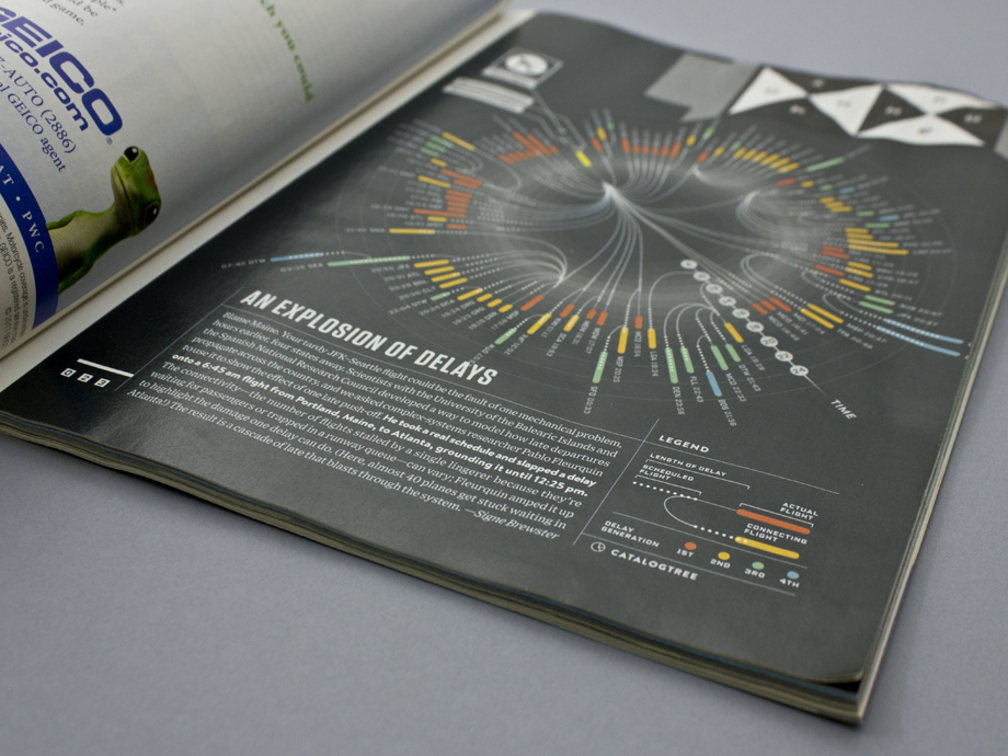
An explosion of delays
June 2013 – Infographic for WIRED magazine showing an explosion of delays caused by one delayed seed flight.
How Much Do You Have to Make to Be Successful?
May 2013 – Illustration for ESQUIRE magazine, New York (US). The map shows how much a family of four need to have to live very well in 24 cities of the US.
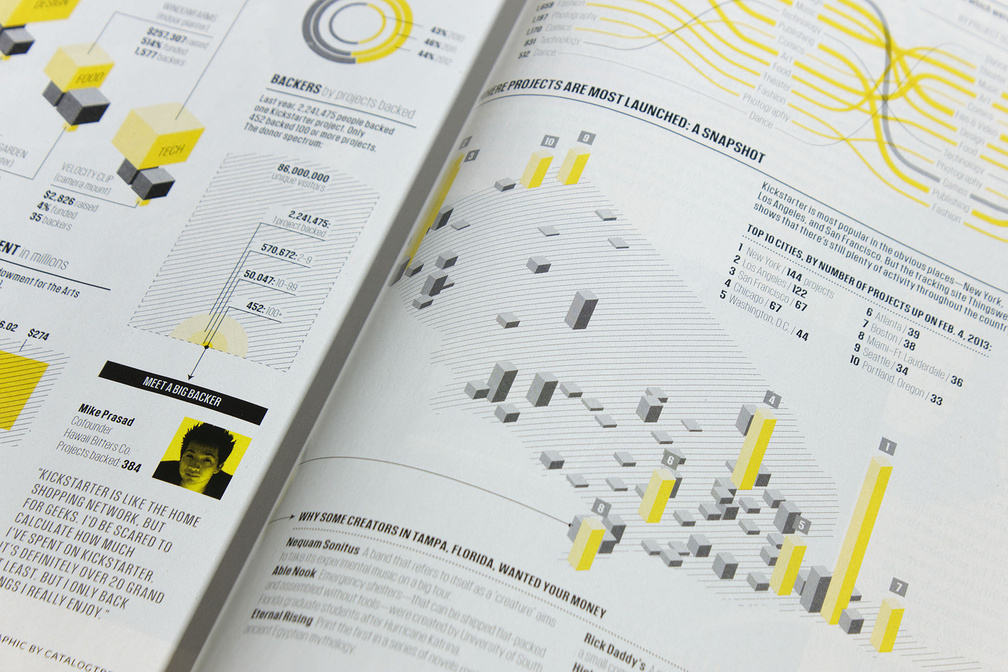
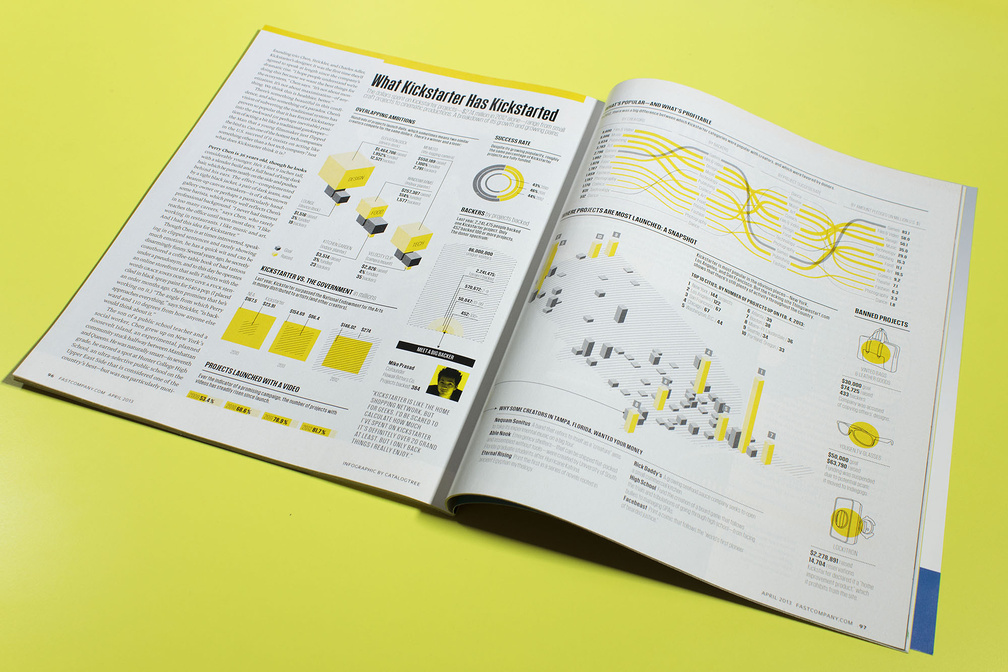
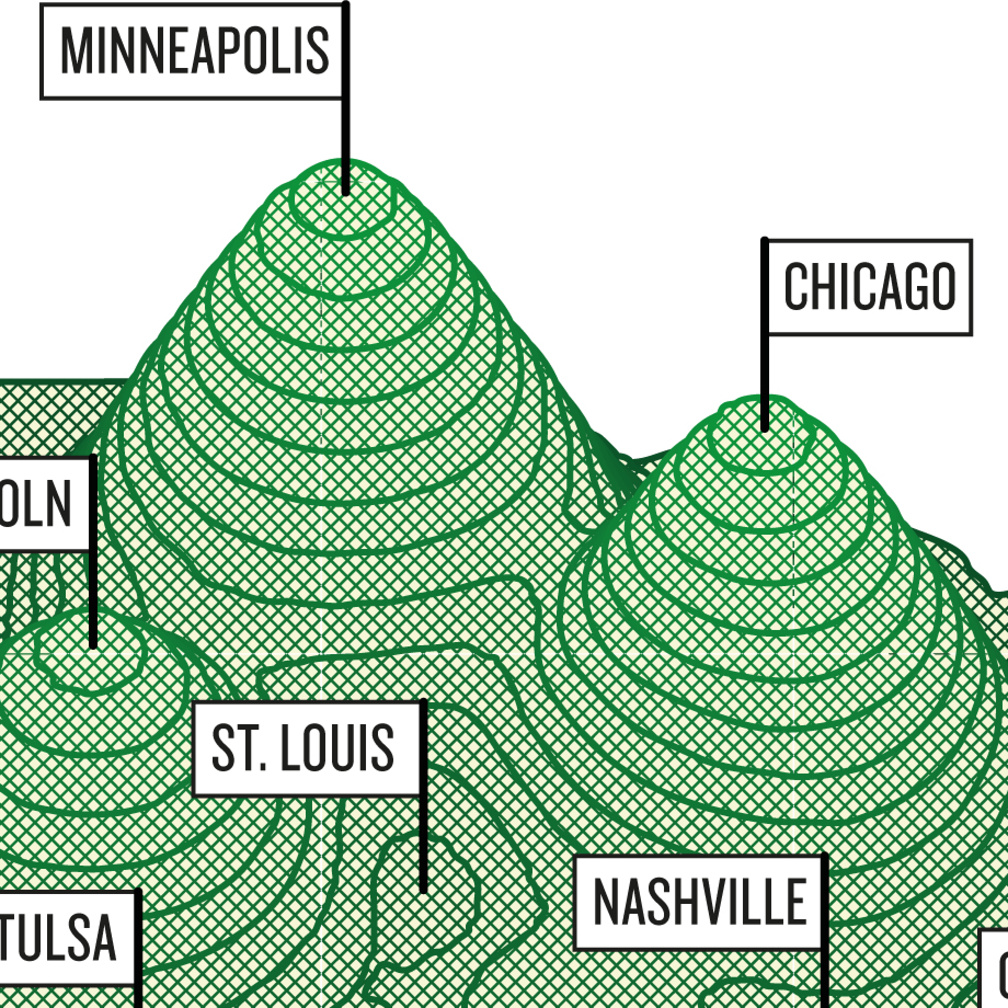
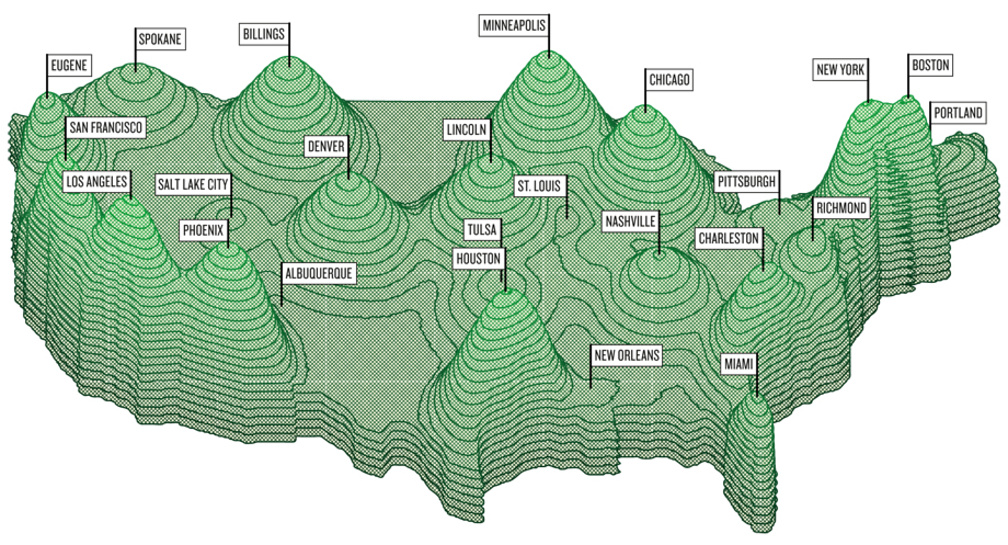
March 2013 – Charts and map about the crowdfunding platform 'Kickstarter' for Fast Company Magazine, Harlan (US).
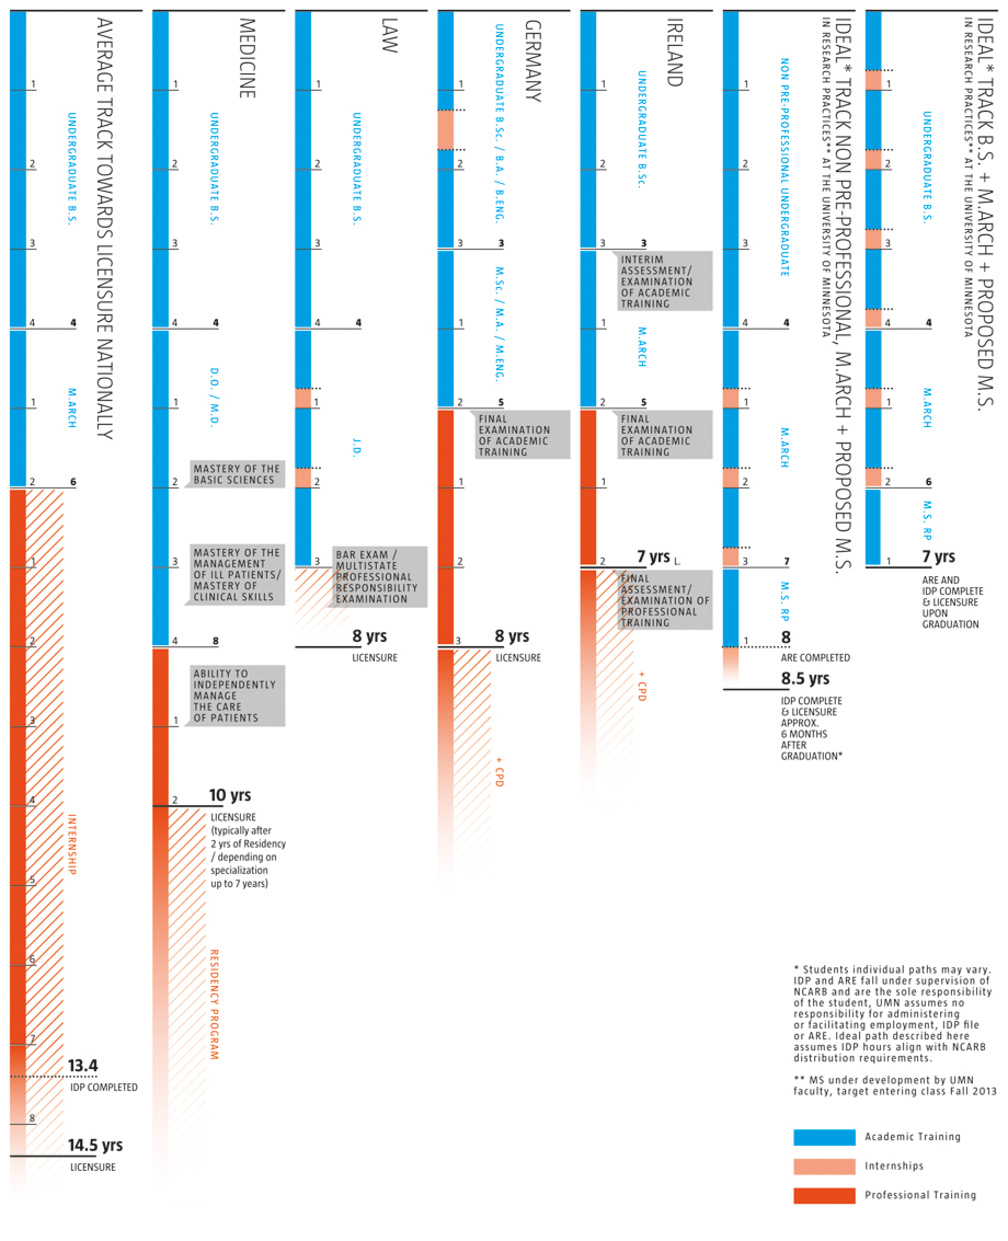
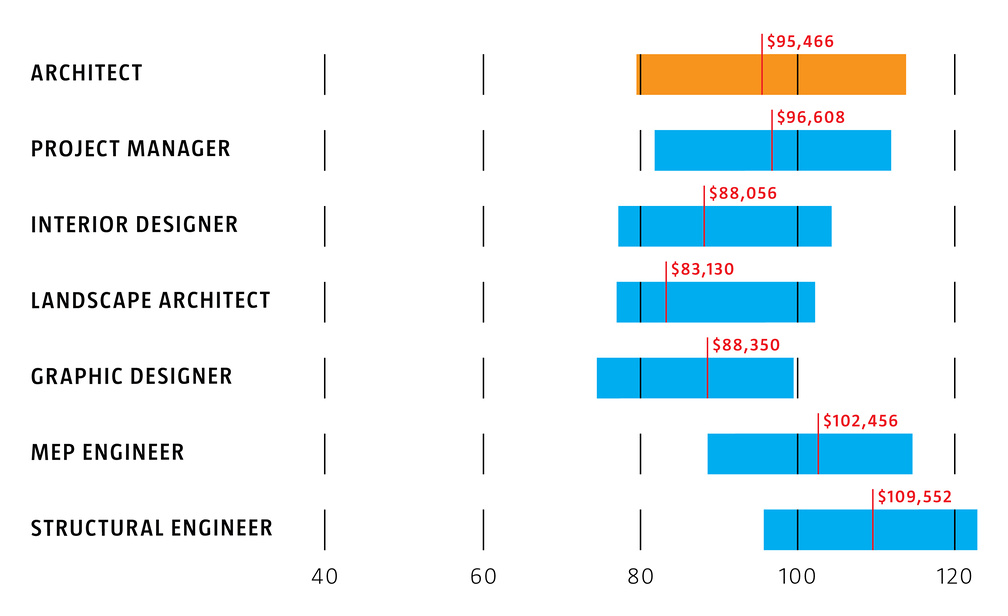
The Question of Licensure: Seven Years is Enough
January 2013 – Chart comparing study tracks for Architect Magazine, Washington D.C. (US).
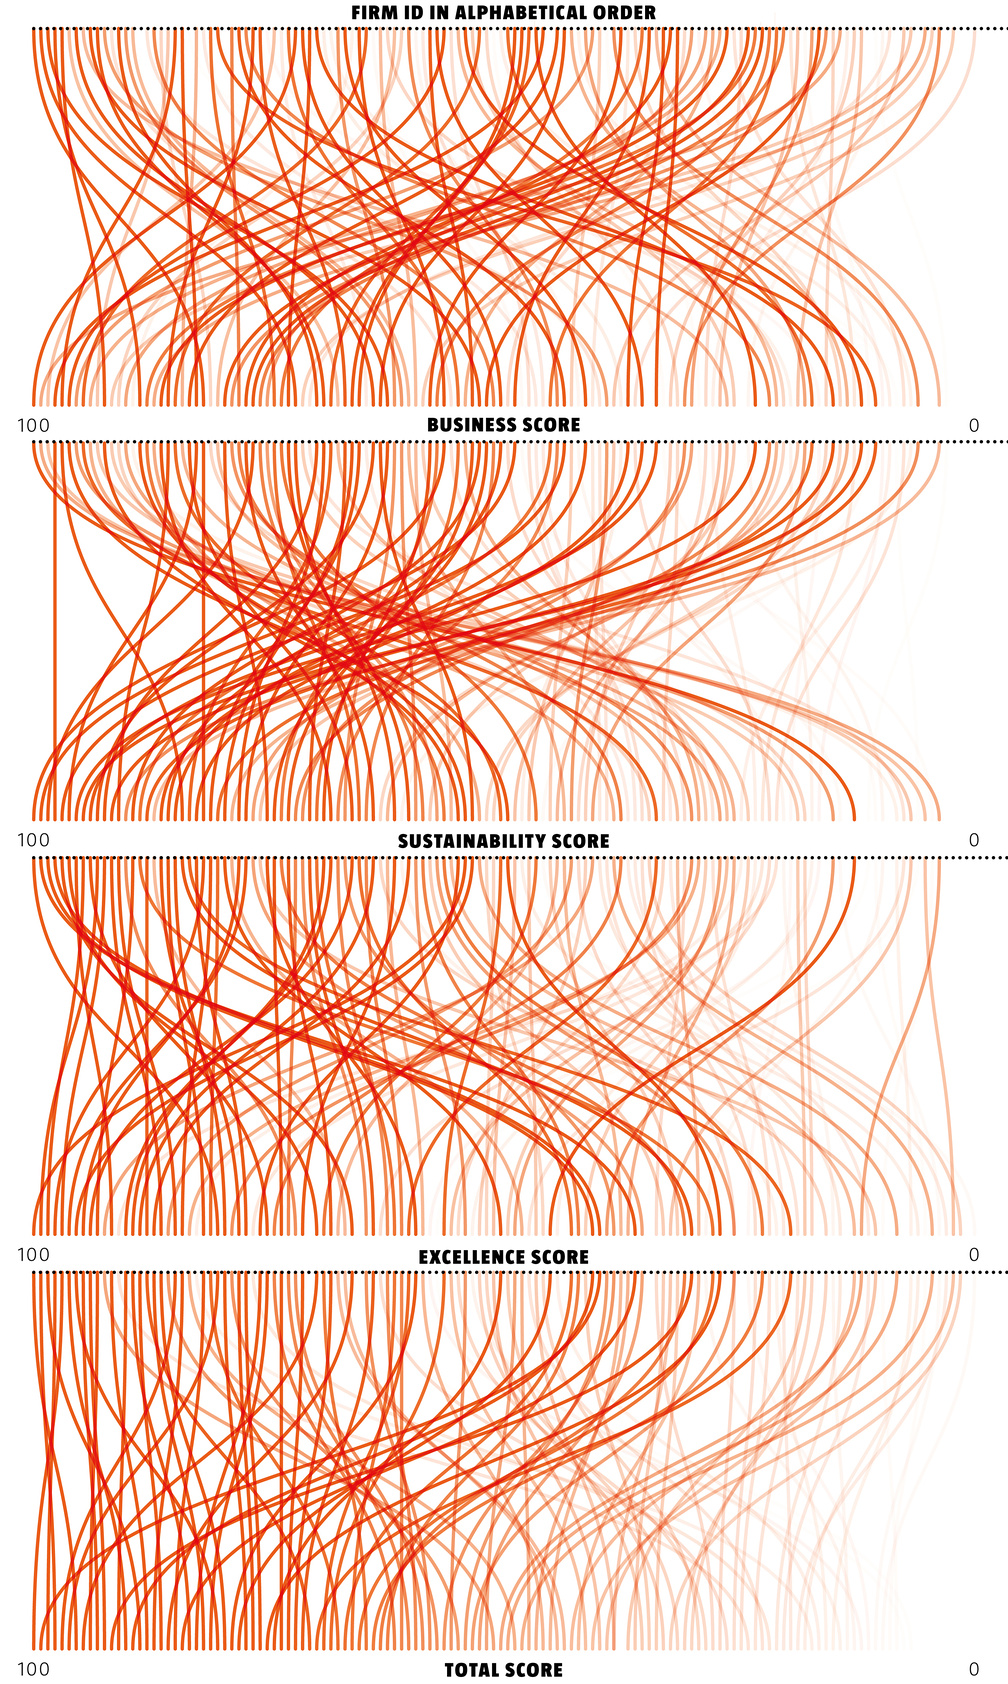
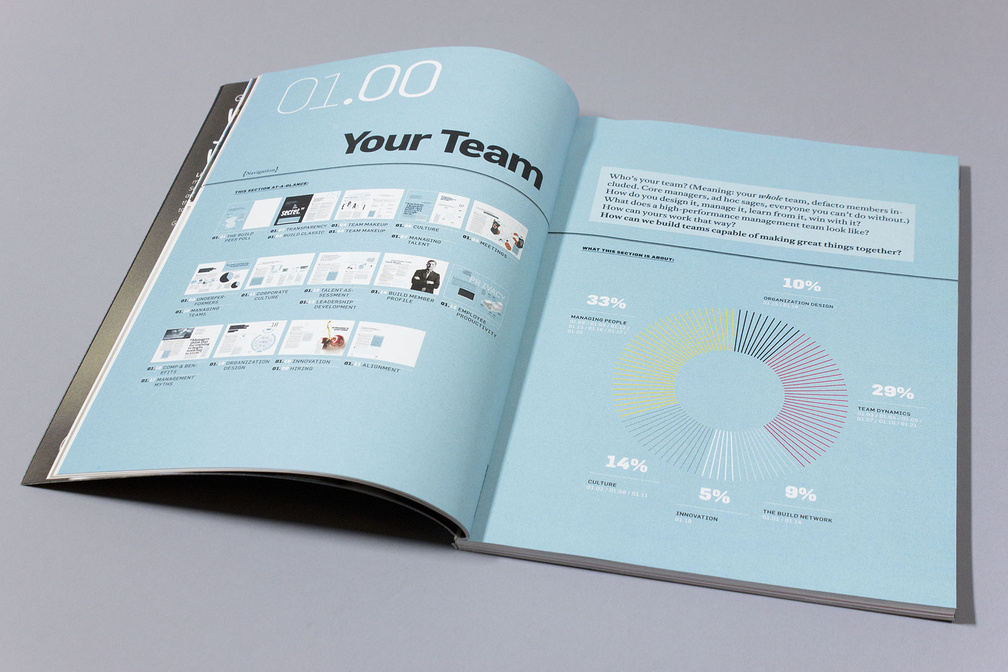
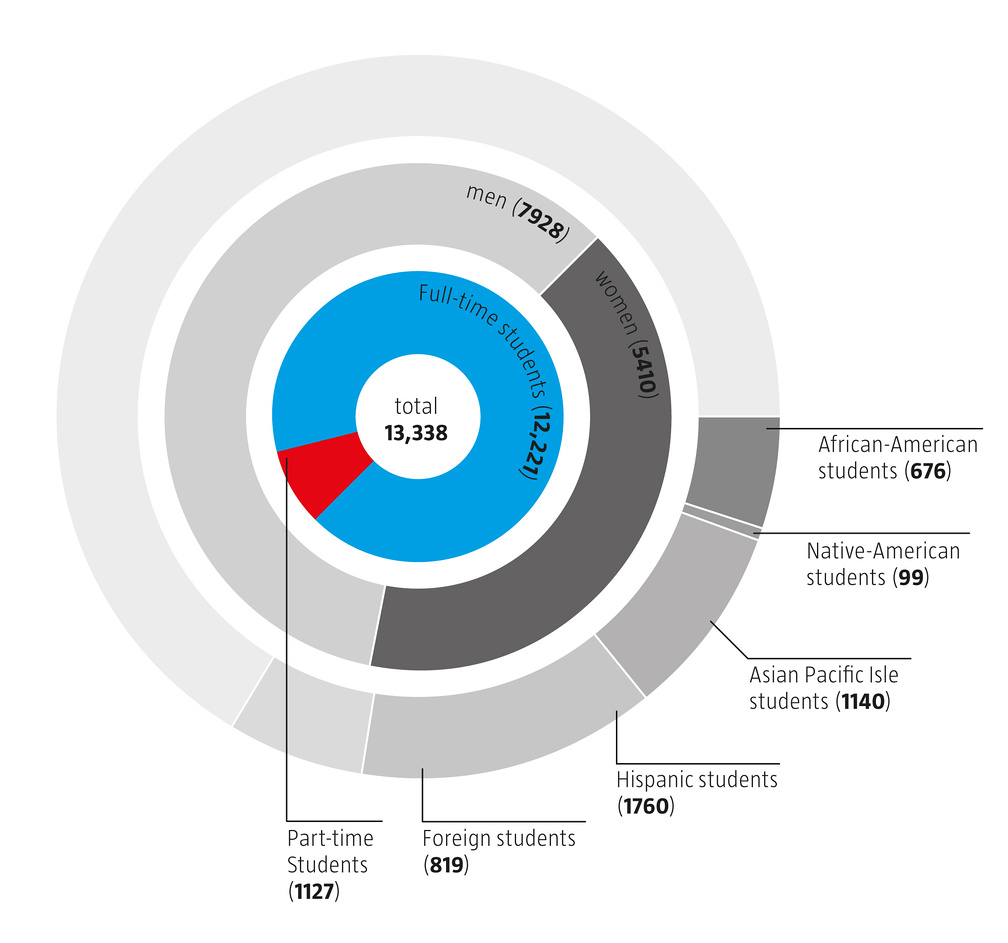
September 2012 – Data visualizations of the magazine's annual ranking of architecture firms for Architect Magazine, Washington D.C. (US).
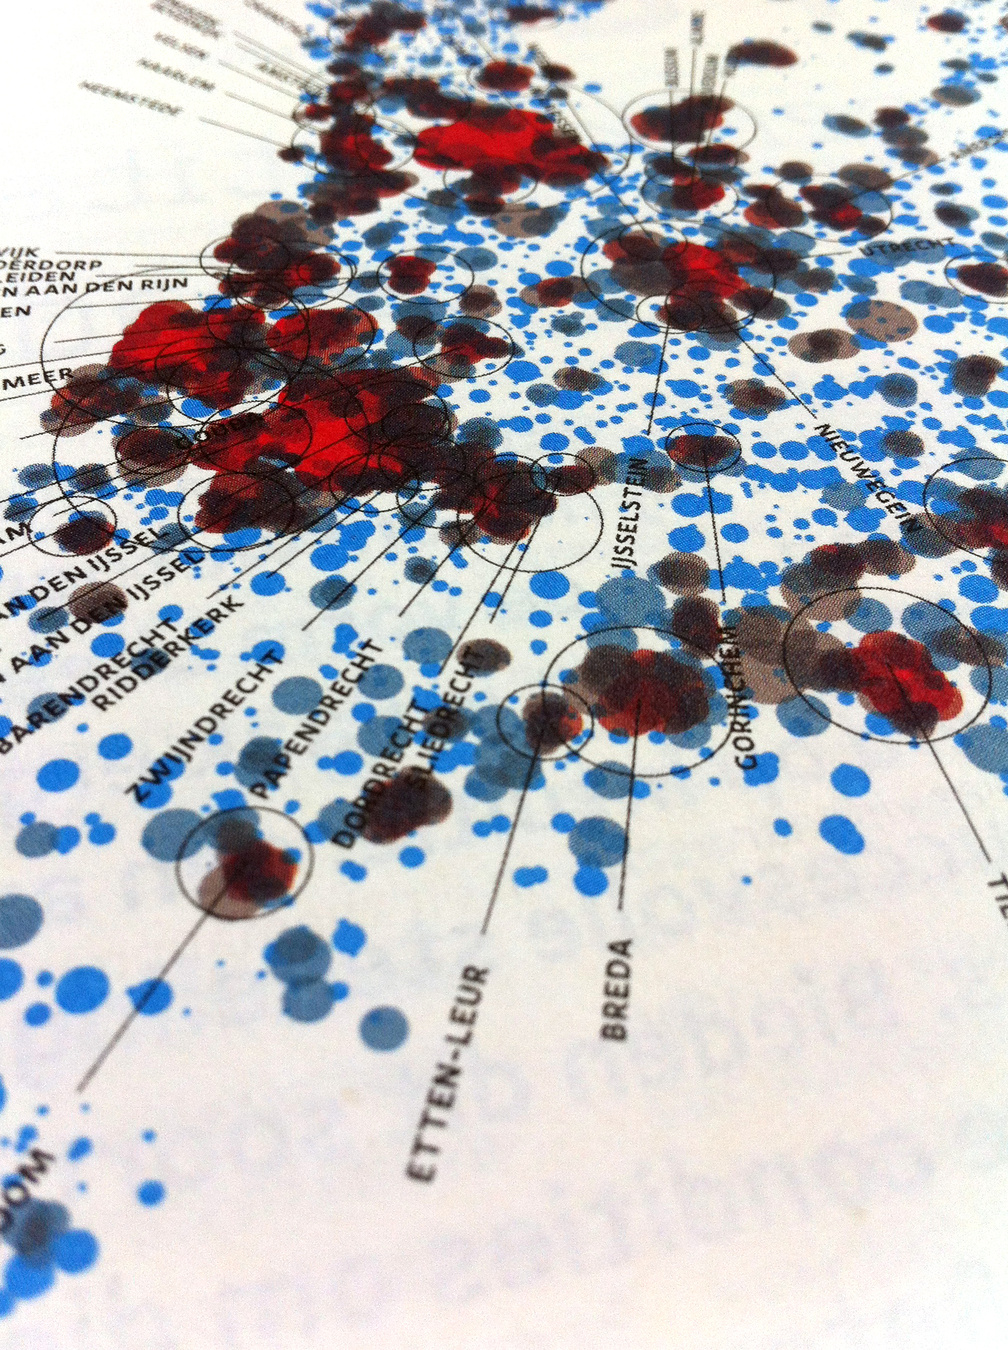
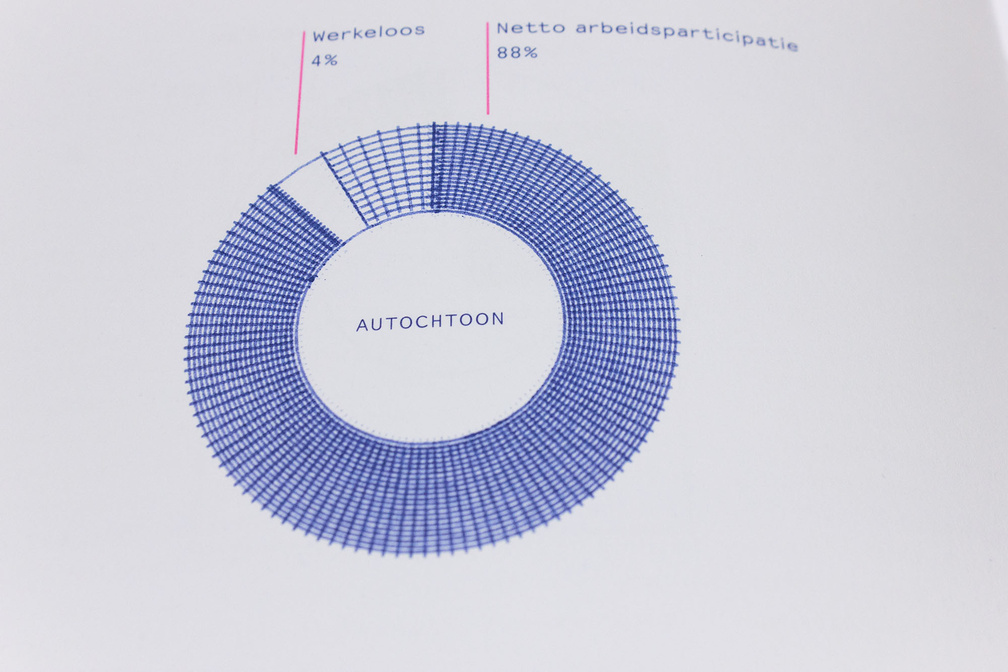
cijferstad
September 2012 – Map for S+RO magazine, The Hague (NL) that shows the urbanisation of dutch communities by neighbourhoods. The size of the circles is based on the population, the color on the amount of addresses/km2.
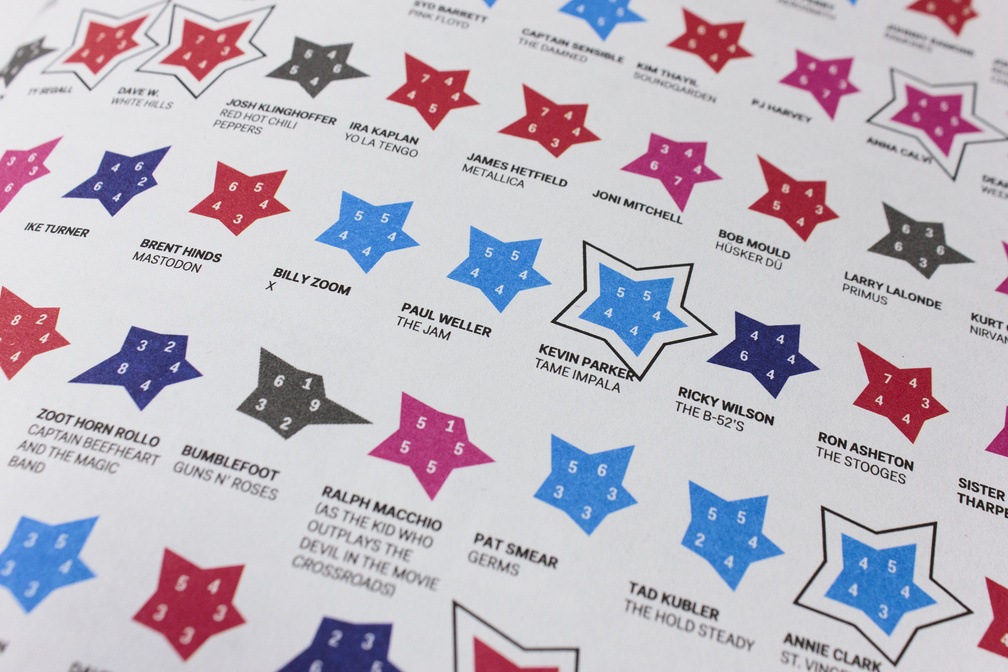
May 2012 – Infographic for music magazine SPIN. Visualization of a subjective classification of guitar players depending on their scores at the five categories: Volume, Shreditude, Technique, Emotion and Originality.
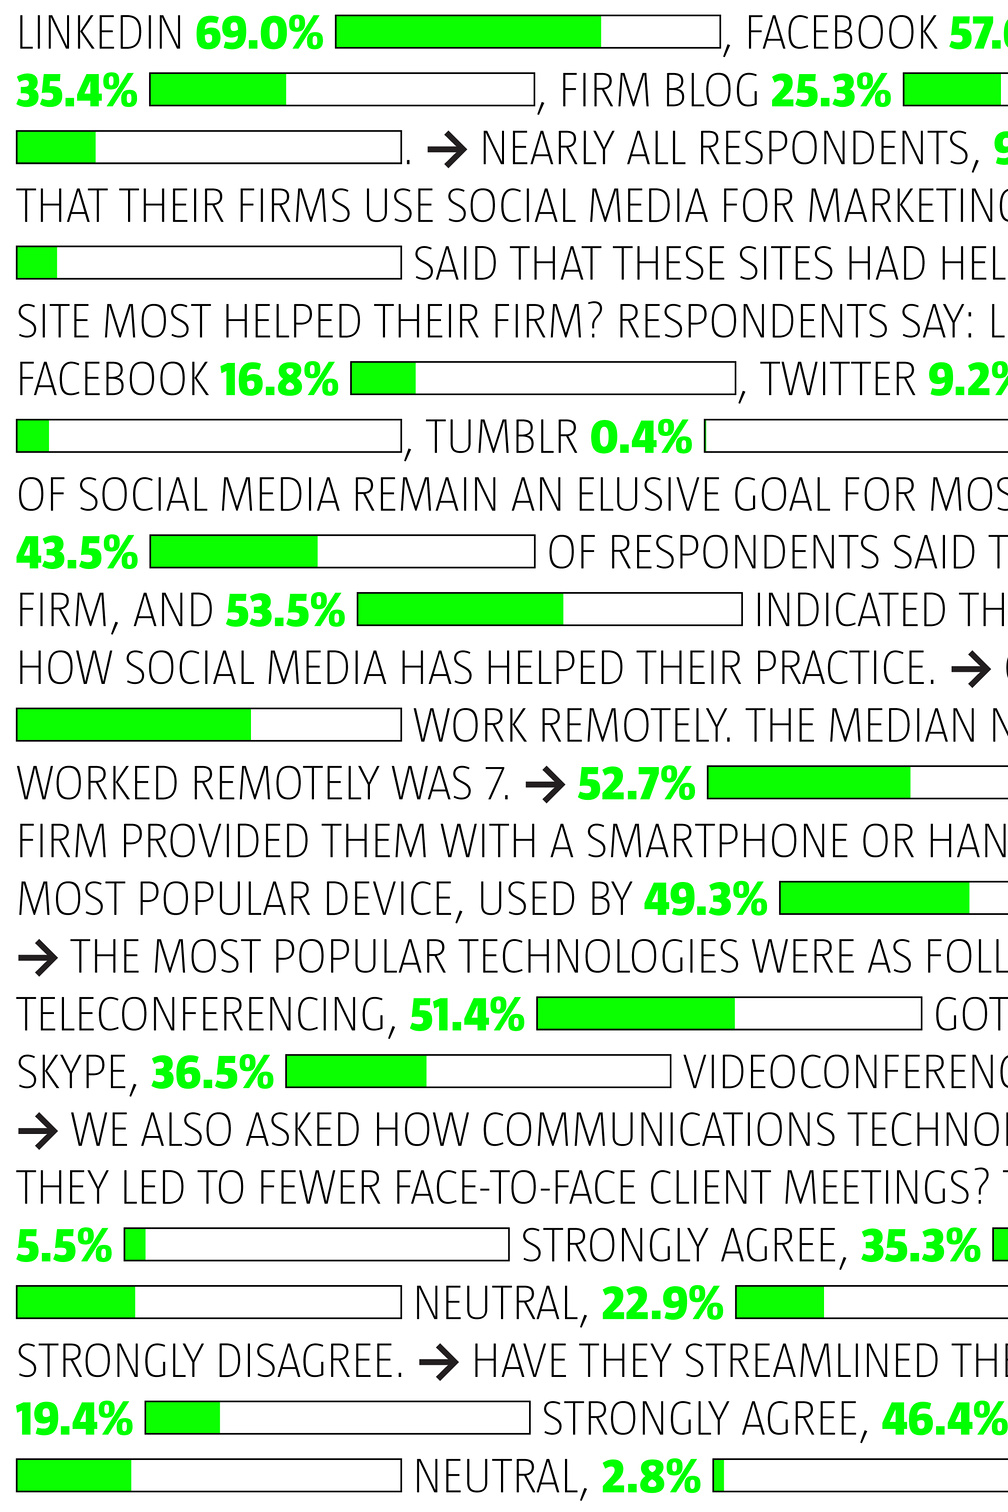
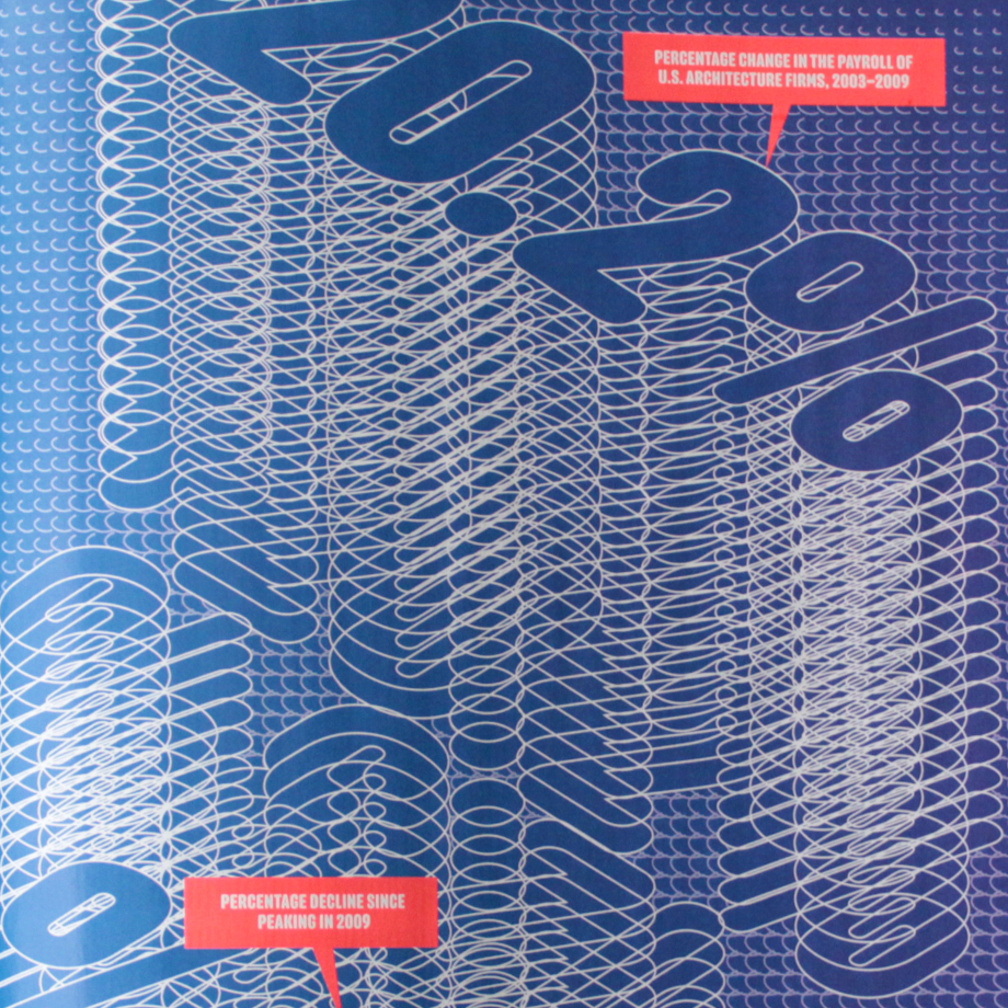
January 2012 – Typographical data visualizations on the benefits of social media for Architect Magazine, Washington D.C. (US).
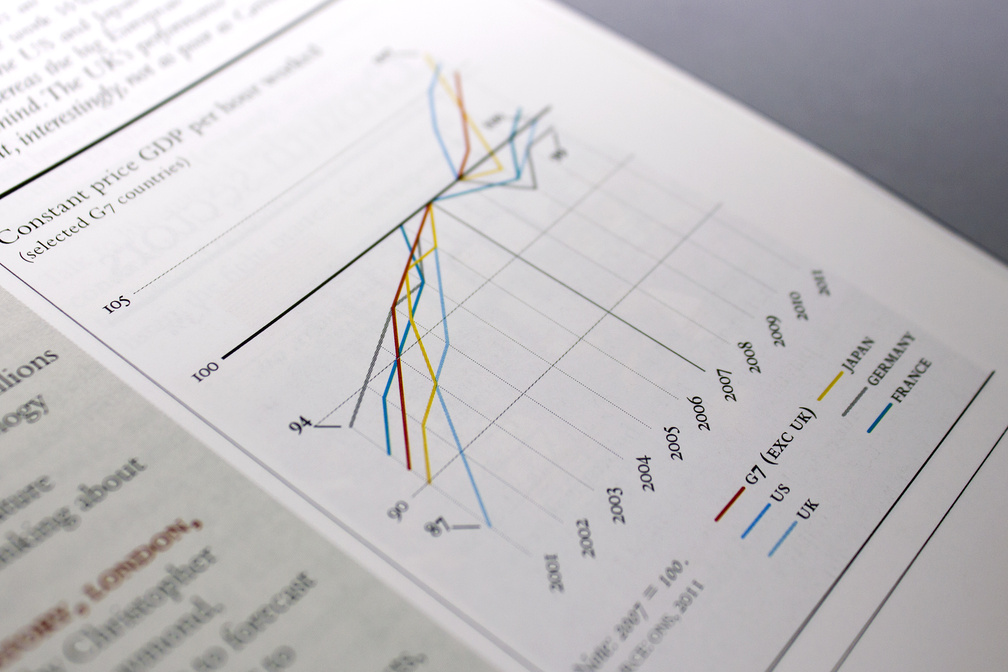
September 2011 – Charts for The Clydesdale and Yorkshire Bank Journal, London (GB).
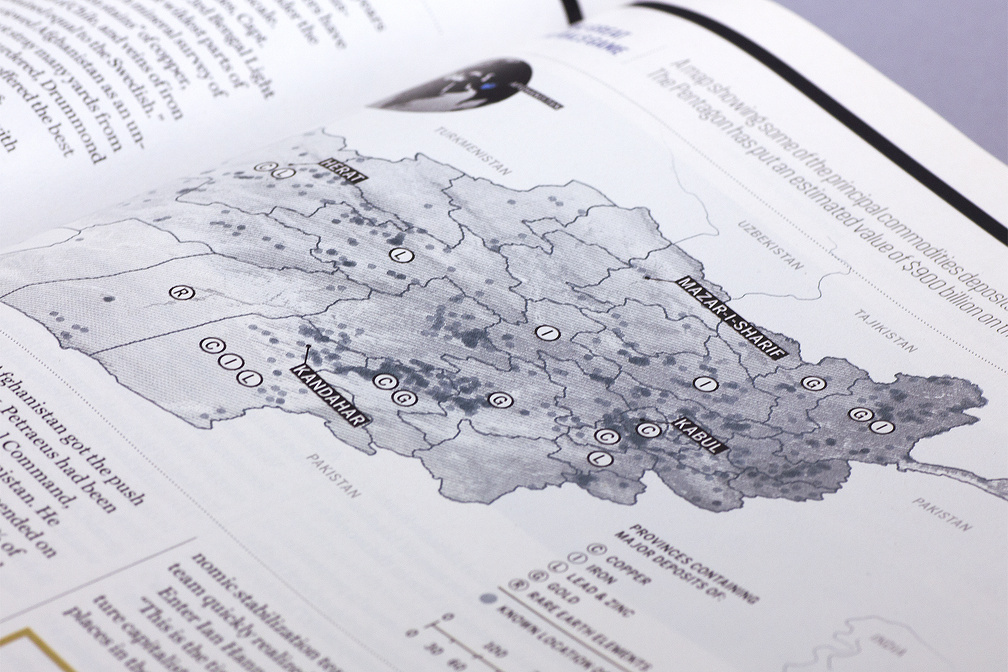
The Great Minerals Game
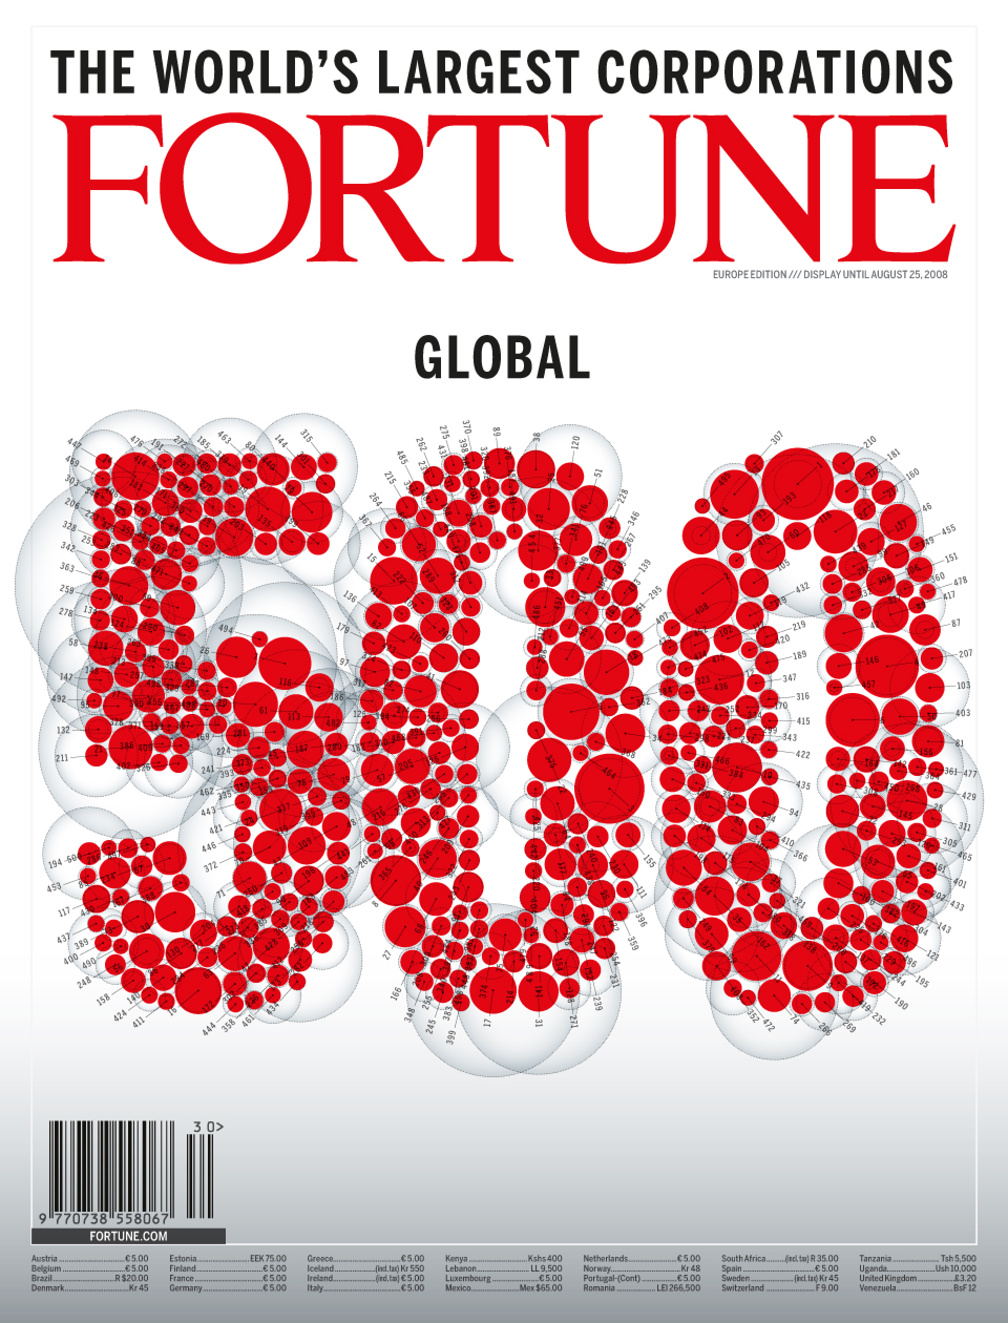
May 2011 – Map showing some of the principal commodities deposits in Afghanistan for Fortune Magazine, New York (US).
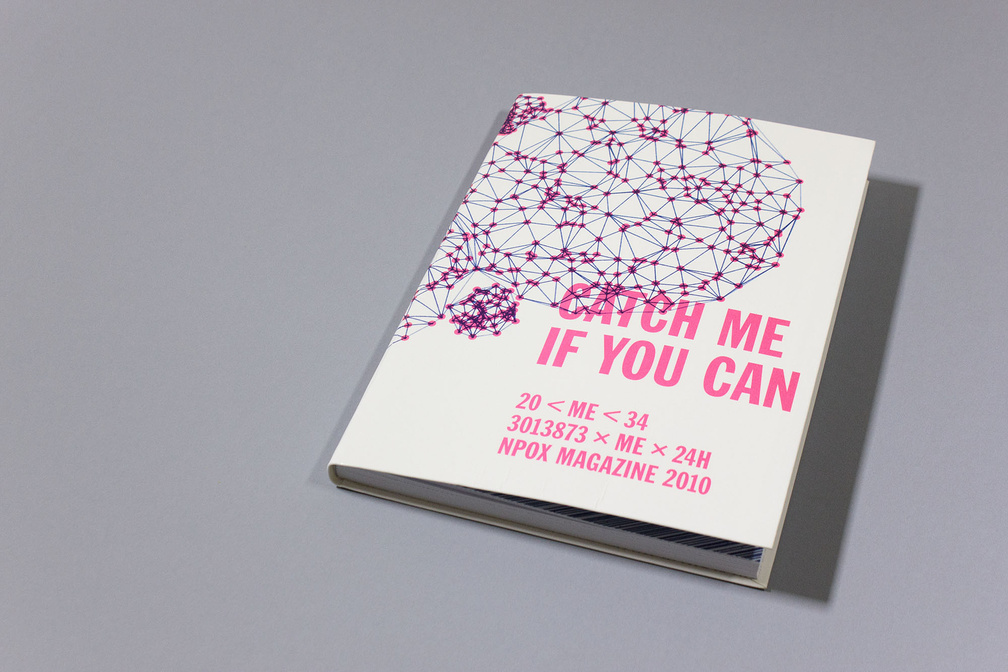
September 2010 – Magazine 'Catch me if you can' on the occasion of the NPOX10 FESTIVAL organised by NPO, Hilversum (NL).
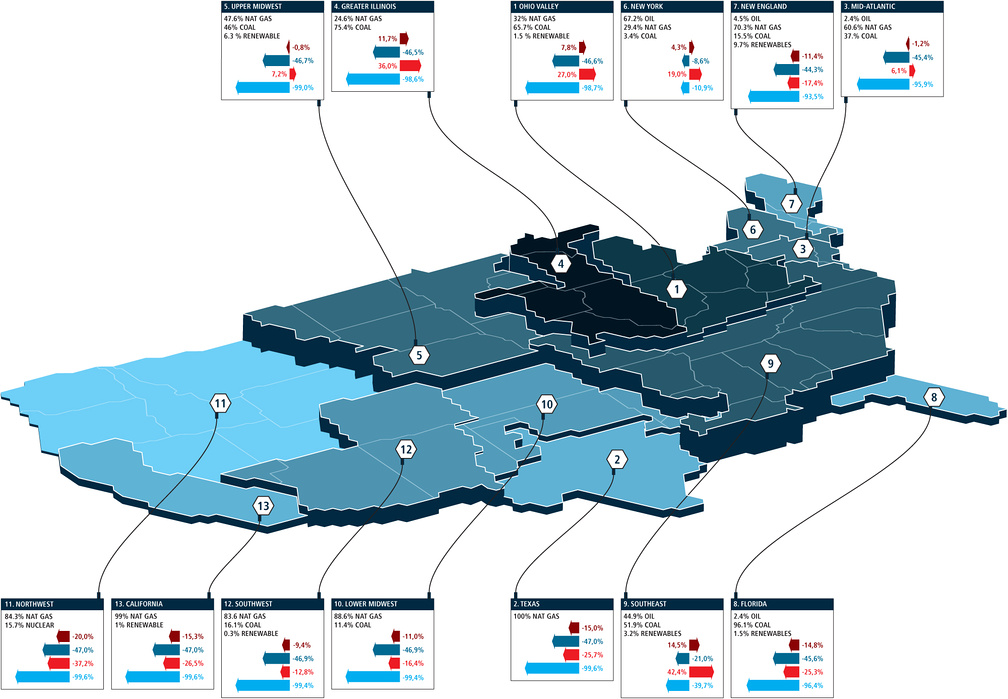
The Dirty Truth about Plug-In Hybrids
April 2010 – Map showing sustainable energy in the 13 electric power grid regions of the U.S. for Scientific American, New York (US).

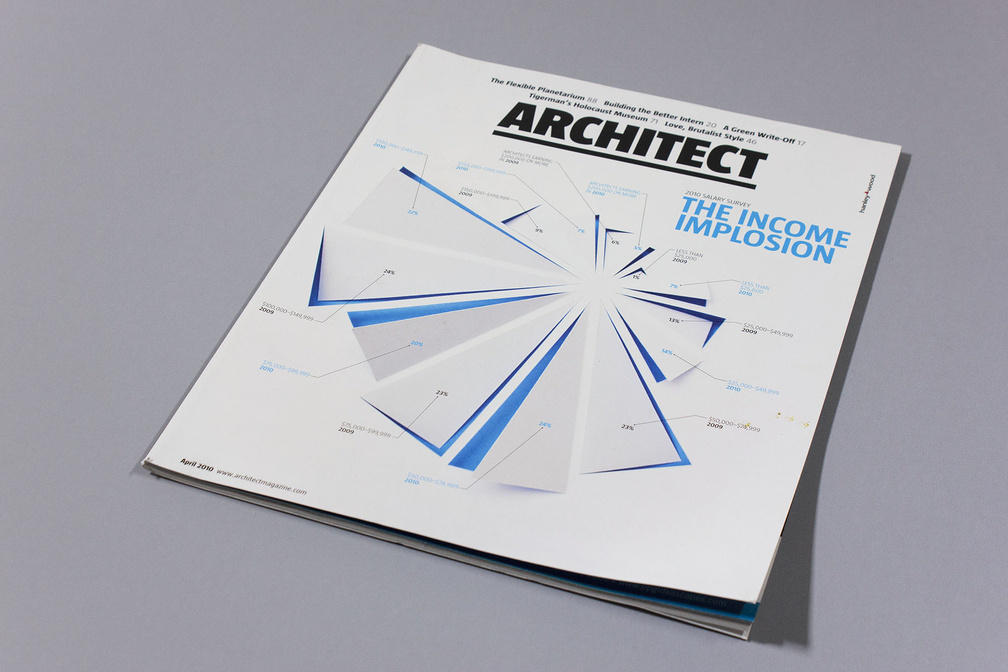
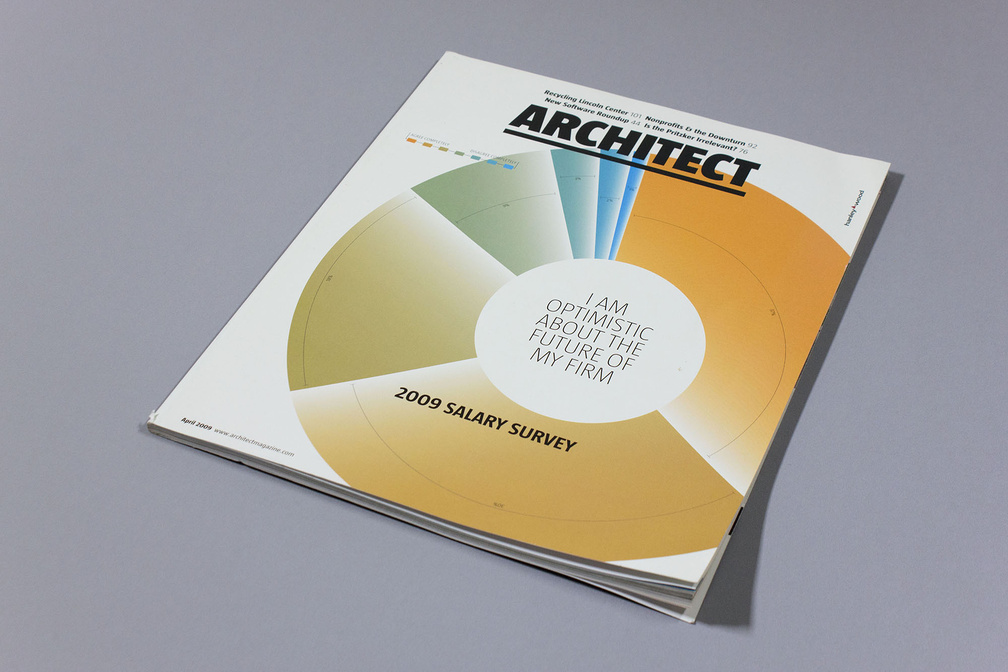
The Income Implosion: cover
March 2010 – Cover for Architect Magazine, Washington D.C. (US). In collaboration with Eva Thiessies (photography) .
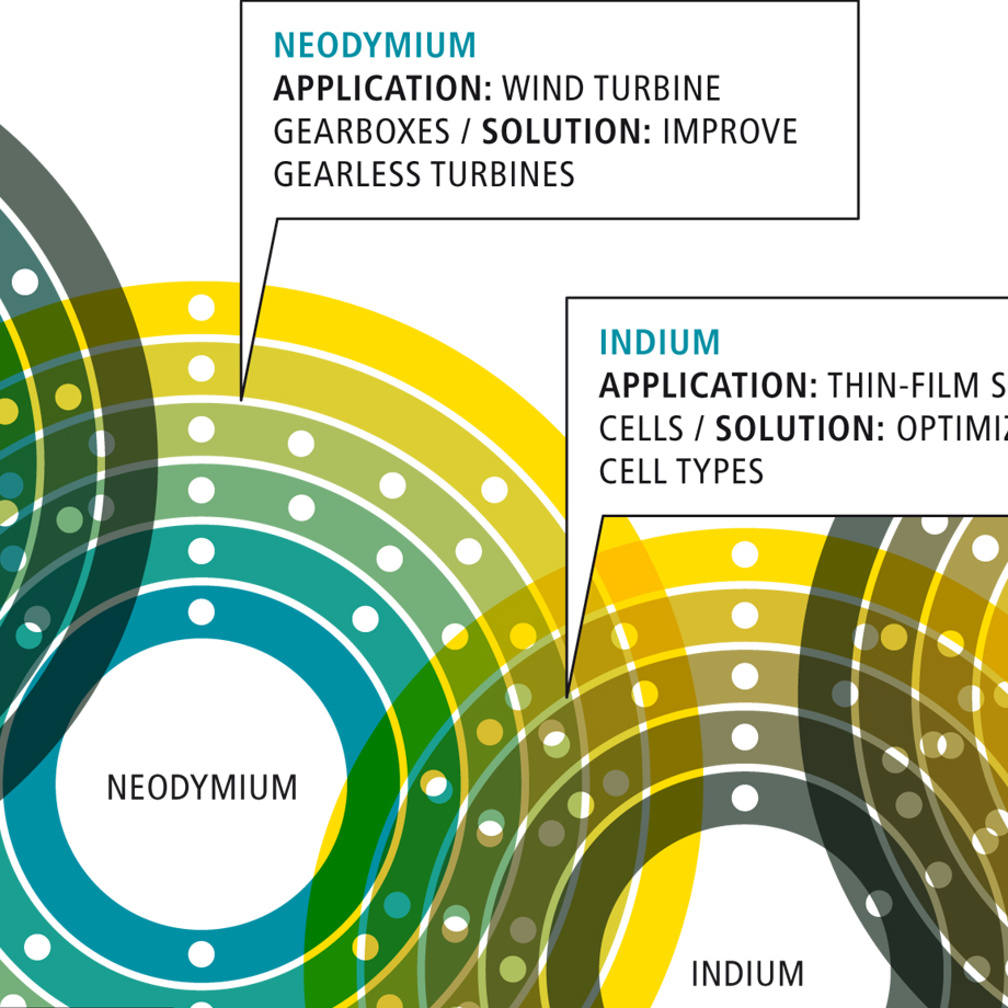
A Path to Sustainable Energy by 2030
October 2009 – Diagrams (detail) for Scientific American, New York (US). In collaboration with Eva Thiessies (intern) .
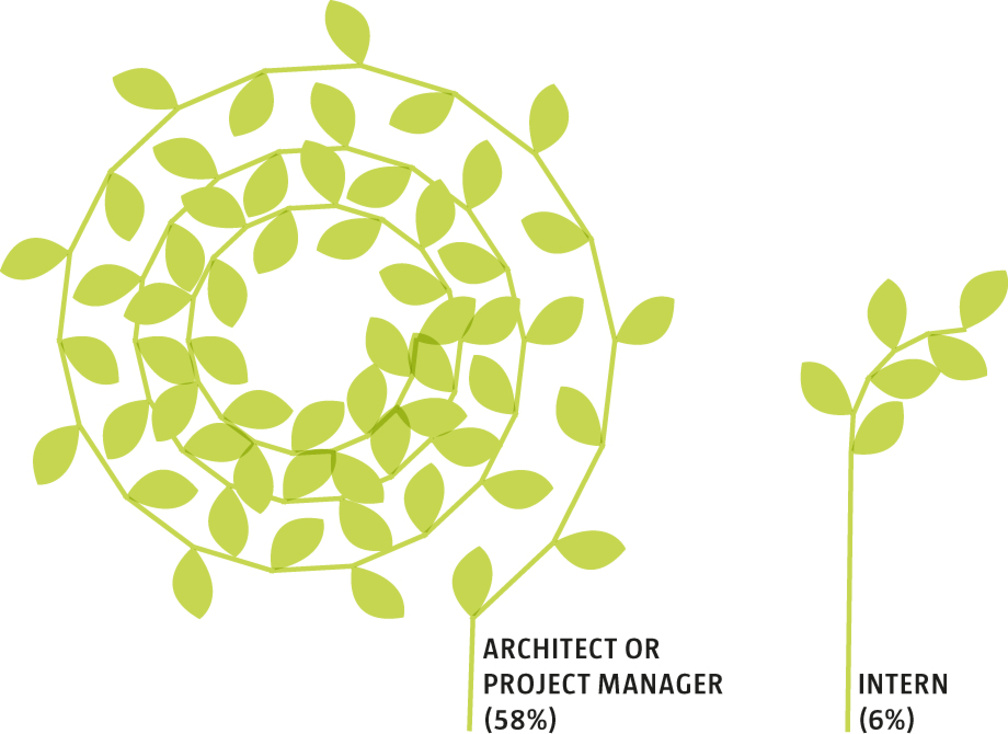
Do Architects Believe In Global Warming?
October 2009 – Diagrams (detail) for Architect Magazine, Washington D.C. (US). In collaboration with Eva Thiessies (intern) .
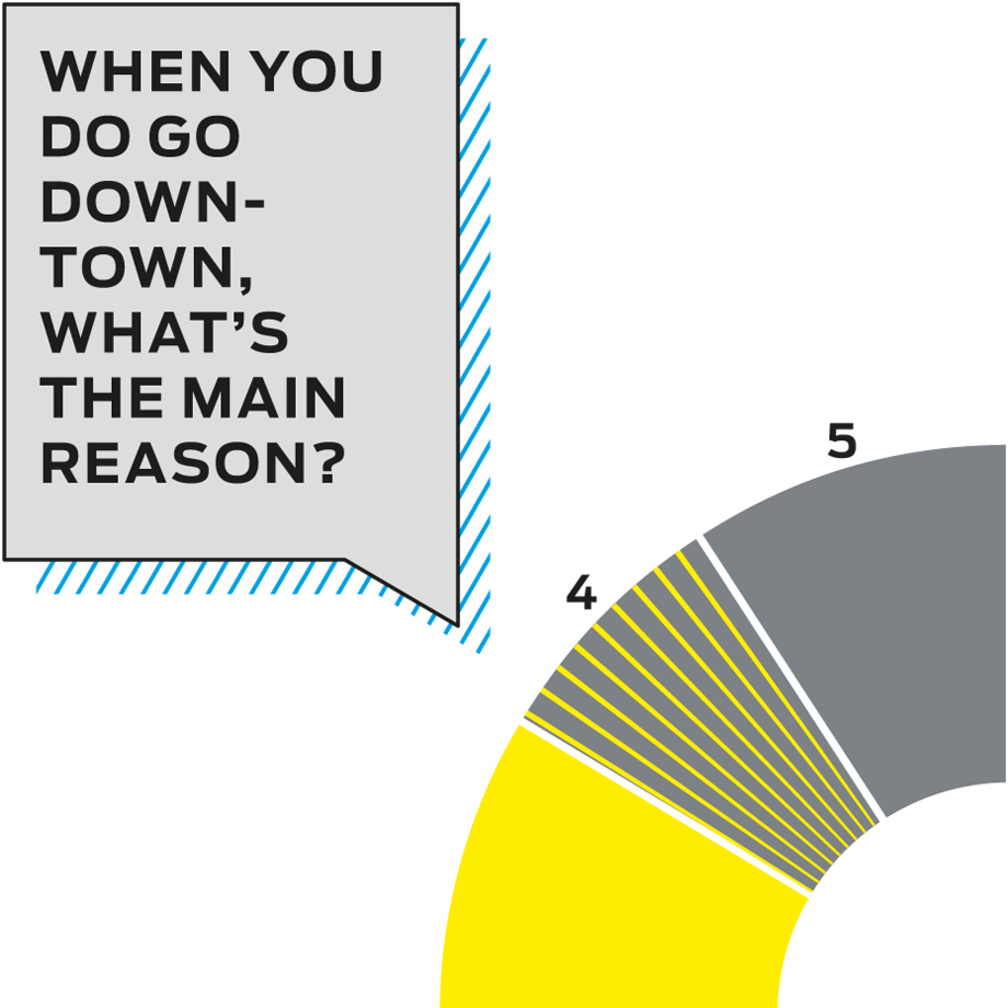
Downtown
July 2009 – Charts (detail) for Cincinnati Magazine, Cincinnati (US). In collaboration with Eva Thiessies (intern) .
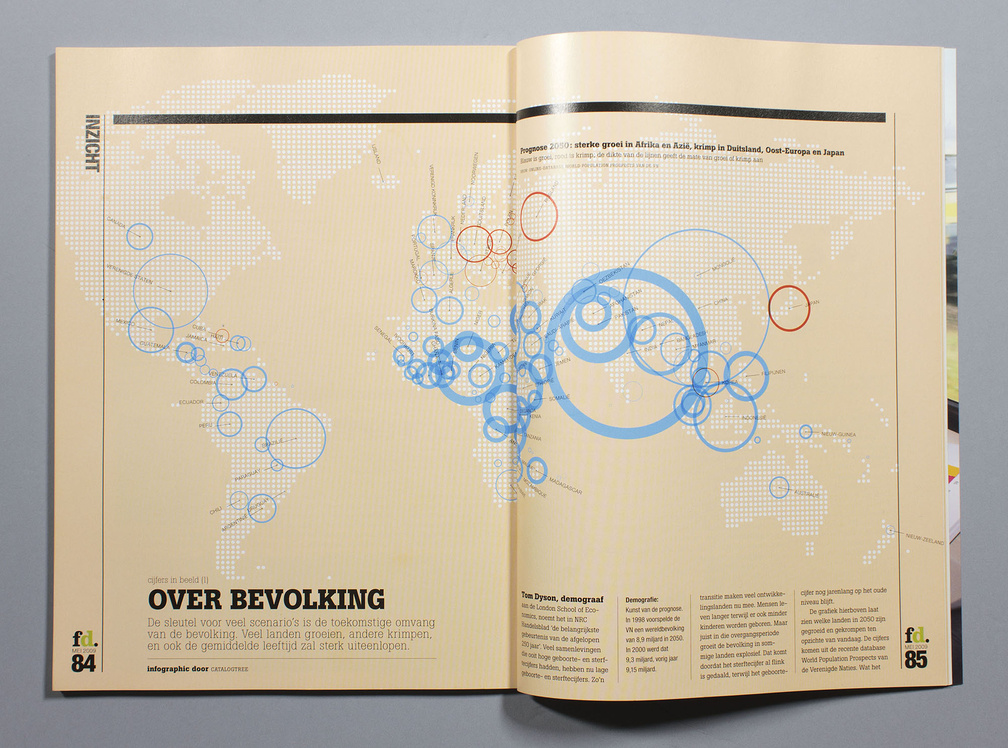
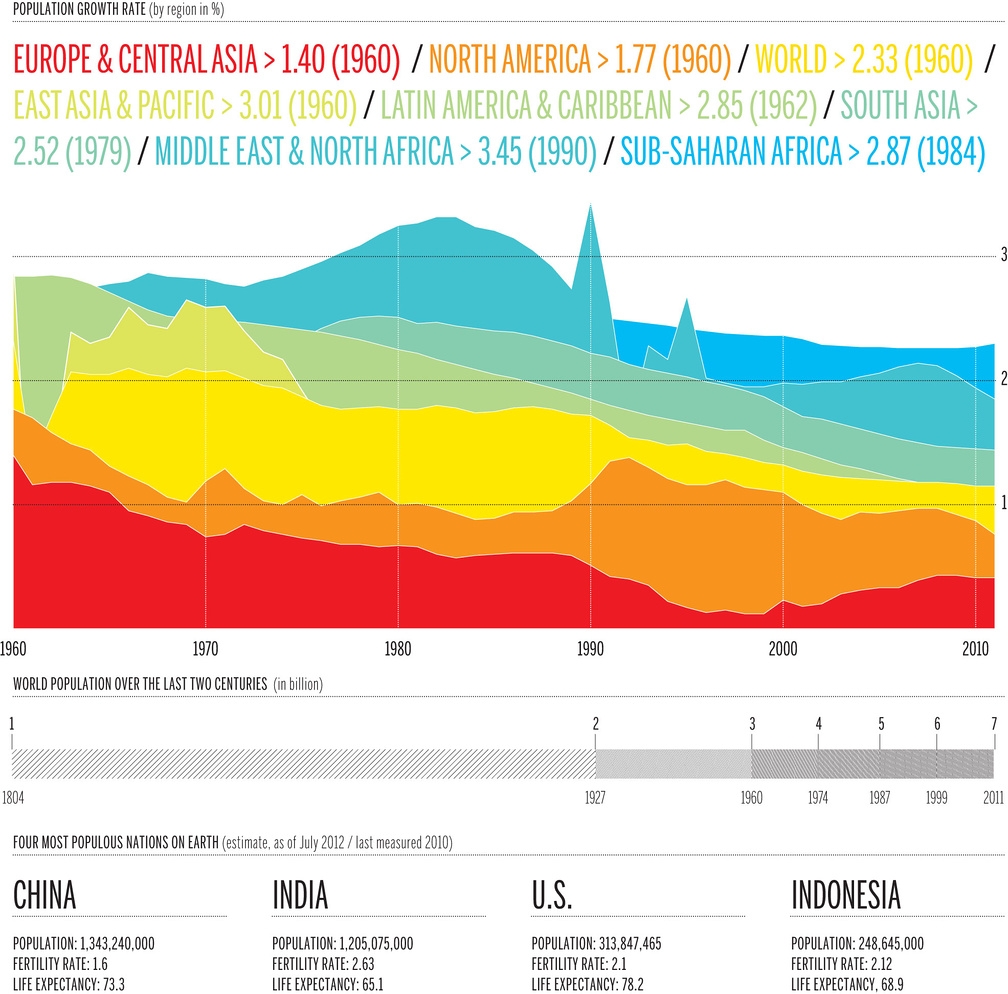
Over bevolking
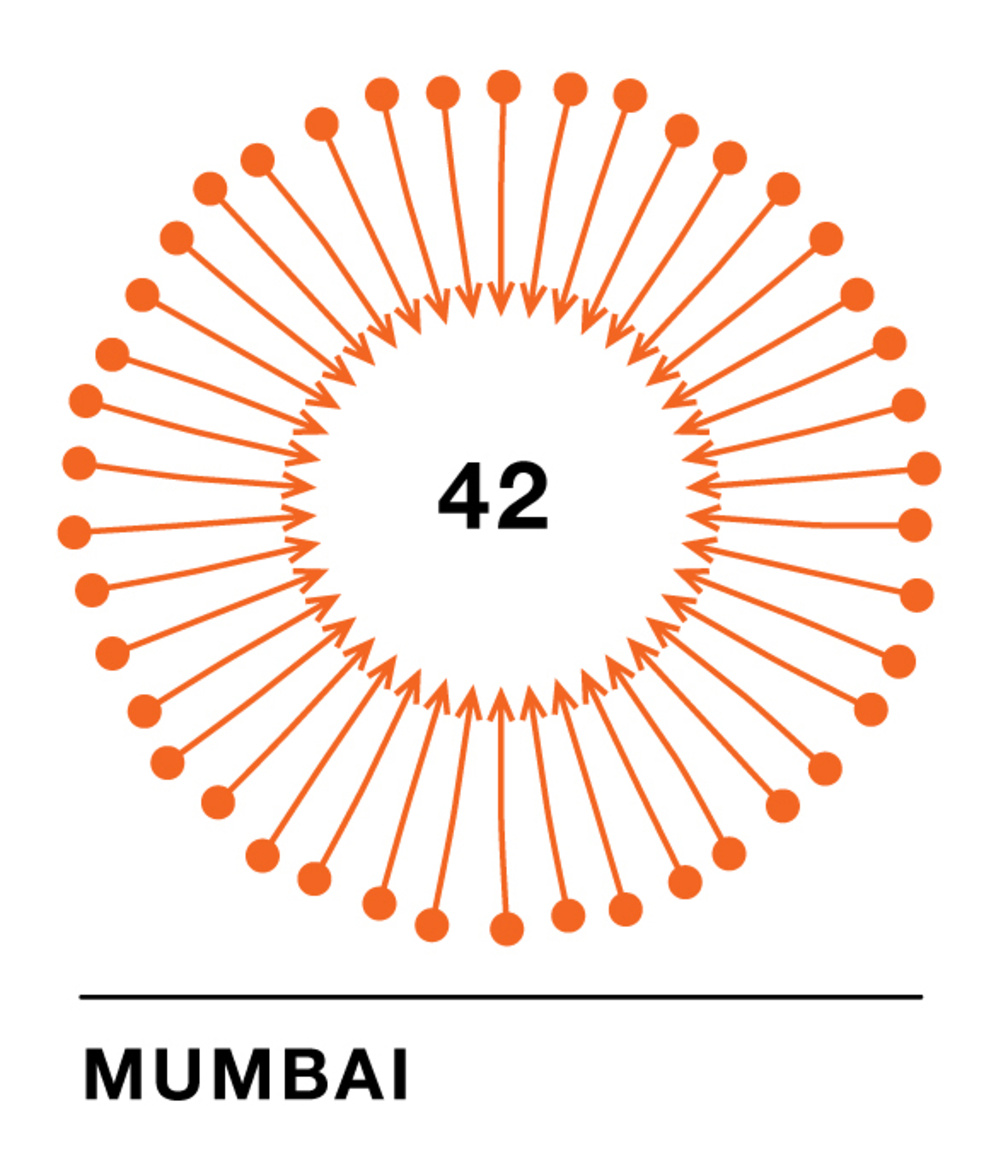
May 2009 – Map on population growth by city until 2050 for fd Outlook, Amsterdam (NL).

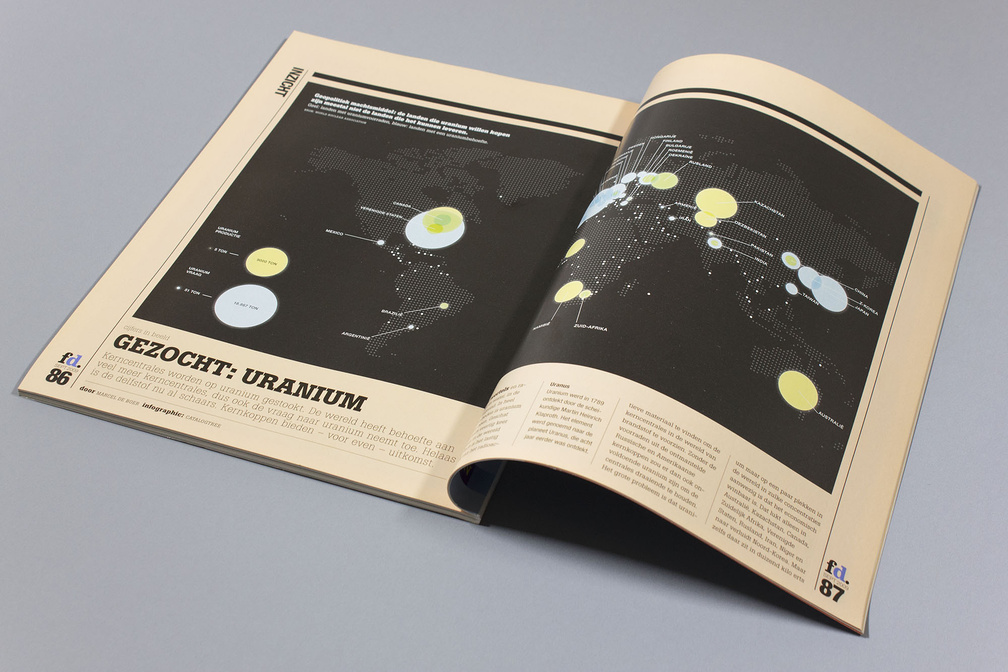
Gezocht: Uranium
March 2009 – Infographic for FD Outlook Magazine, Amsterdam (NL). In collaboration with Thijs Gadiot (freelance) .
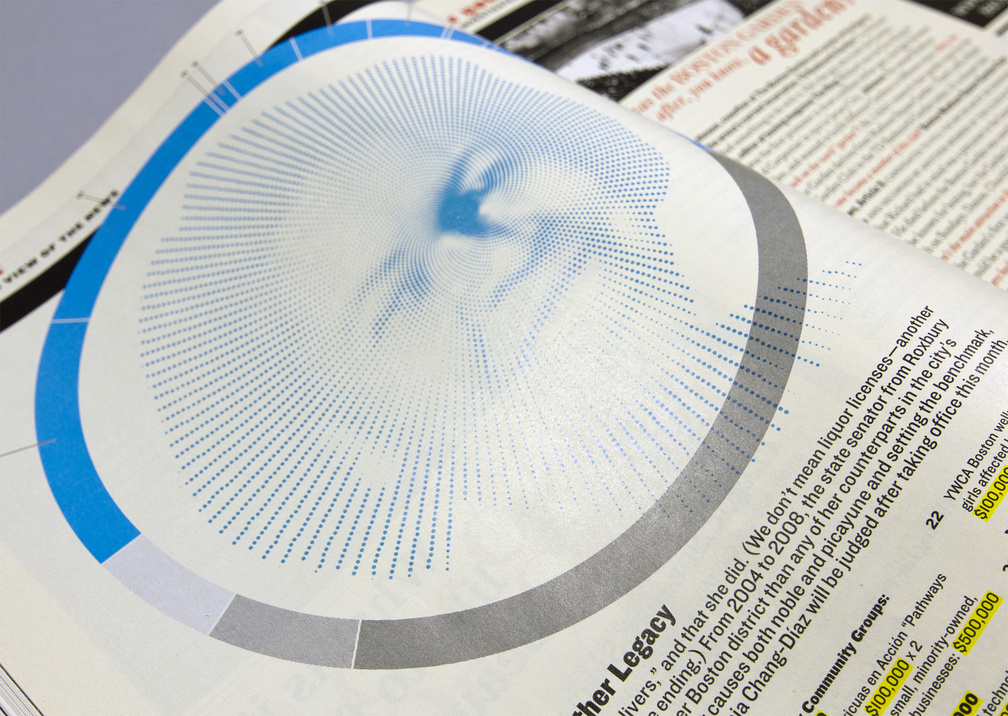
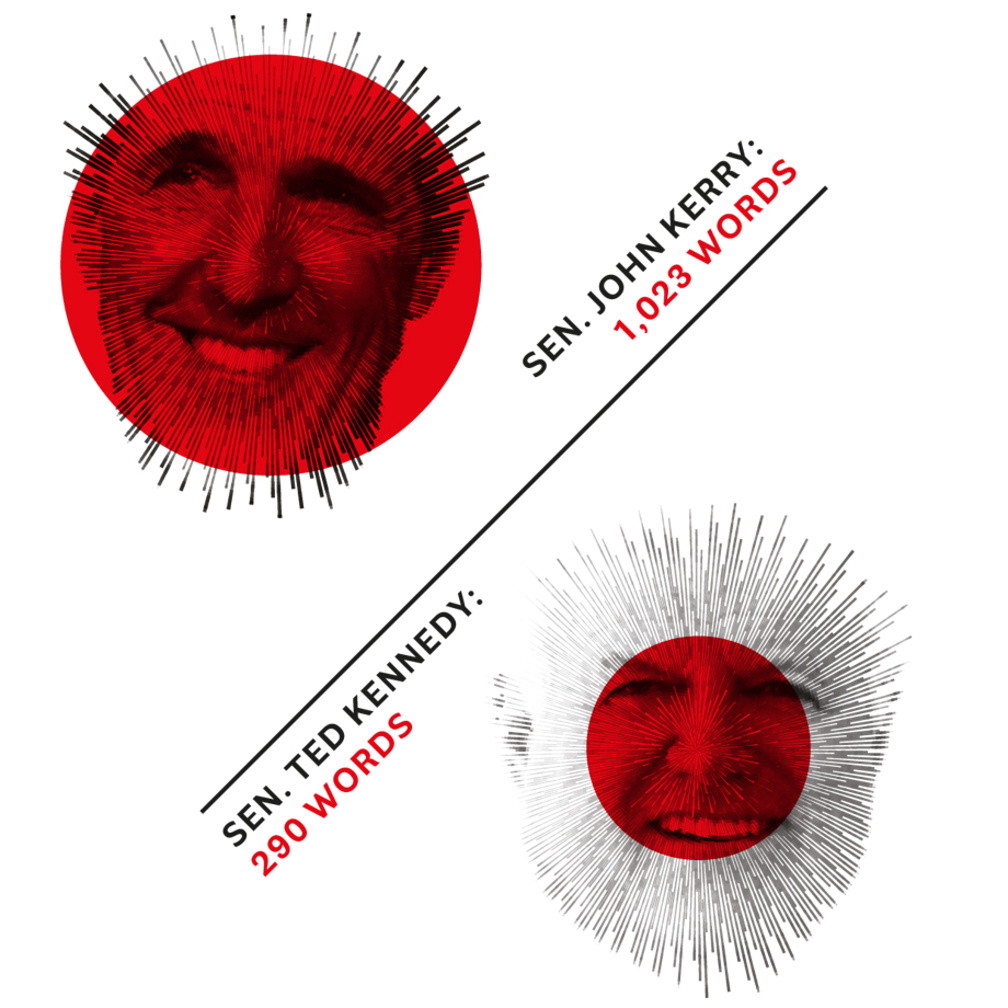
Dianne Wilkerson's Other Legacy
January 2009 – Chart and Illustration on the earmarks of state senator Dianne Wilkerson for Boston Magazine, Boston (US).
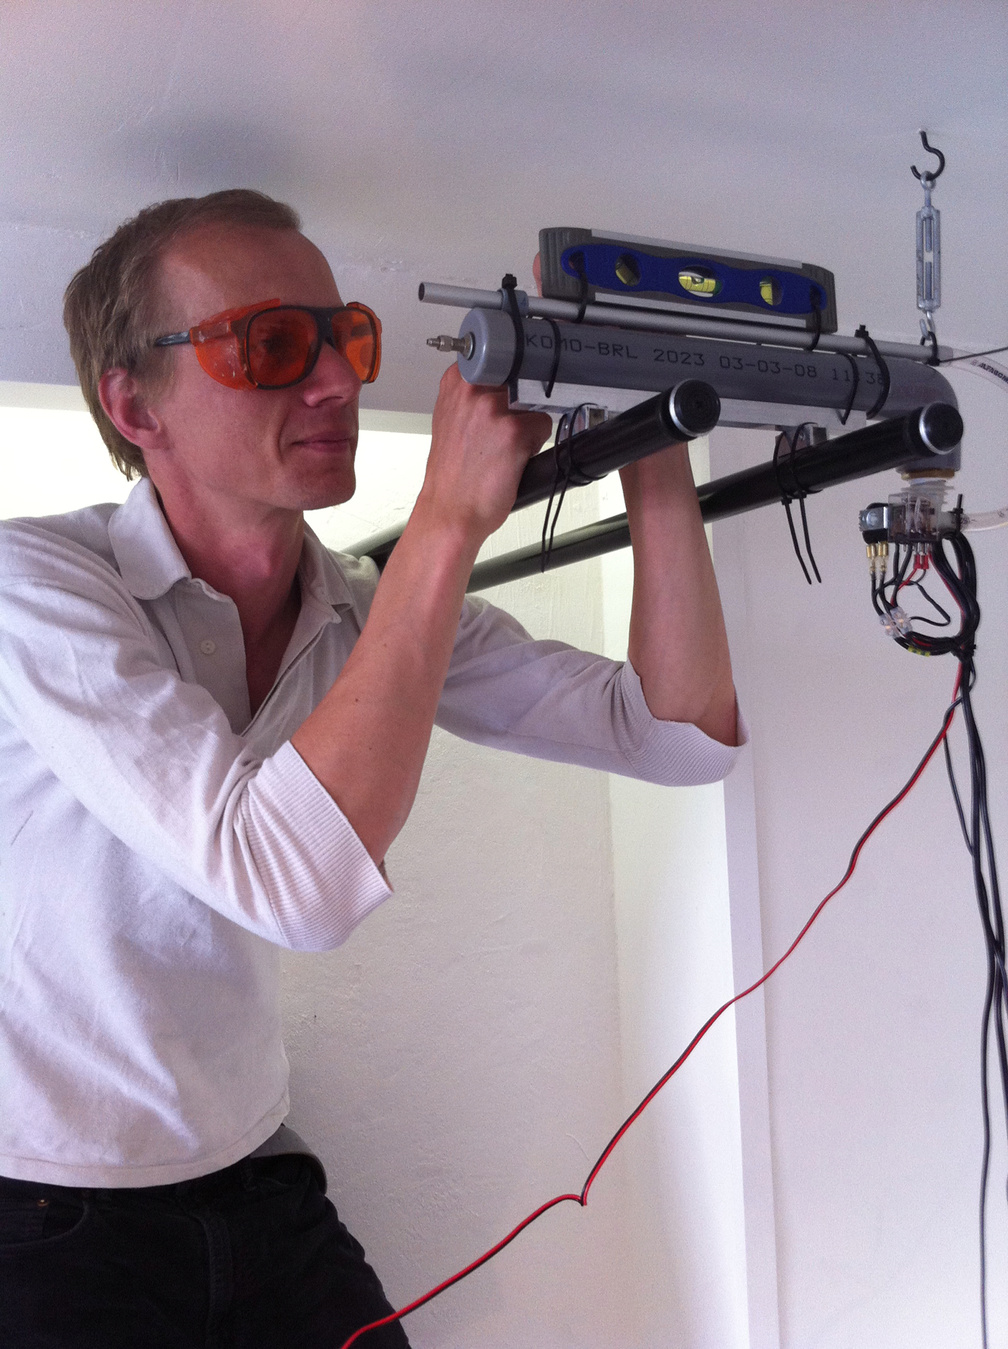
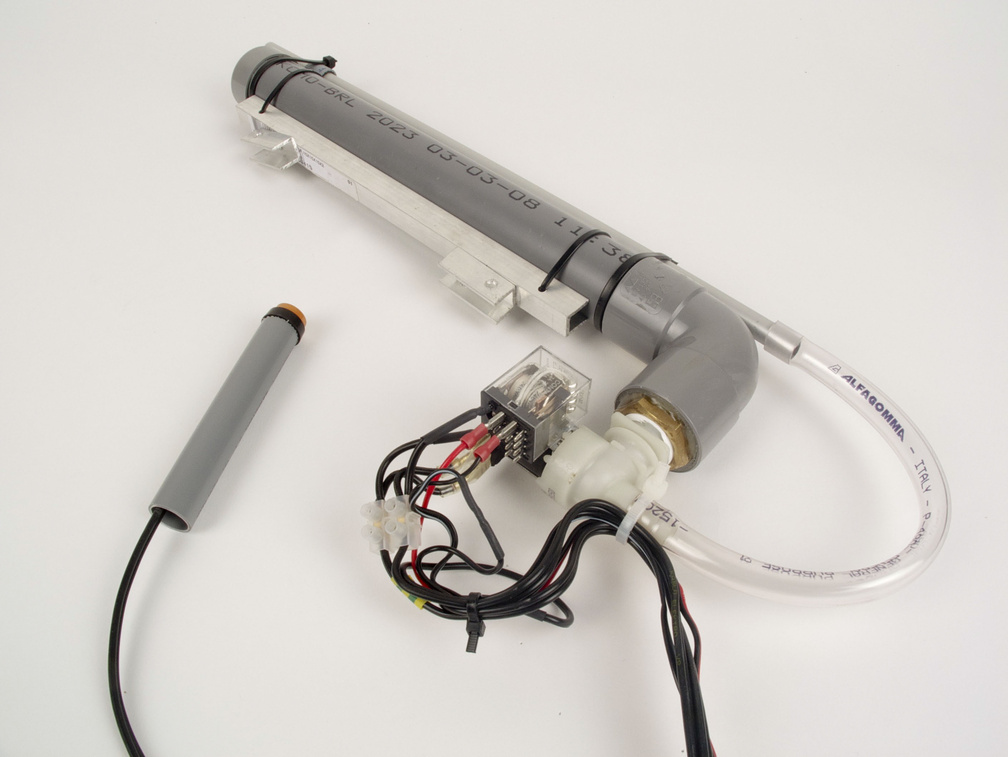
January 2009 – Experimental set-up with selfmade pneumatic pushpin firing mechanism.
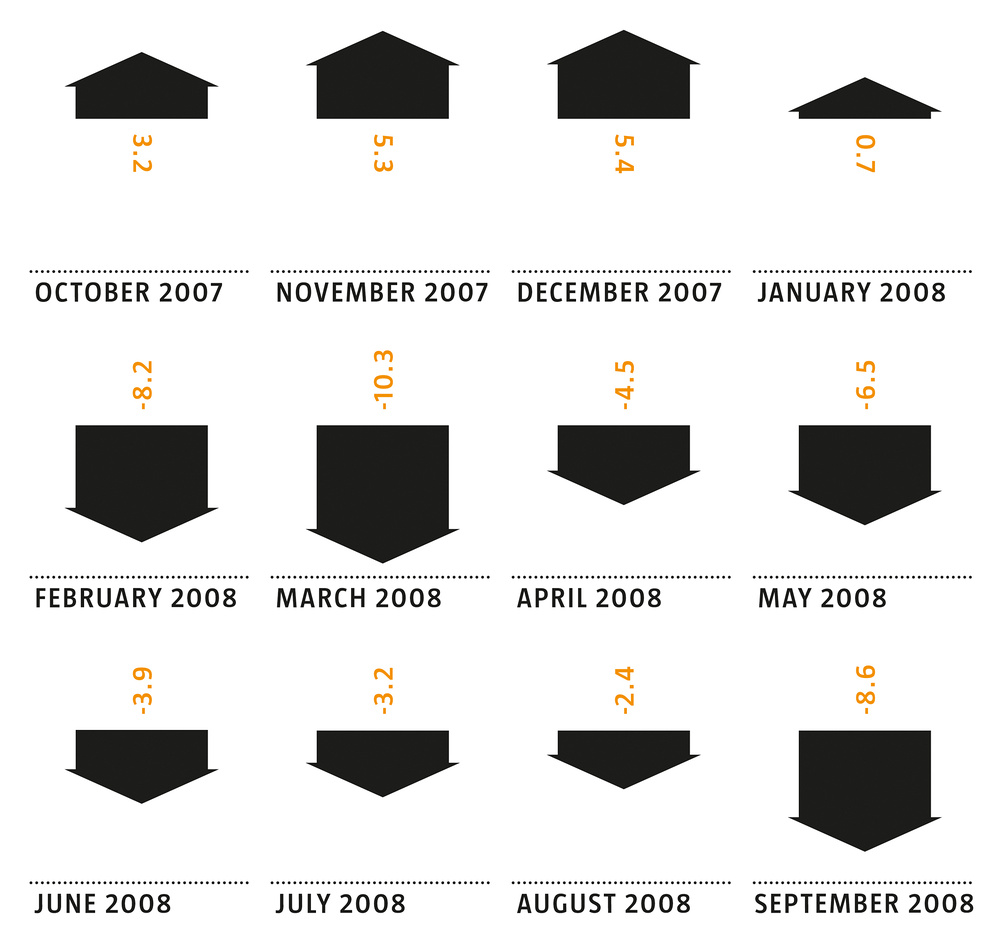
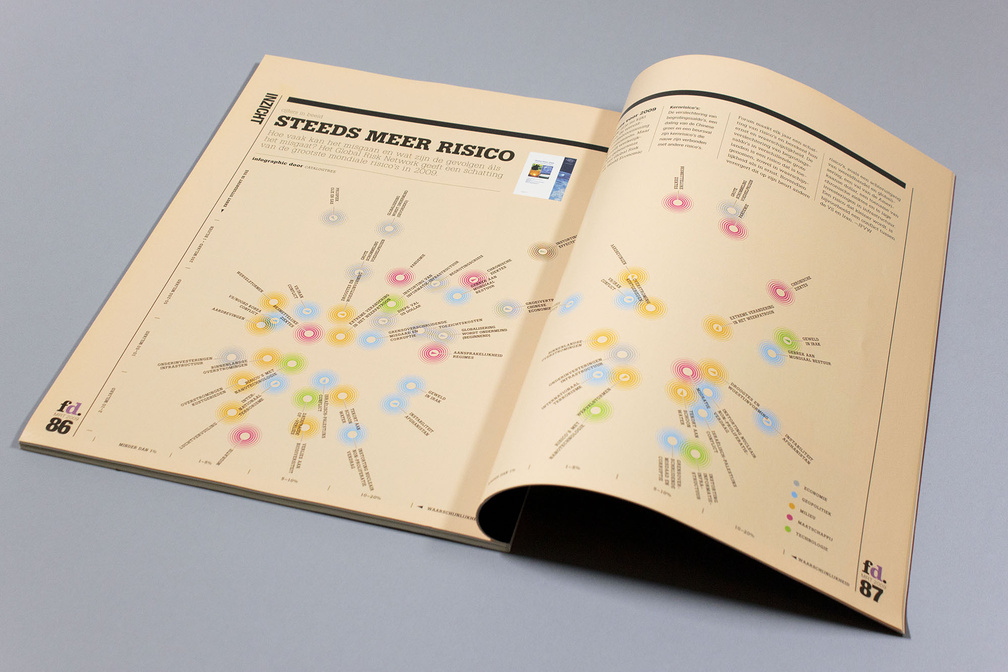
December 2008 – Infographics on six economic indicators for Architect Magazine, Washington D.C. (US).
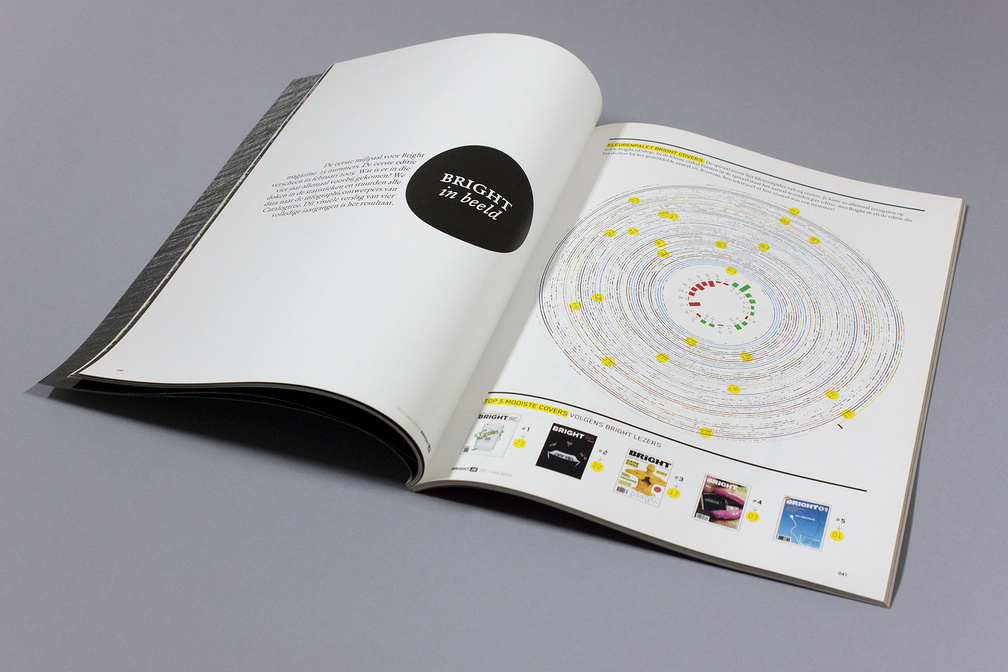
December 2008 – Series of infographics analysing all past 25 issues of BRIGHT magazine, Amsterdam (NL).
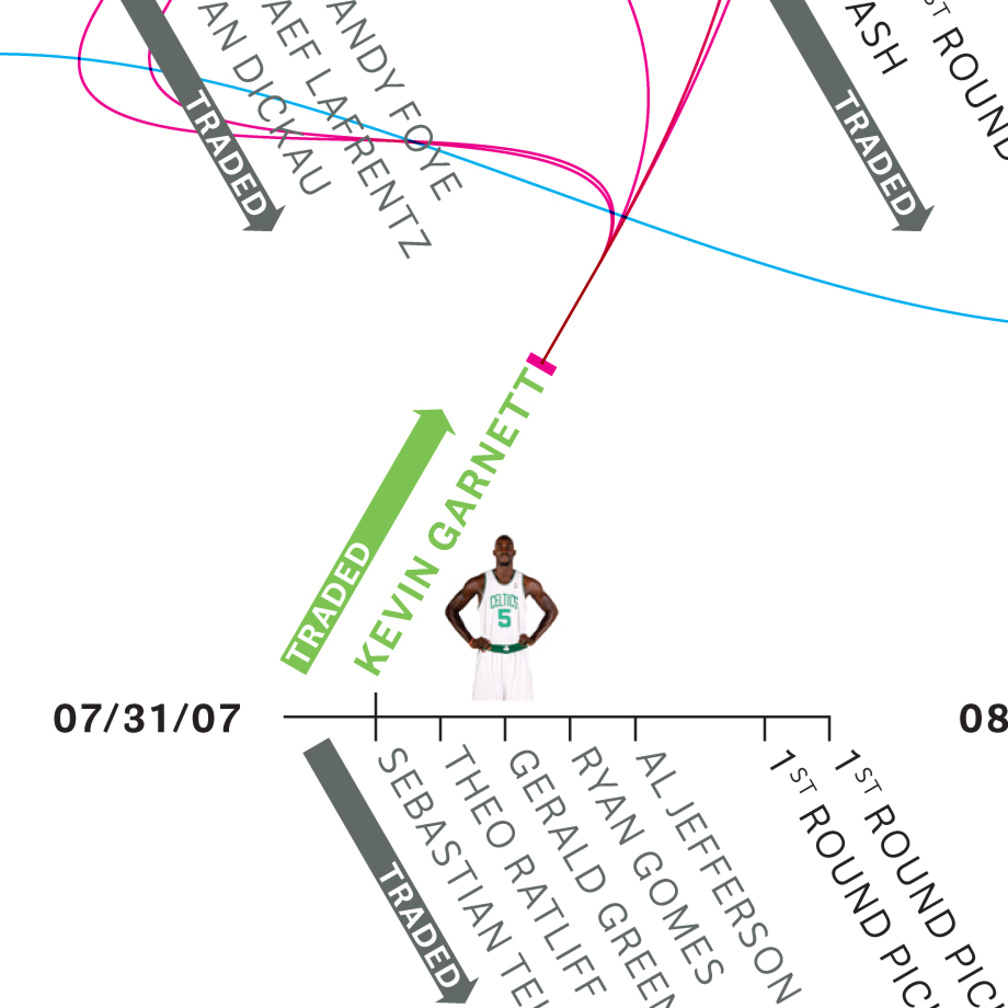
November 2008 – Infographics for Boston Magazine, Boston (US) on the effect of basketball player Kevin Garnett.

Usain Bolt
September 2008 – Illustration using a non-regular print screen pattern for ESPN the Magazine, Bristol (USA).
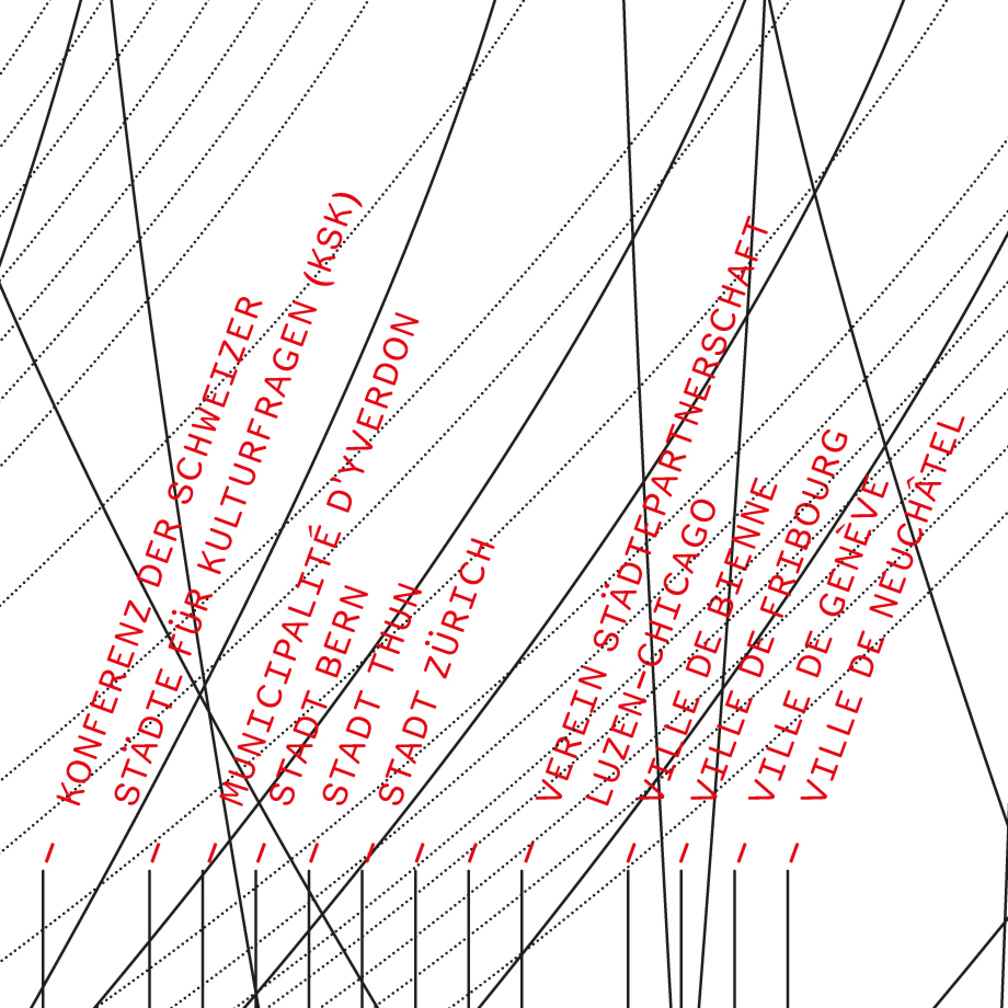
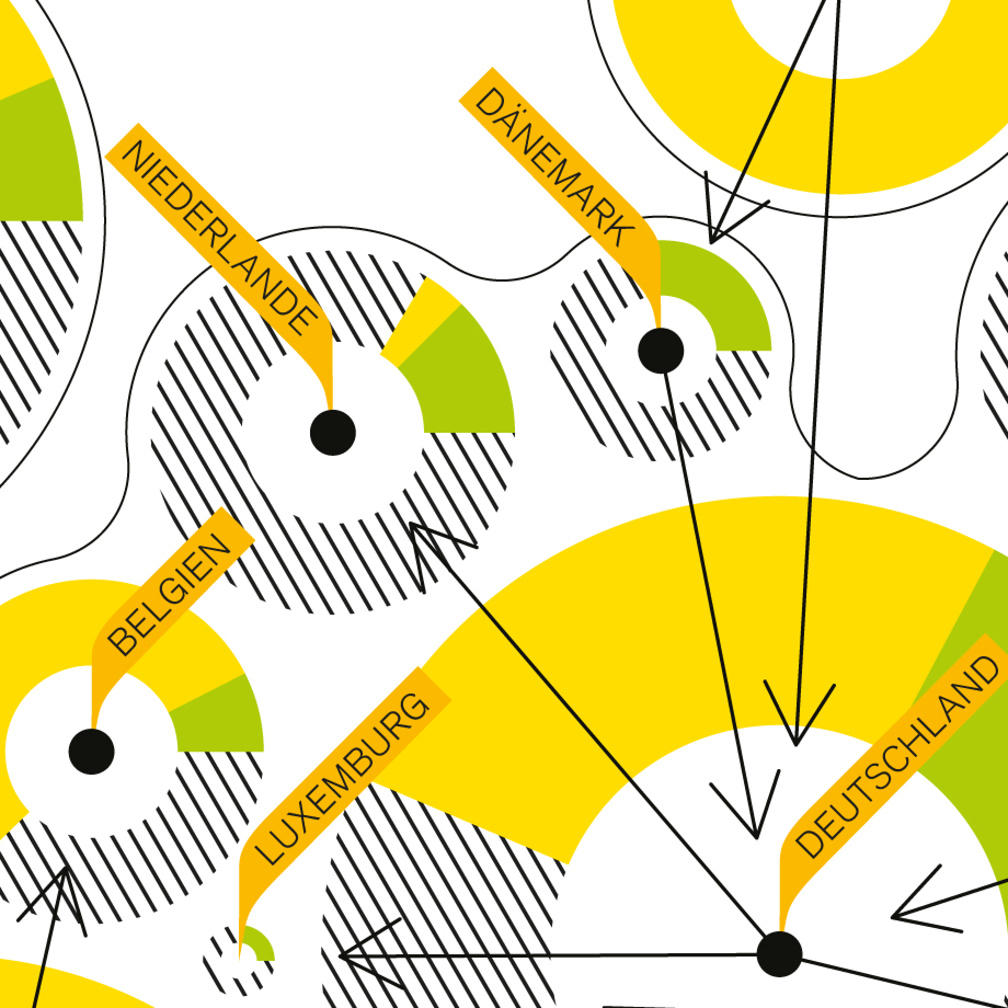
Energy Market Europe
June 2008 – Illustration of european energy flows for Matador magazine, Hamburg (DE).
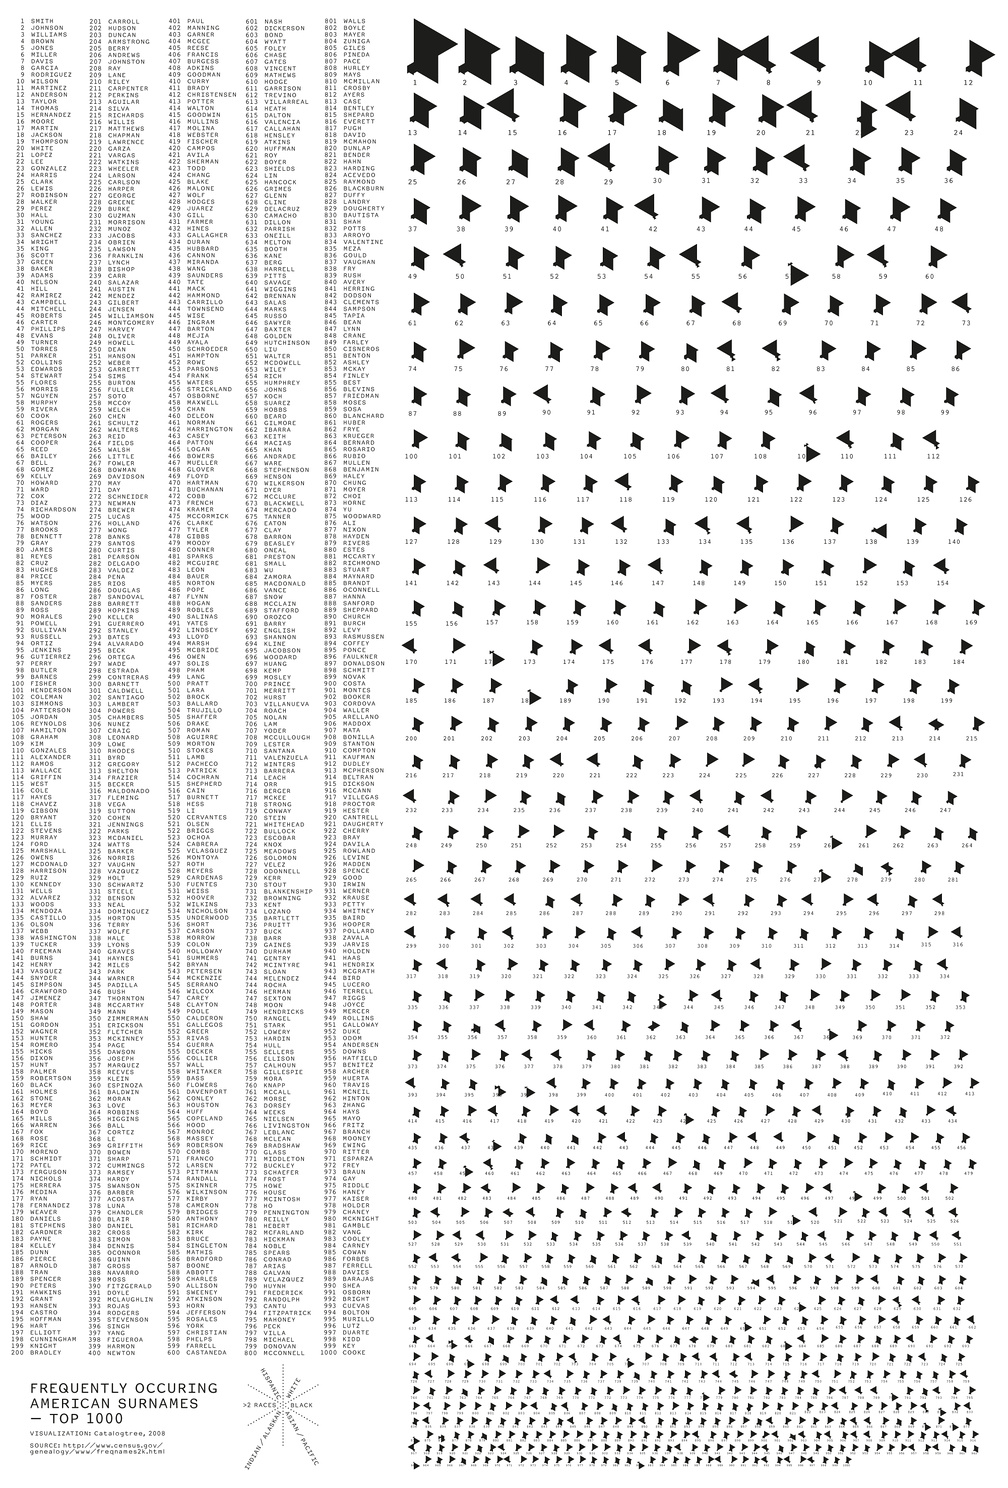
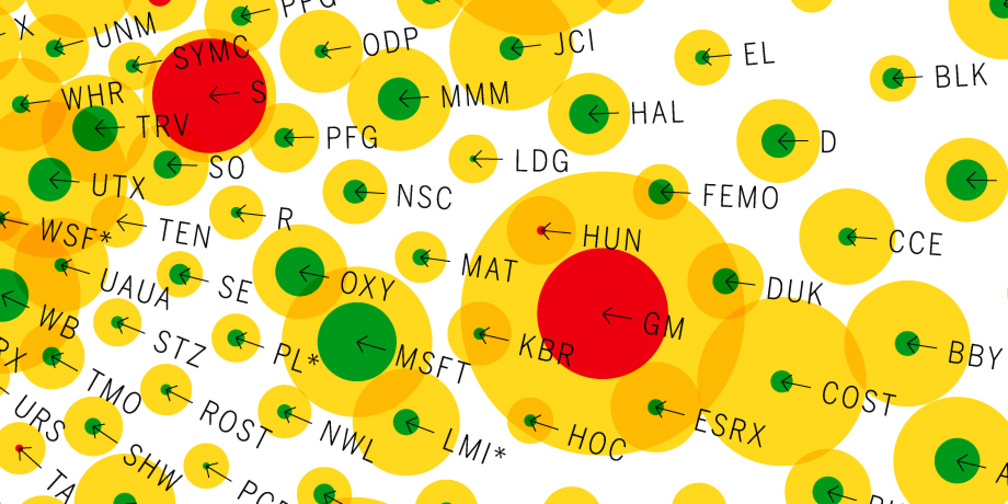
Frequently occuring american surnames
June 2008 – Graphic for the artist Reona Ueda, New York (US) showing the Top 1000 frequently occuring american surnames splitted in the six most common population groups. Published in NEWWORK Magazine issue #2.

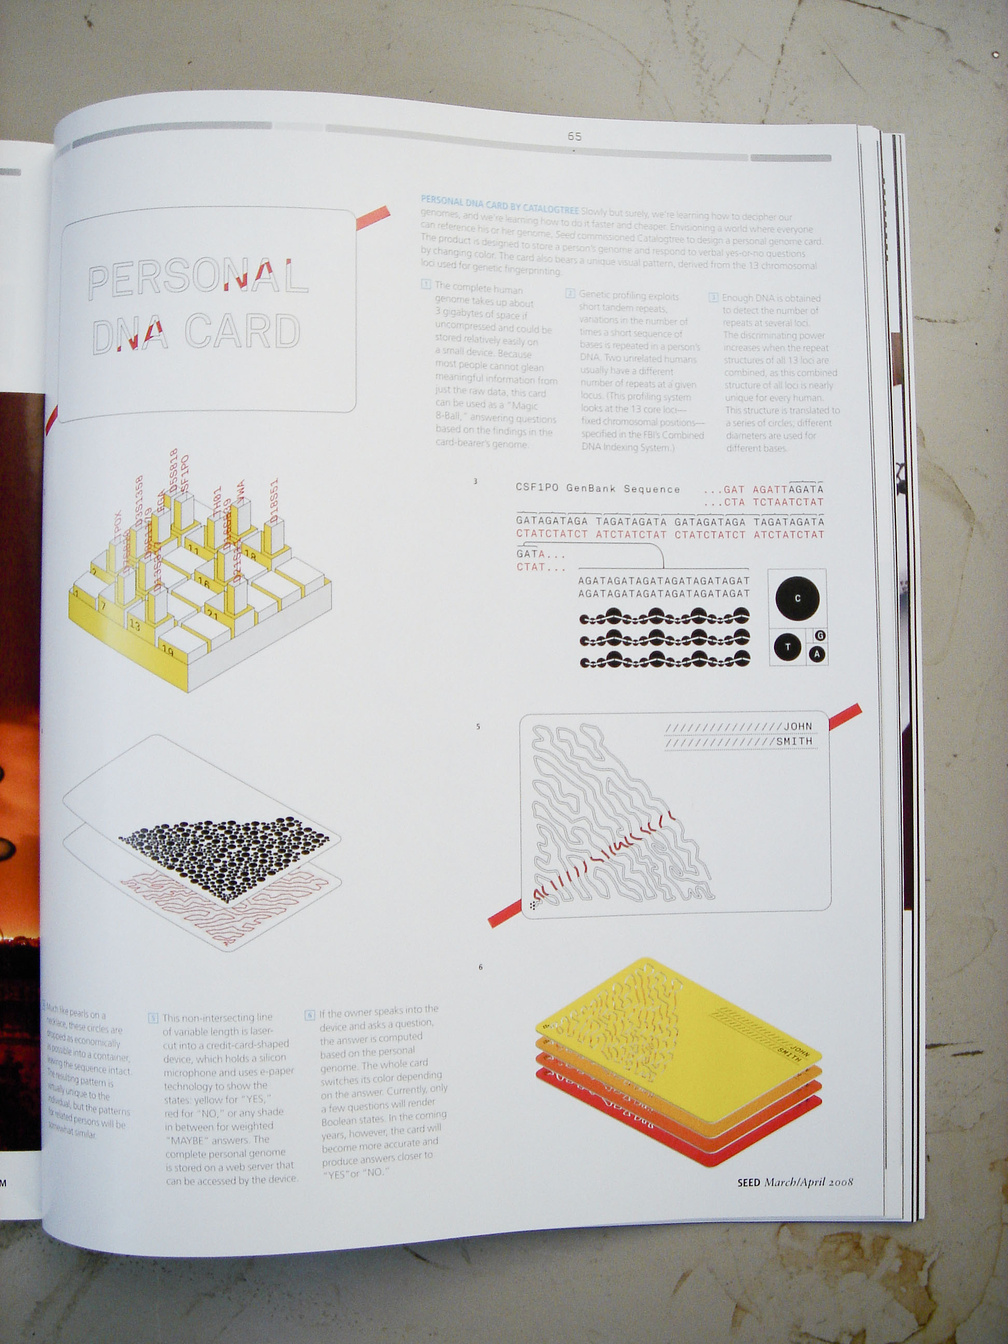
Personal DNA Card
March 2008 – Design for a personal DNA card, commissioned by SEED magazine, New York (US). A fingerprint is generated from the 13 core loci as used by the FBI for human identification. In collaboration with Lutz Issler (line script) .
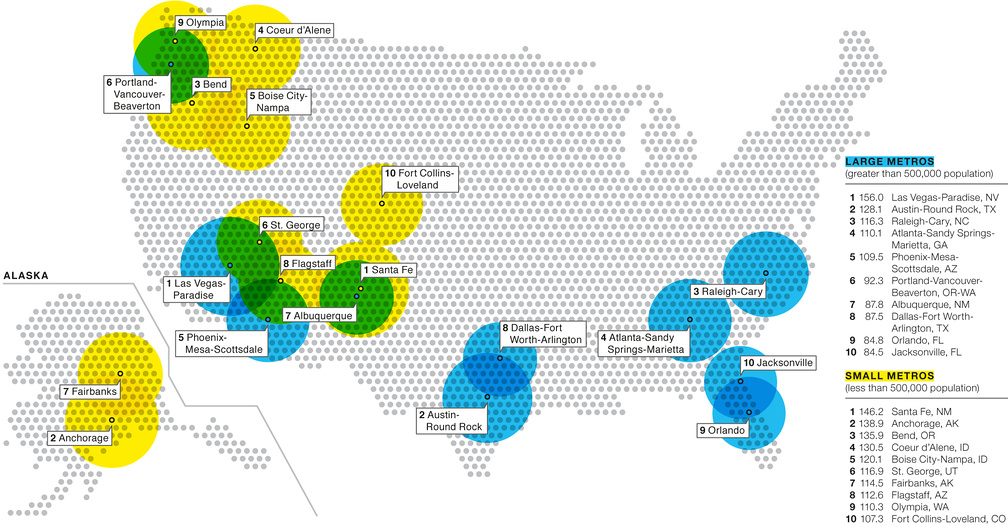
Where the retirees will be
October 2007 – Chart for Key, the New York Times Real Estate Magazine showing cities in the U.S. with a high percentage of retirees.
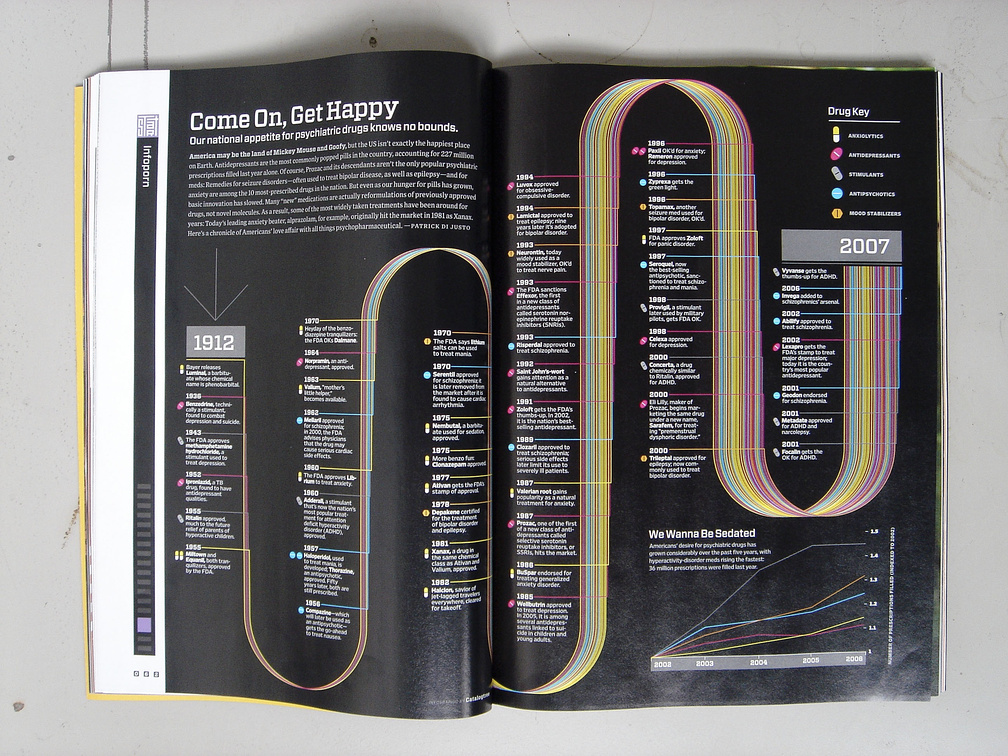
Come on, get happy
September 2007 – Infographic for the infoporn column of WIRED magazine showing the rise of psychiatric drugs over the last 95 years.
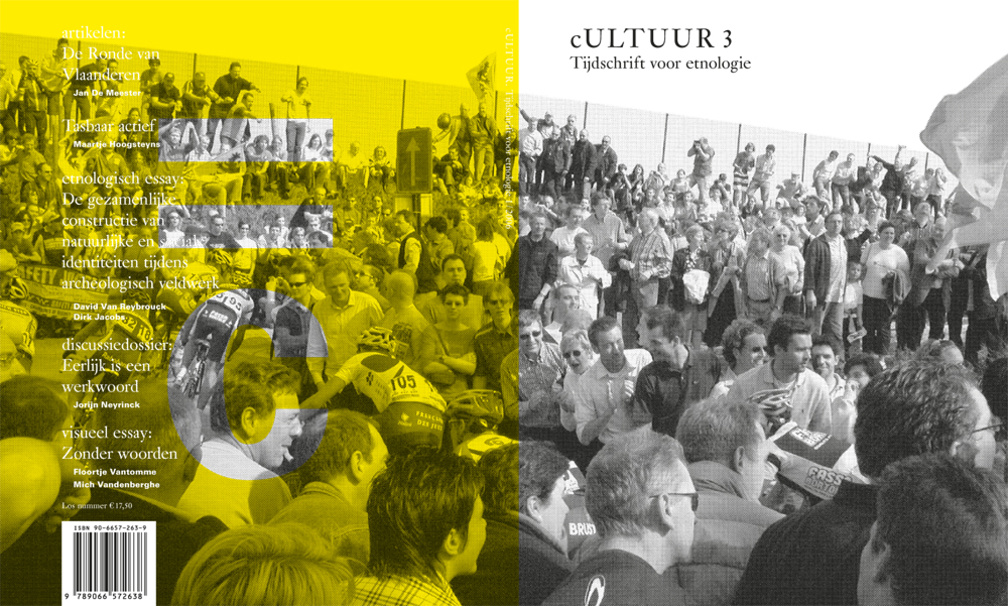
cULTUUR 3
July 2007 – Art direction for cULTUUR 3 (not published). The journal of ethnology aims at offering a forum for the study of everyday life in the Dutchspeaking region, both past and present.
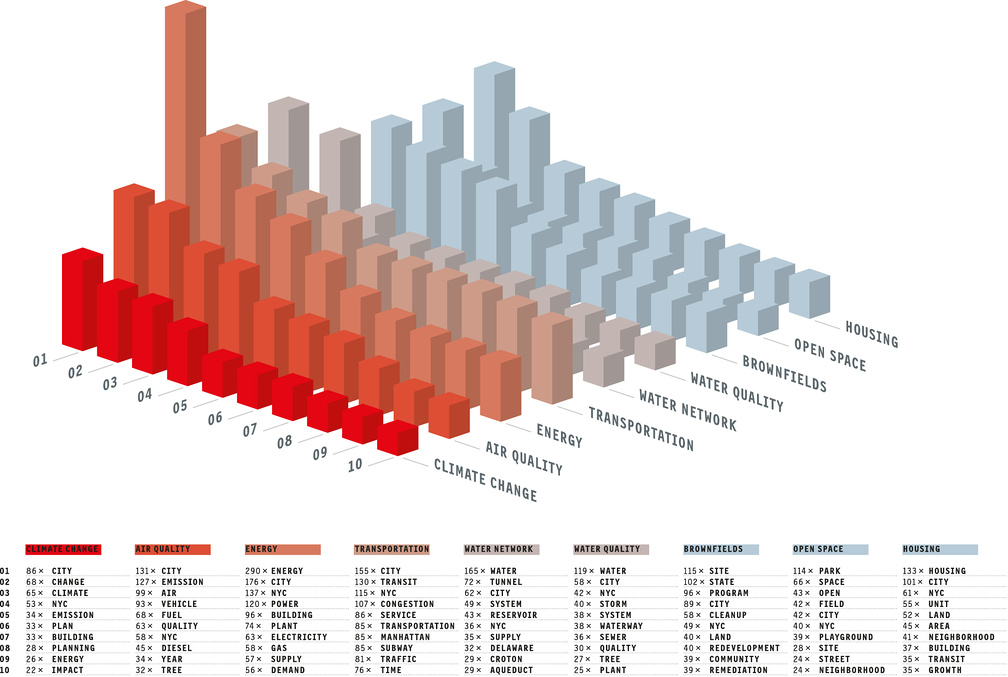
PLANYC
July 2007 – Illustration made for Metropolis magazine, New York (US). Based on an analysis of the number of occurences of each noun, one data set for every chapter of the whole PLANYC was visualized. In collaboration with Lutz Issler (text statistic) .
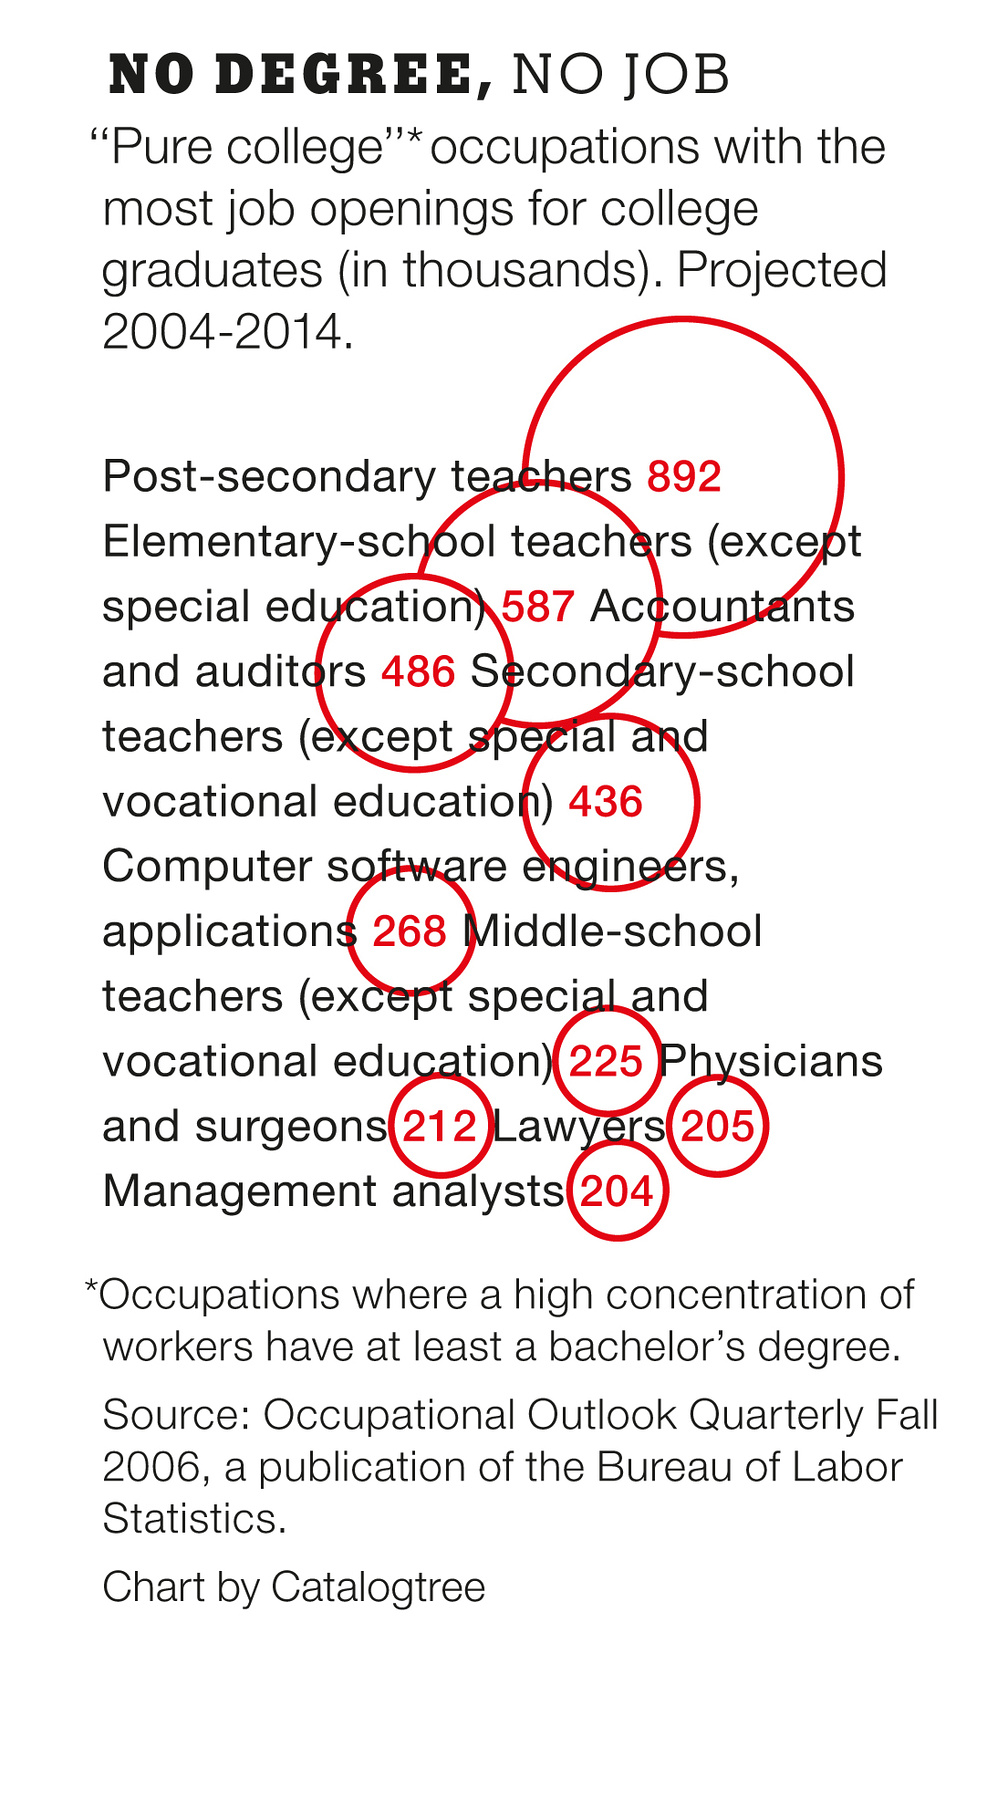
June 2007 – Series of Infographics for 'The Way We Live Now' column of New York Times Magazine, New York (US) from January to June 2007.
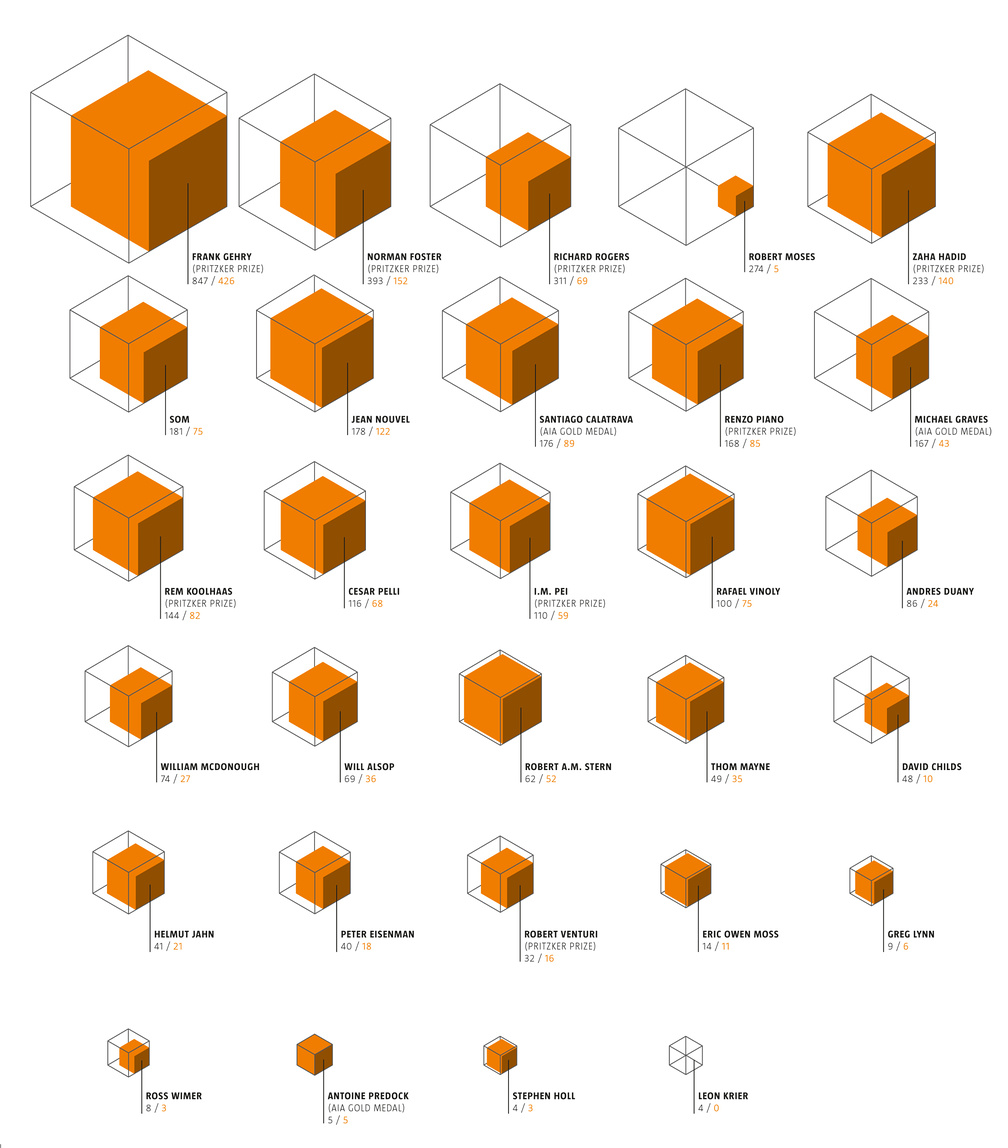
May 2007 – Charts for Architect Magazine, Washington D.C. (US) on how architectural power is measured and honored.

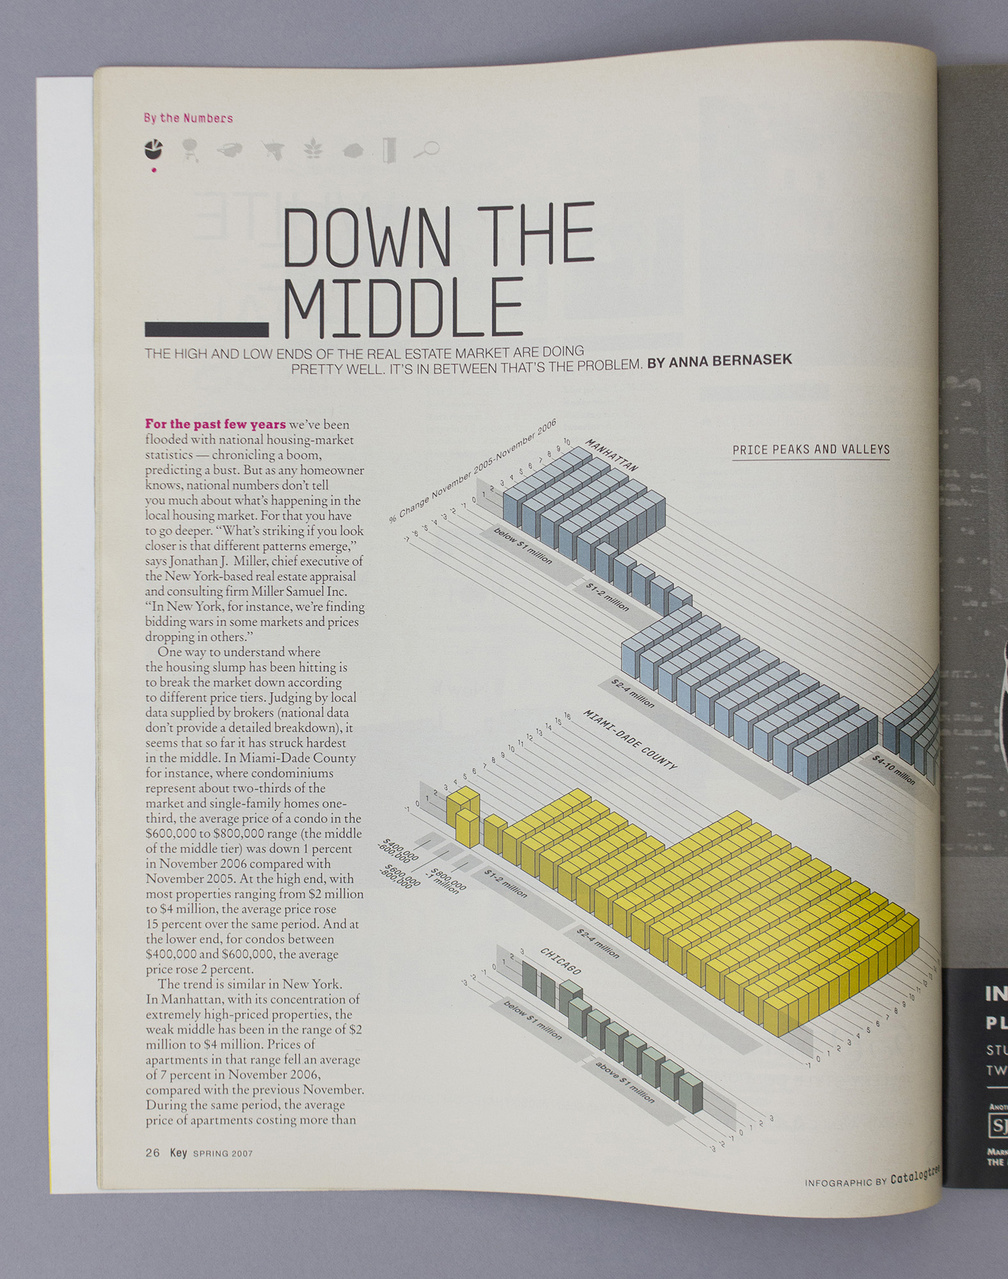
Down the Middle
March 2007 – Chart for Key, the New York Times Real Estate Magazine about local housing markets in the U.S.
December 2006 – Infographics for 'The 6th Annual in Ideas' in The New York Times Magazine, New York (US).
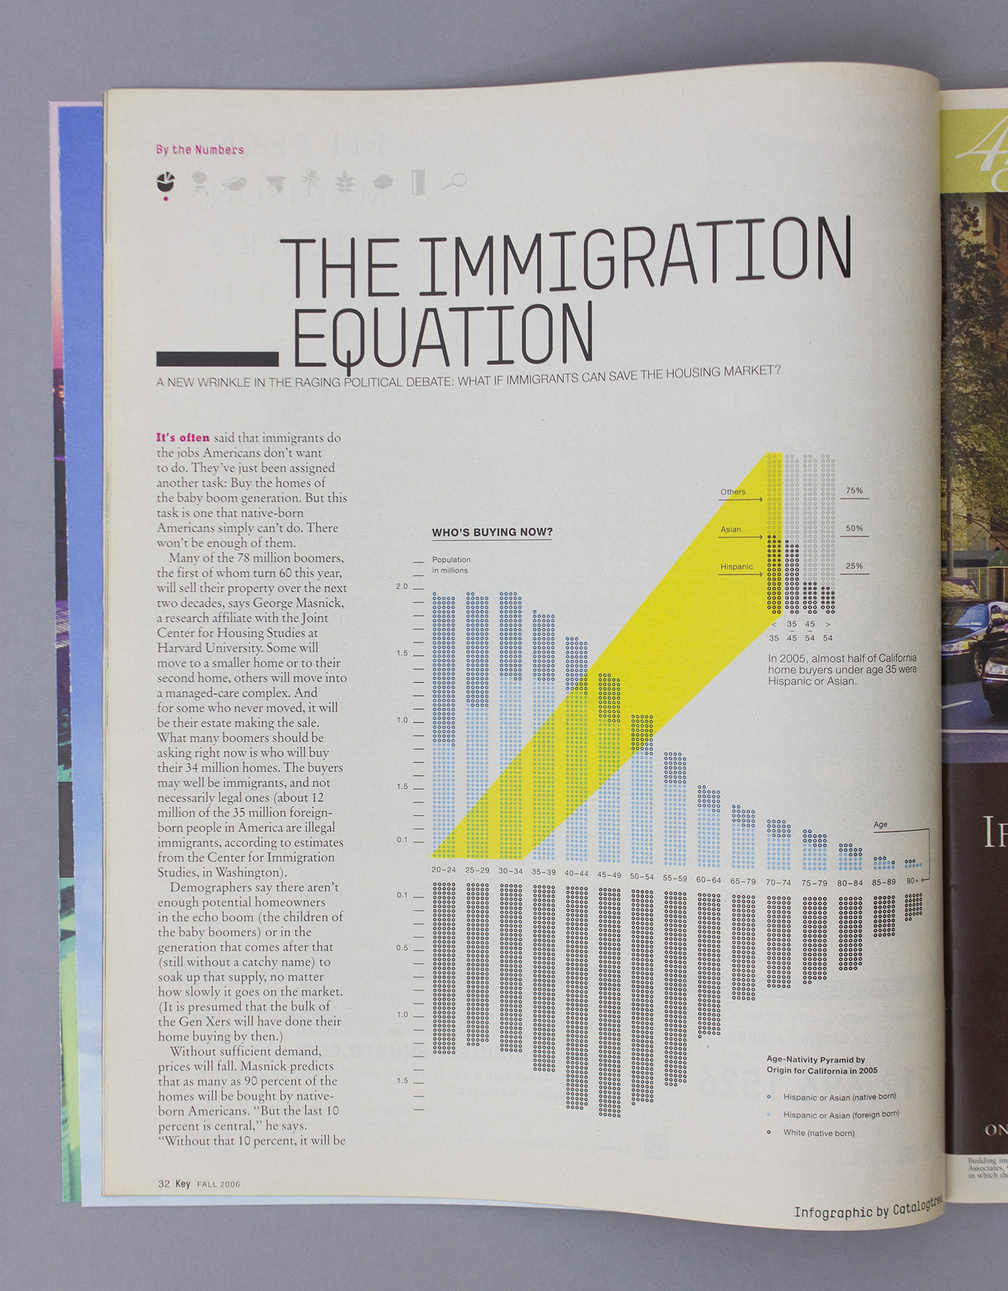
The Immigration Equation
August 2006 – Chart for the first issue of Key, the New York Times Real Estate Magazine about the influence of immigrants on the american housing market.

December 2005 – Art direction for cULTUUR. The journal of ethnology aims at offering a forum for the study of everyday life in the Dutchspeaking region, both past and present.
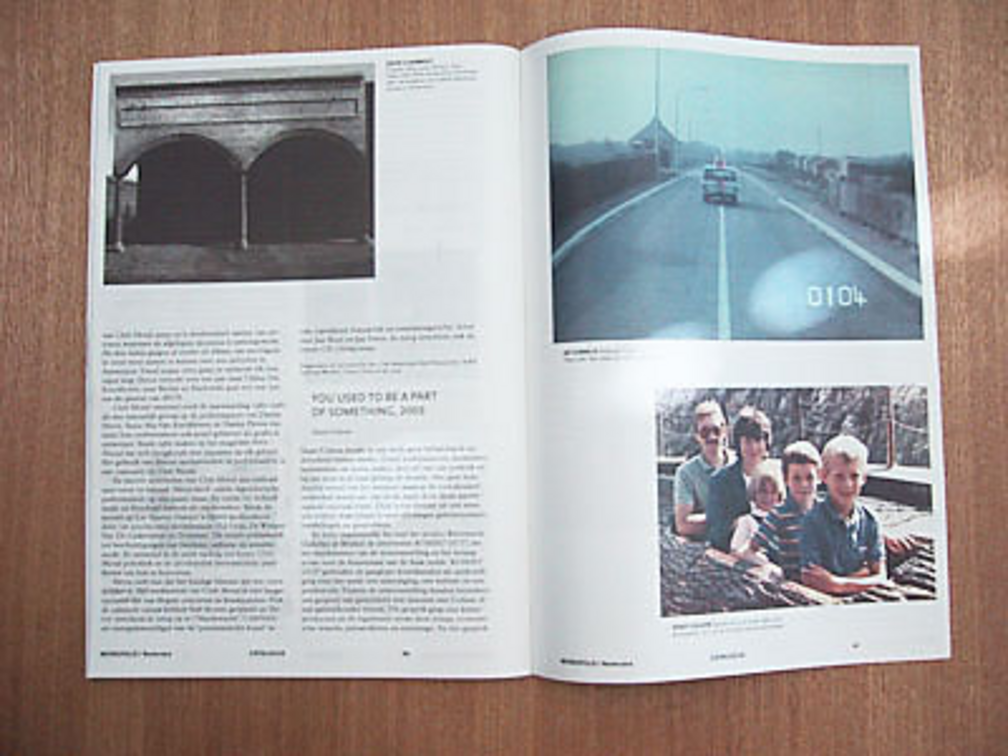

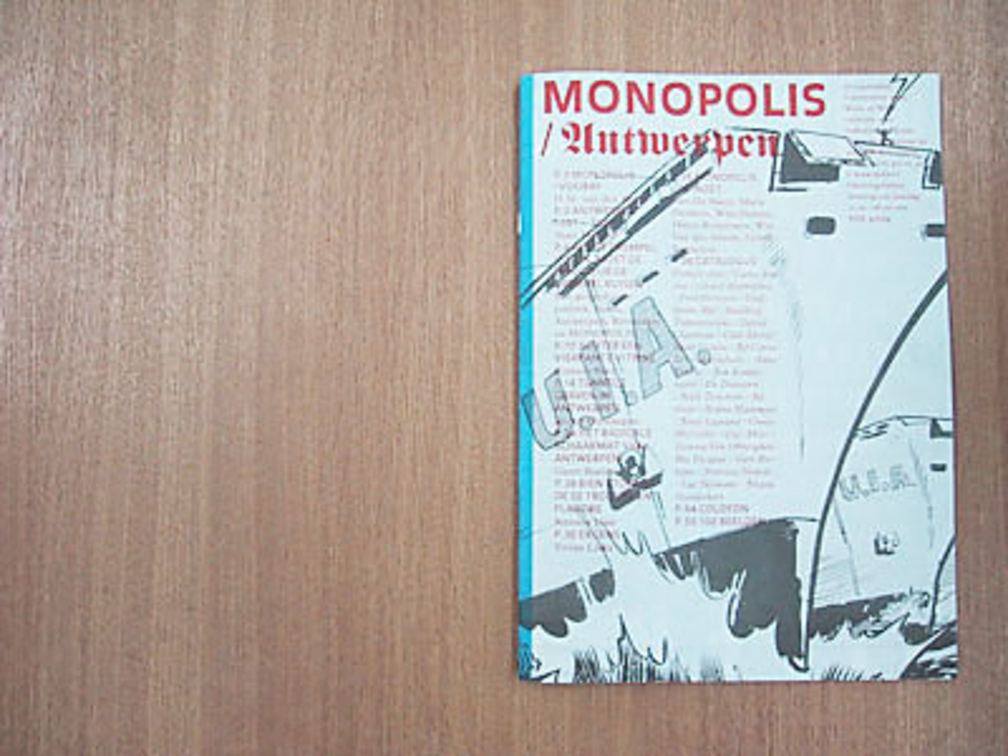
Monopolis / Antwerpen catalogue
September 2005 – Catalogue for exhibition 'Monopolis / Antwerpen' at Witte de With, Rotterdam (NL). In collaboration with Nienke Terpsma .

July 2005 – Art direction for cULTUUR. The journal of ethnology aims at offering a forum for the study of everyday life in the Dutchspeaking region, both past and present.
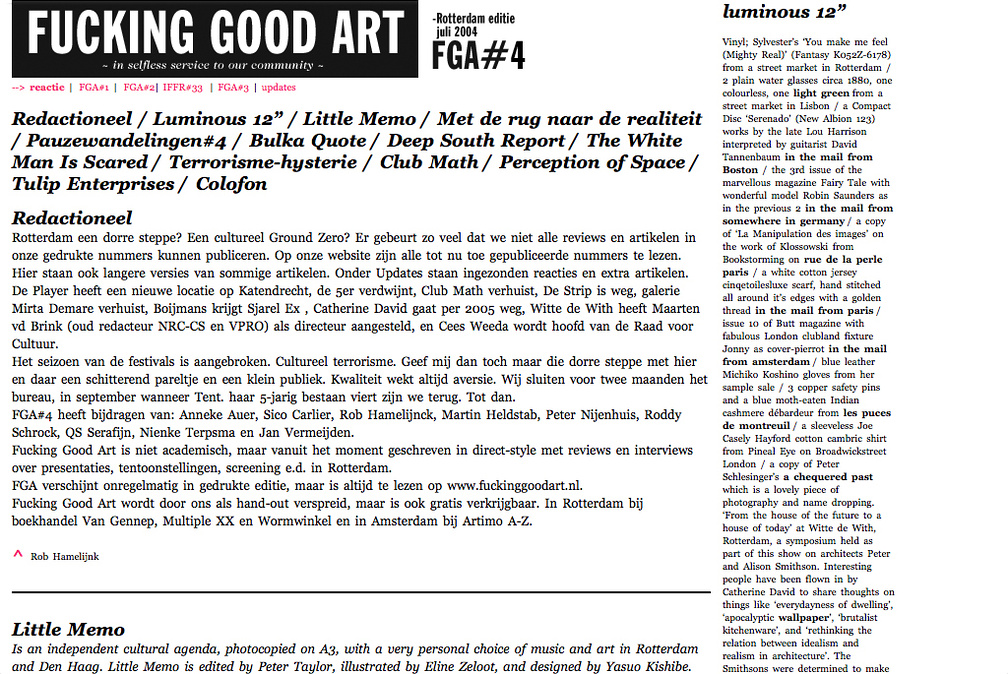
Fucking Good Art
December 2003 – Webdesign for an independent art magazine initiated by Rob Hamelijnck and Nienke Terpsma. In collaboration with Niels van der Sluijs (html) .
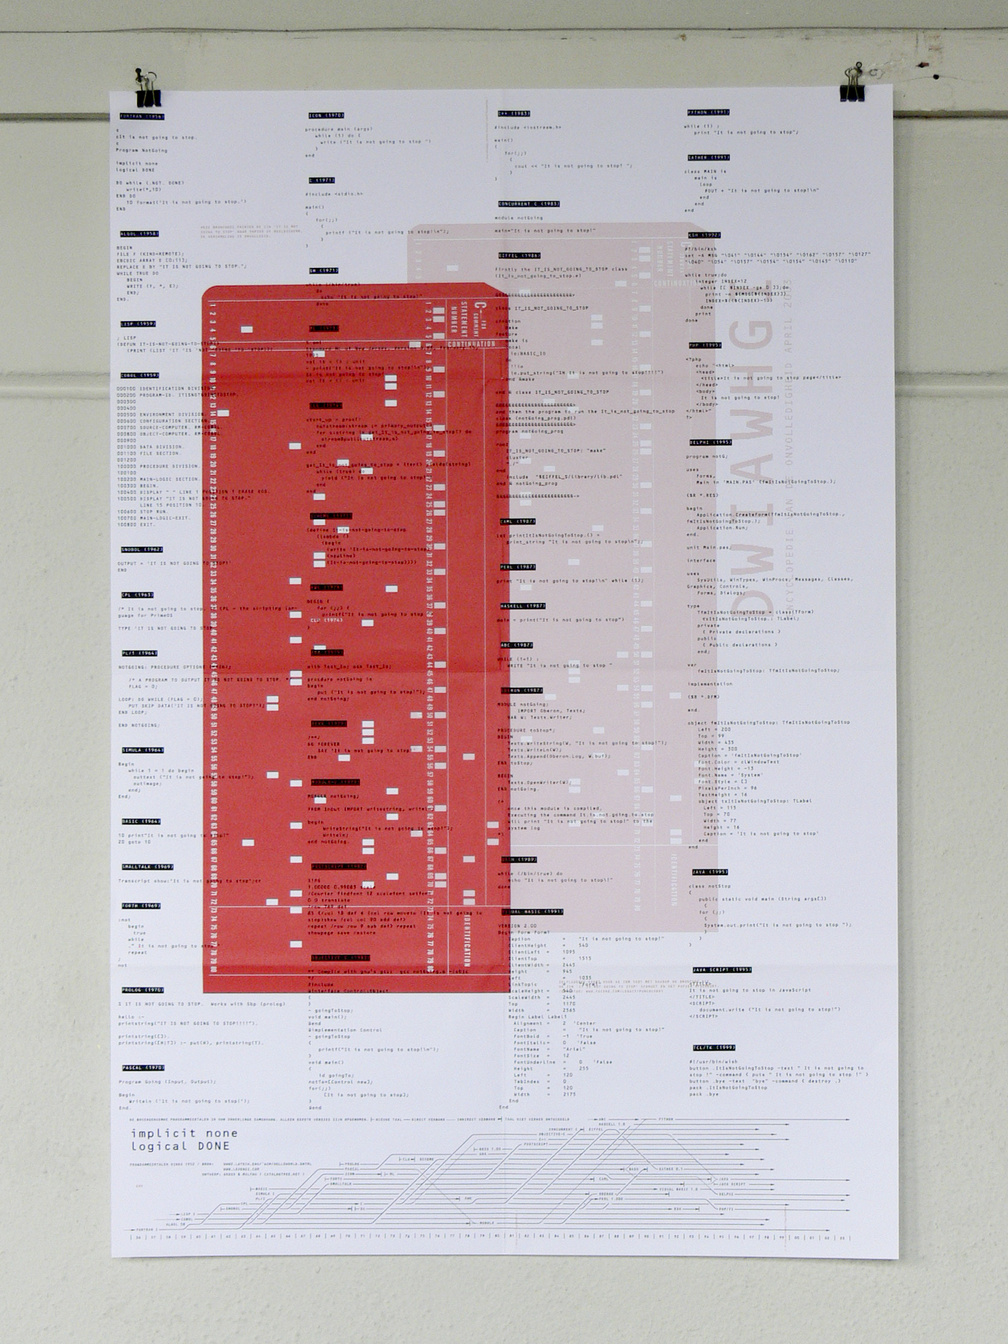
it is not going to stop
May 2003 – How to print/display the sentence 'it is not going to stop' in 43 different programming languages of the last 50 years. The poster was embeded in the magazine DWIAWHGI #2 (magazine design by Jaap Kroneman, Connie Nijman en Nienke Terpsma).