information design
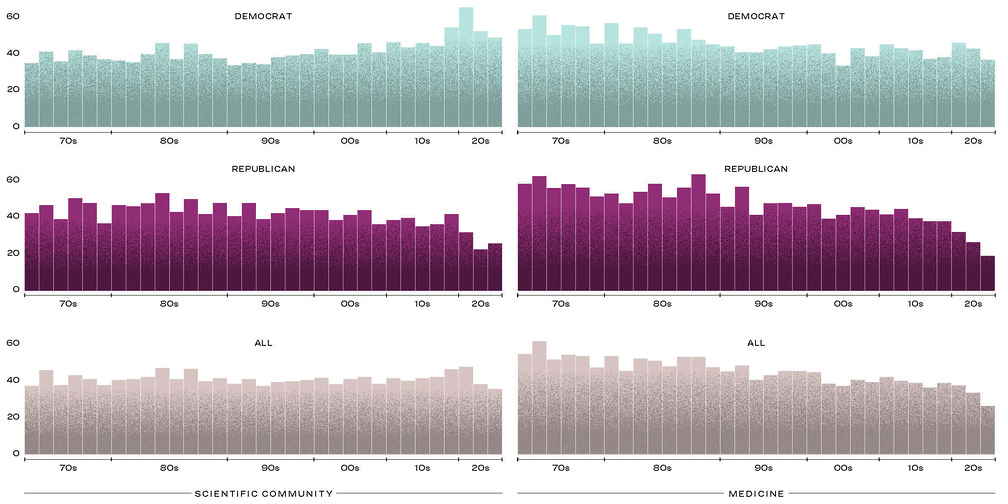
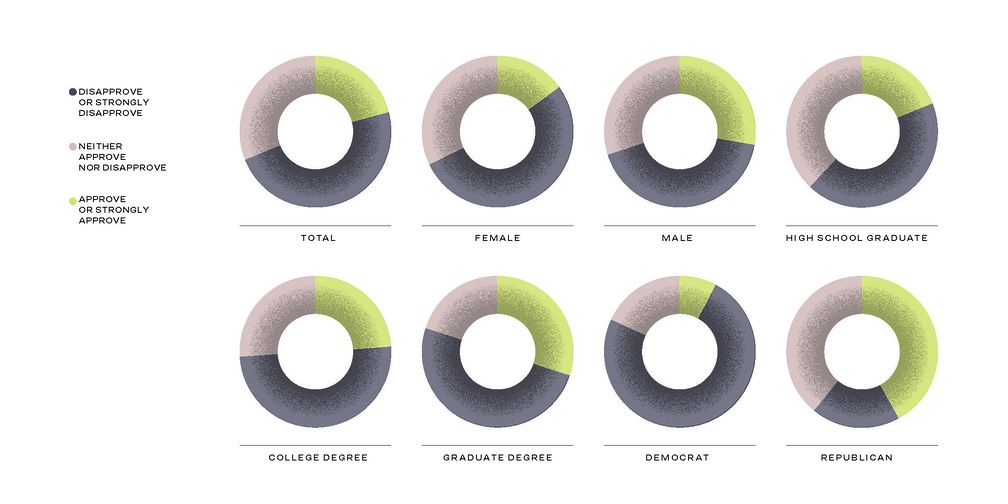
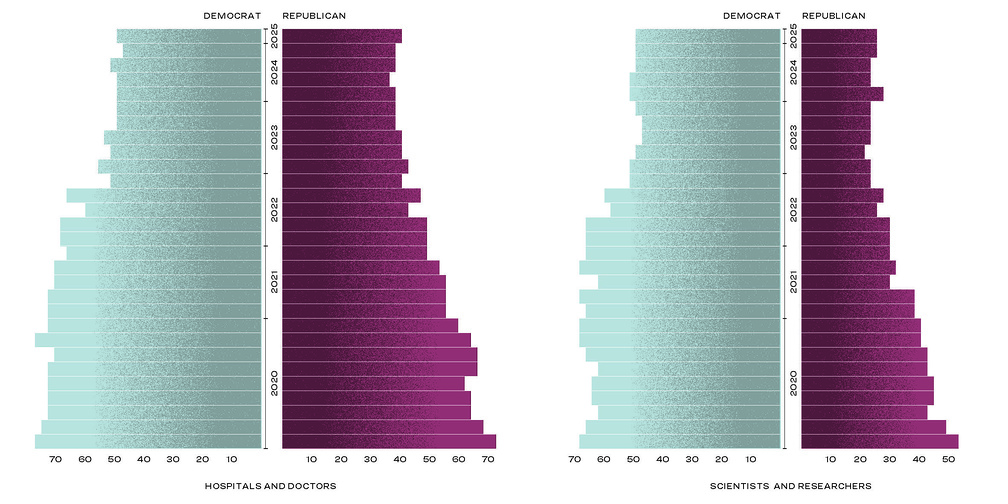
Trust in Numbers
November 2025 – Infographics for the print issue of Harvard Medicine magazine on the crisis of trust in science and medicine.
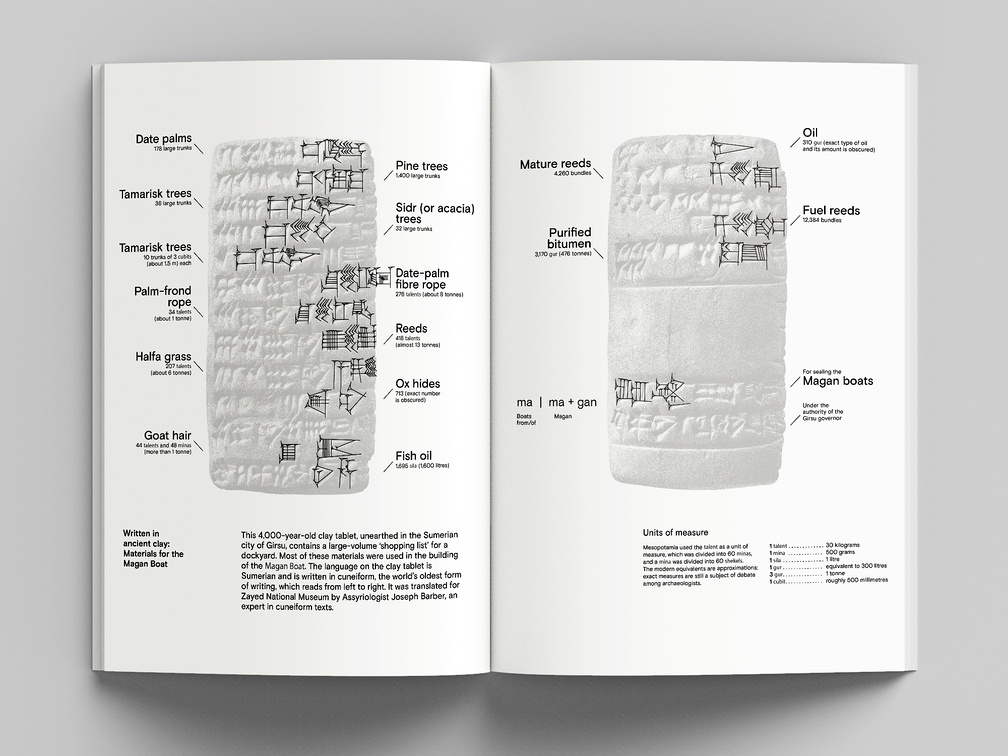
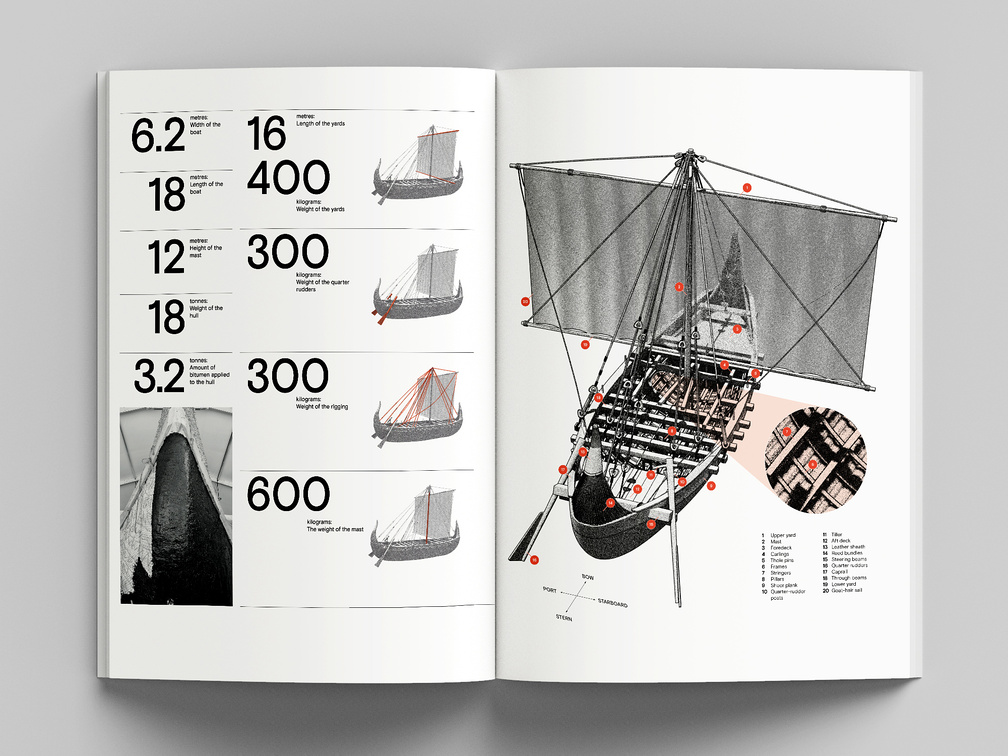
July 2025 – Infographics and cartography for Magan rediscovered, a publication from The Zayed National Museum, the national museum of the United Arab Emirates, chronicling the 'Magan Boat Project', a joint initiative with Zayed University and NYU Abu Dhabi launched in 2021. The project resulted in the reconstruction of an 18-meter Bronze Age ship that sailed from the coast of Abu Dhabi.

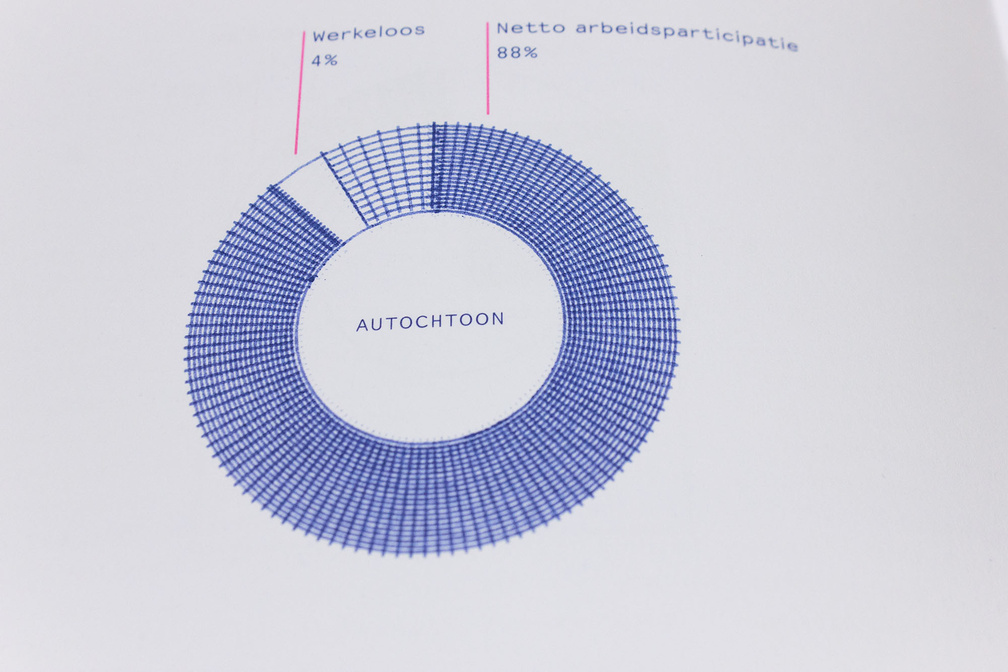
July 2024 – Design for final report of the Dutch State Commission for Demographic Developments 2050 (Caribbean Netherlands)
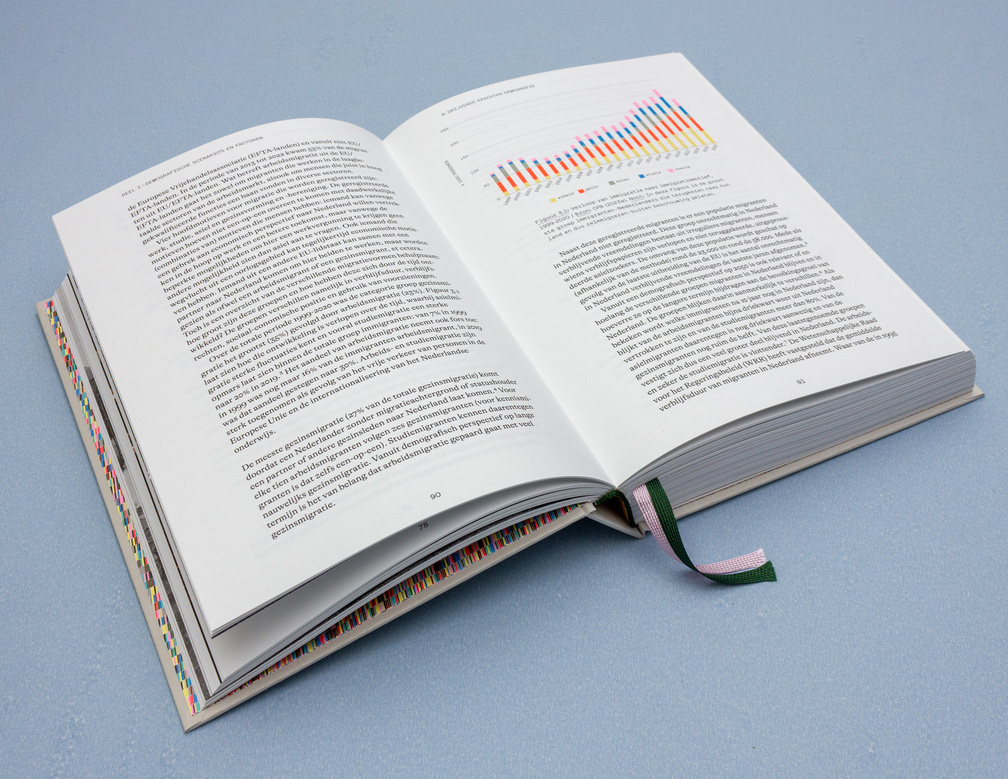
January 2024 – Design for final report of the Dutch State Commission for Demographic Developments 2050
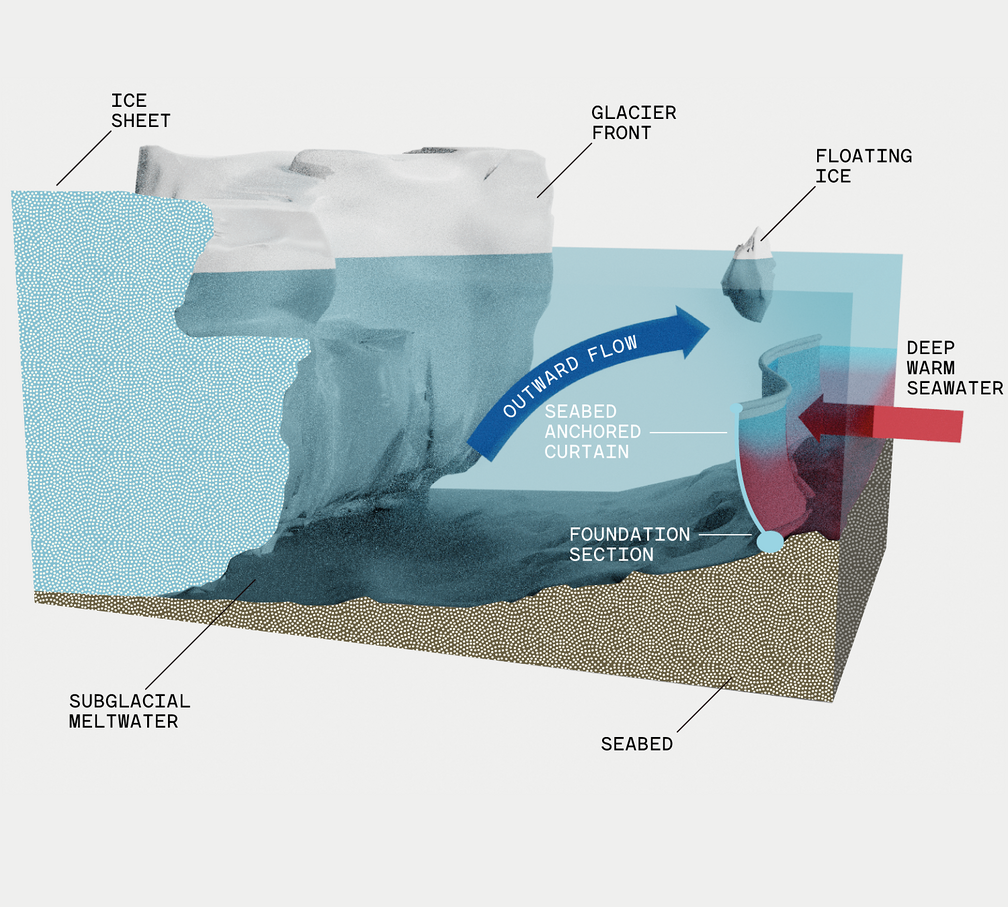
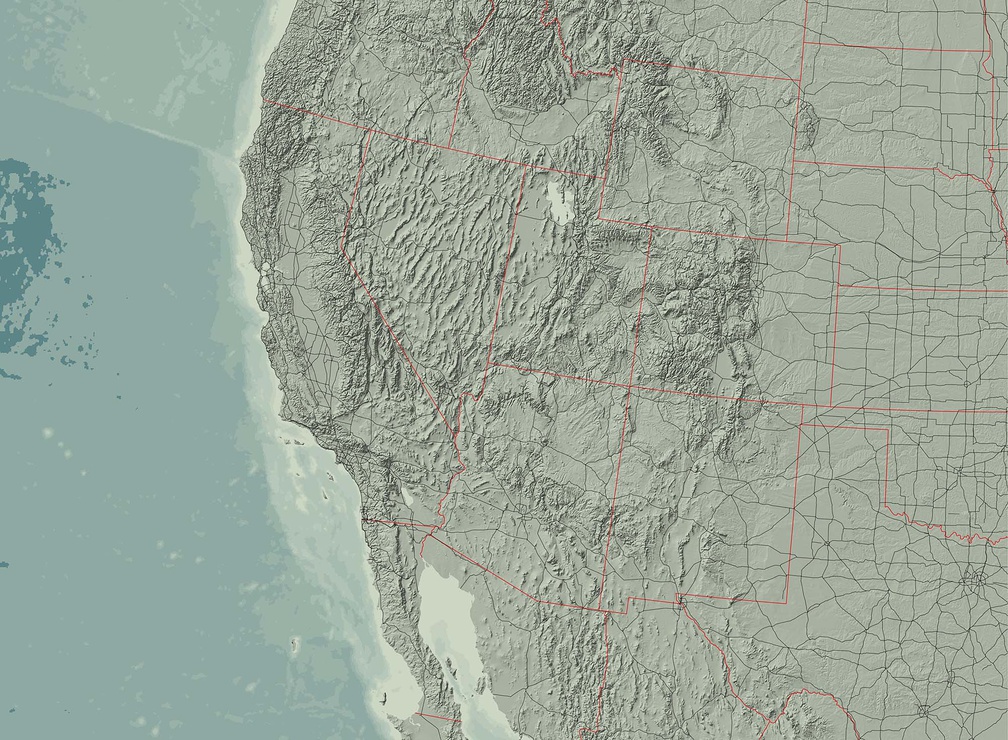
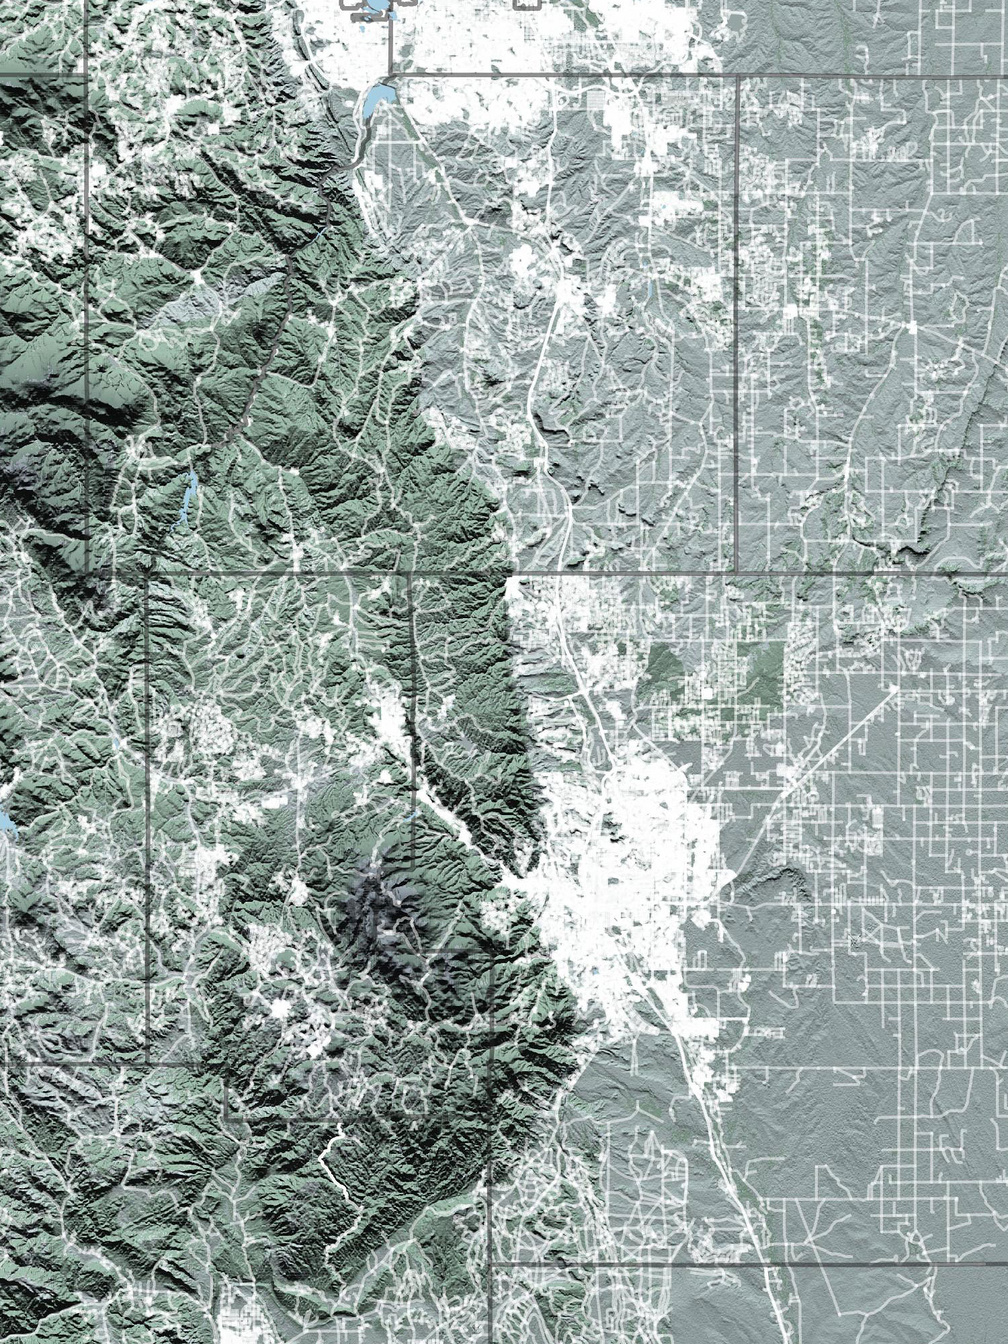
Can $500 Million Save This Glacier?
January 2024 – Information design for New York Times -- A bold engineering project might show a way to slow sea-level rise — and bring new imagination to the fight against climate change.
Encounters
March 2022 – Maps for "In Focus", the Photographic Journal of british photographer David Yarrow.
Encounters
June 2021 – Maps for "In Focus", the Photographic Journal of british photographer David Yarrow.
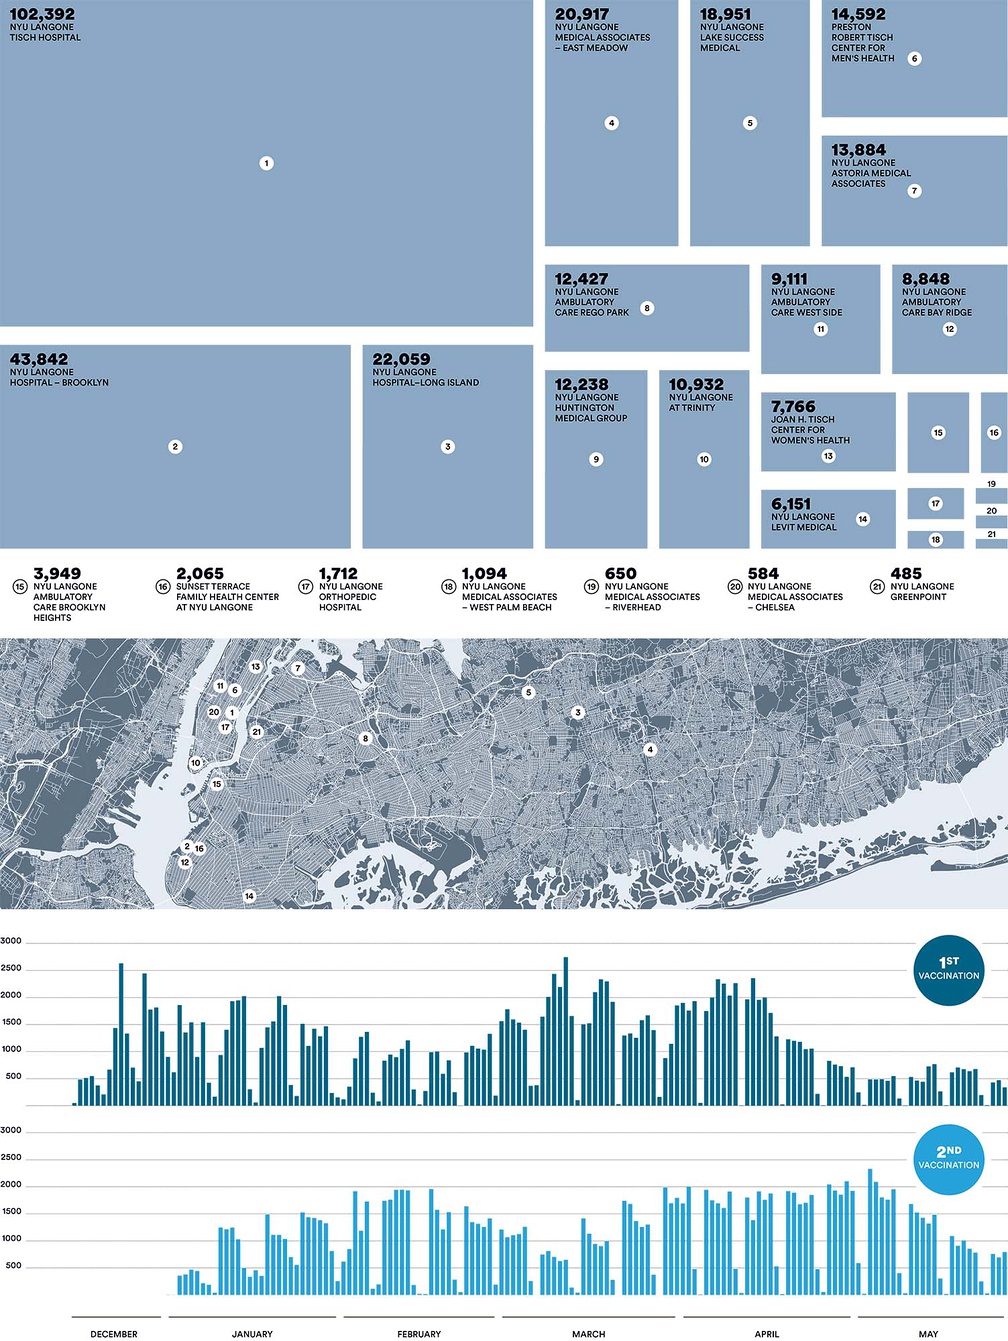
NYU Langone
June 2021 – Infographic for the NYU Langone Health Magazine, New York (USA).
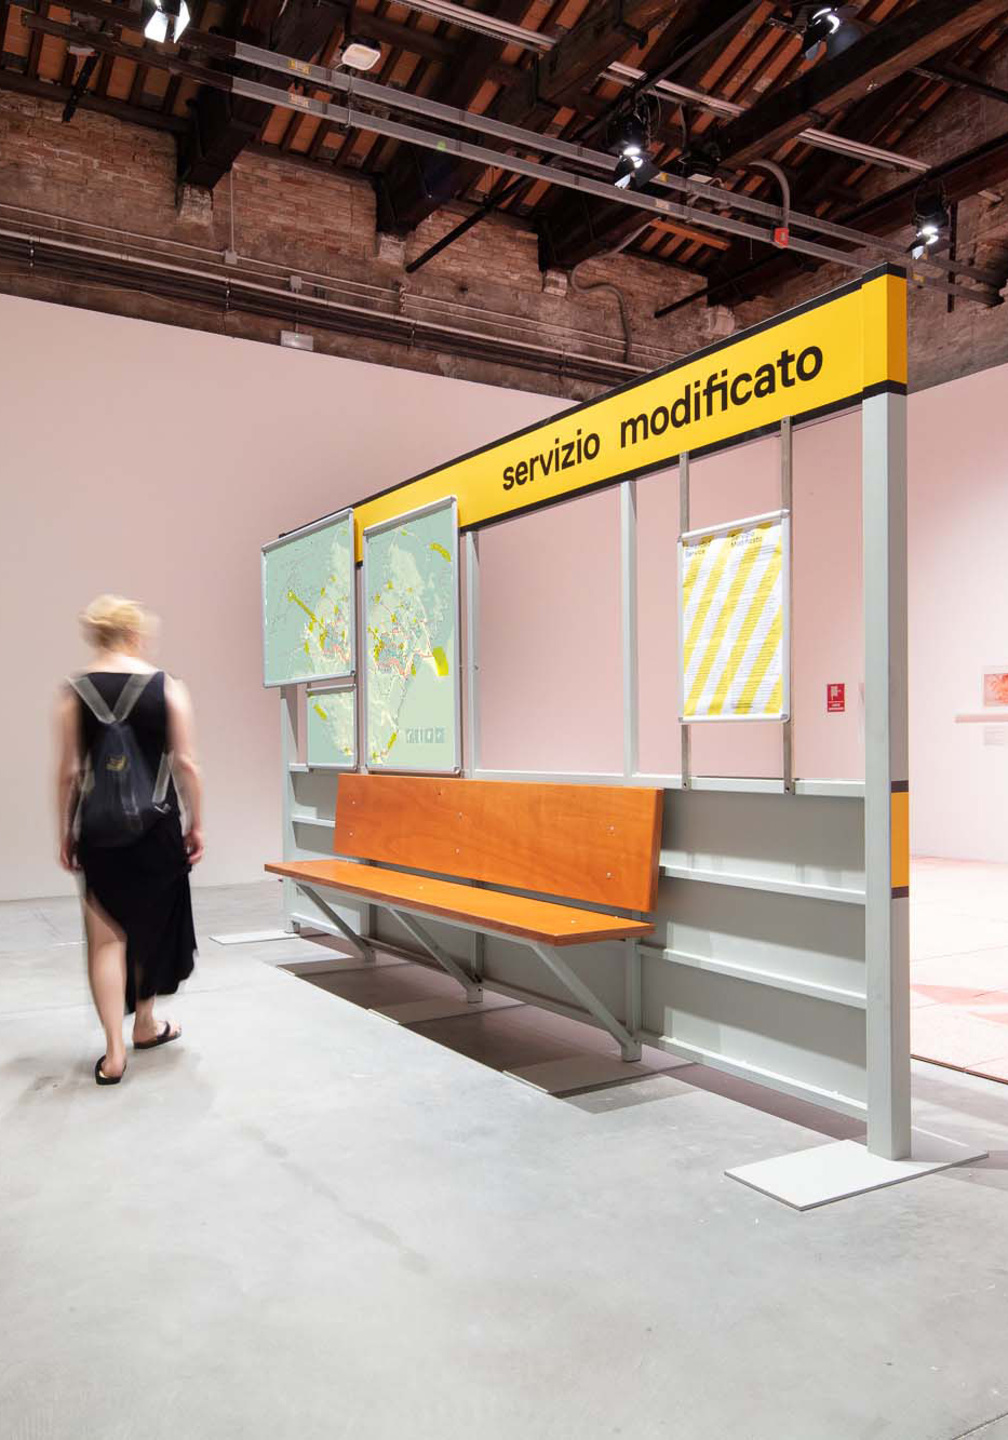
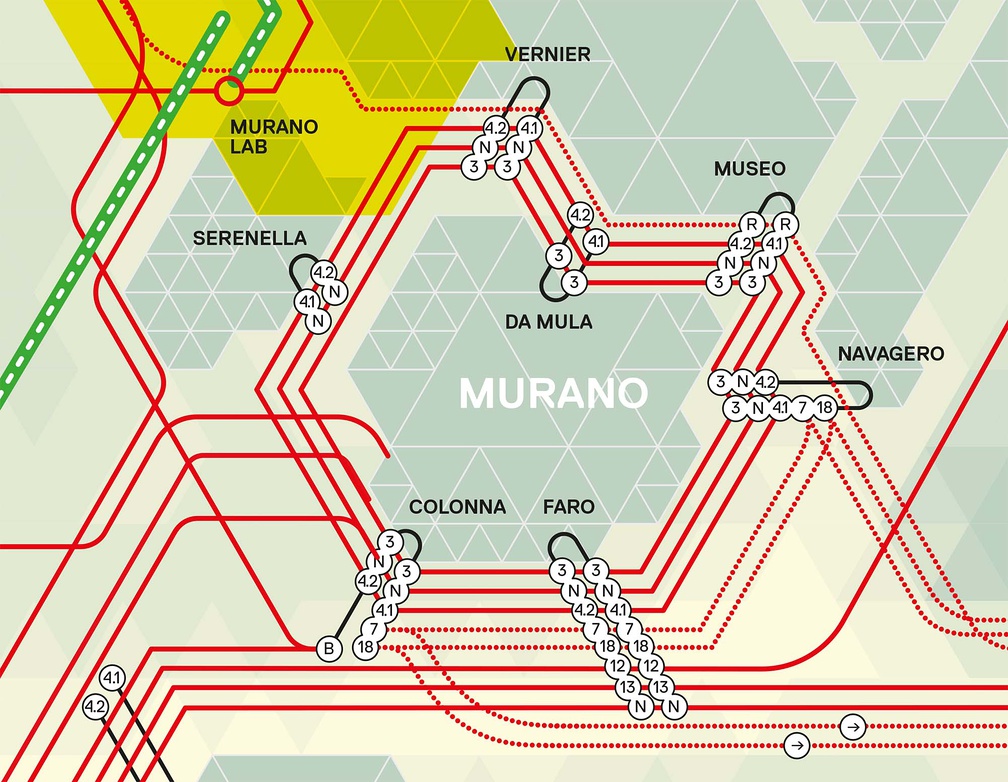
June 2021 – Cartography for "Servizio Modificato" (Modified Service), a collaboration with Kathryn Moll and Nicholas de Monchaux of modem (USA), Sandro Bisá of Bisá Associati (IT) and William Sherman of the University of Virginia Venice Program (USA/IT).
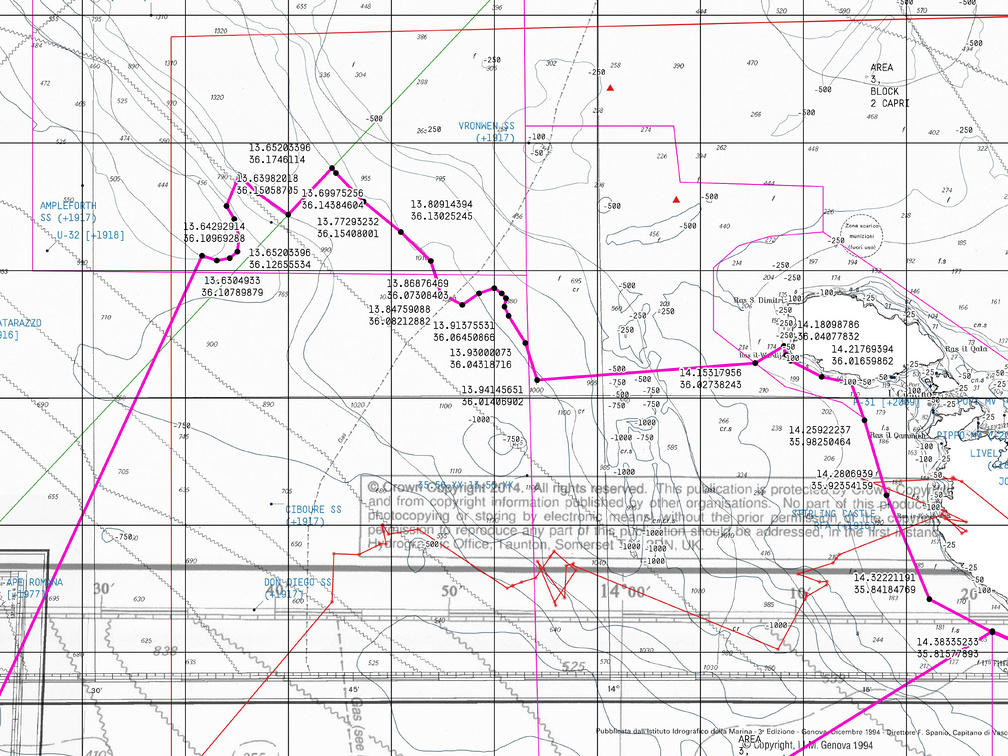
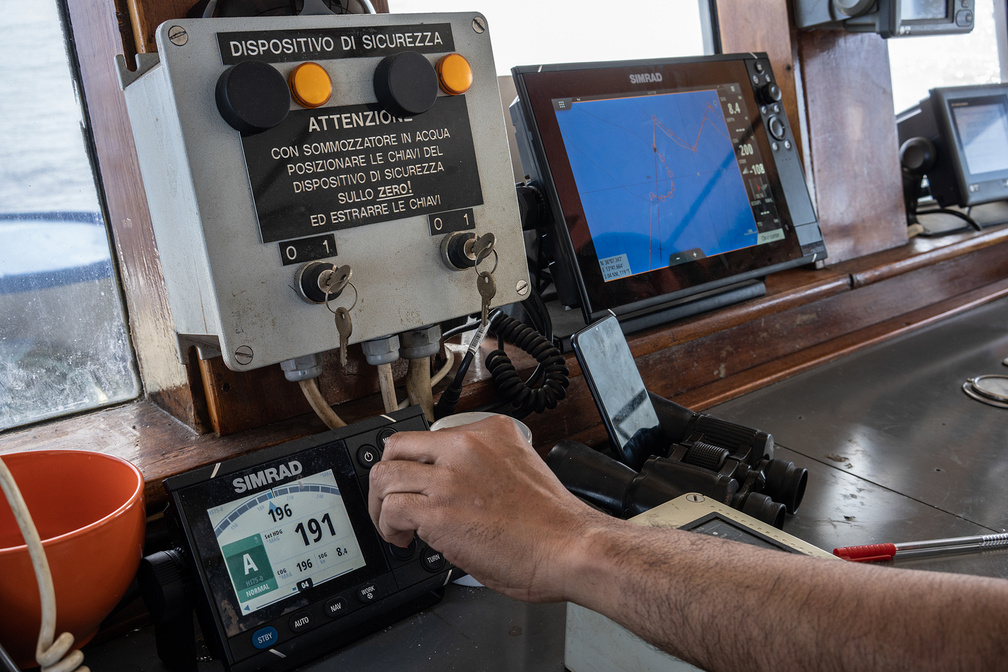
May 2021 – Cartography for a performance by artist Rossella Biscotti that has taken place in the Mediterranean Sea between 20 and 23 May 2021. The Journey is a performance of a ship navigating a GPS content-related route inspired by time, history and current geopolitical data researched together with different experts and communities in an area of the Mediterranean Sea between Italy, Malta, Tunisia, Libya. The narrative is centered on the decision and consequences of dropping a 17-ton marble block awarded to the artist by the iconic Michelangelo quarry in Carrara, Italy, yet left untouched.

Harmful Subsidies
January 2021 – Infographics for The Little Book of Investing in Nature and on the website of Global Canopy.
Montana
November 2020 – Montana map for "In Focus", the Photographic Journal of british photographer David Yarrow.
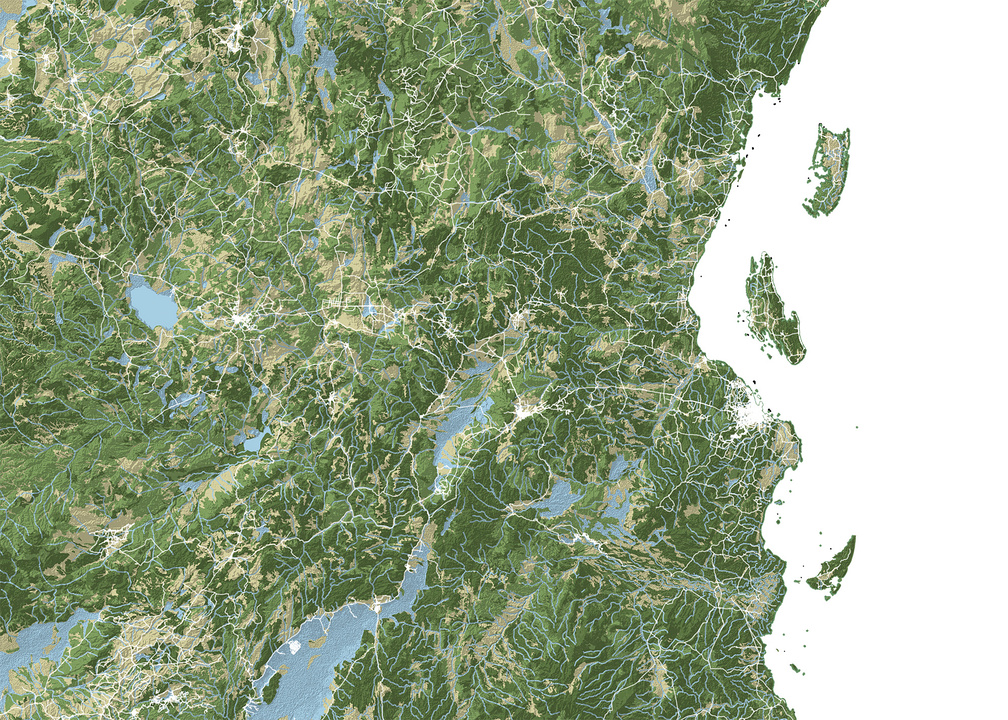
West Africa
November 2020 – West Africa map for "In Focus", the Photographic Journal of british photographer David Yarrow.
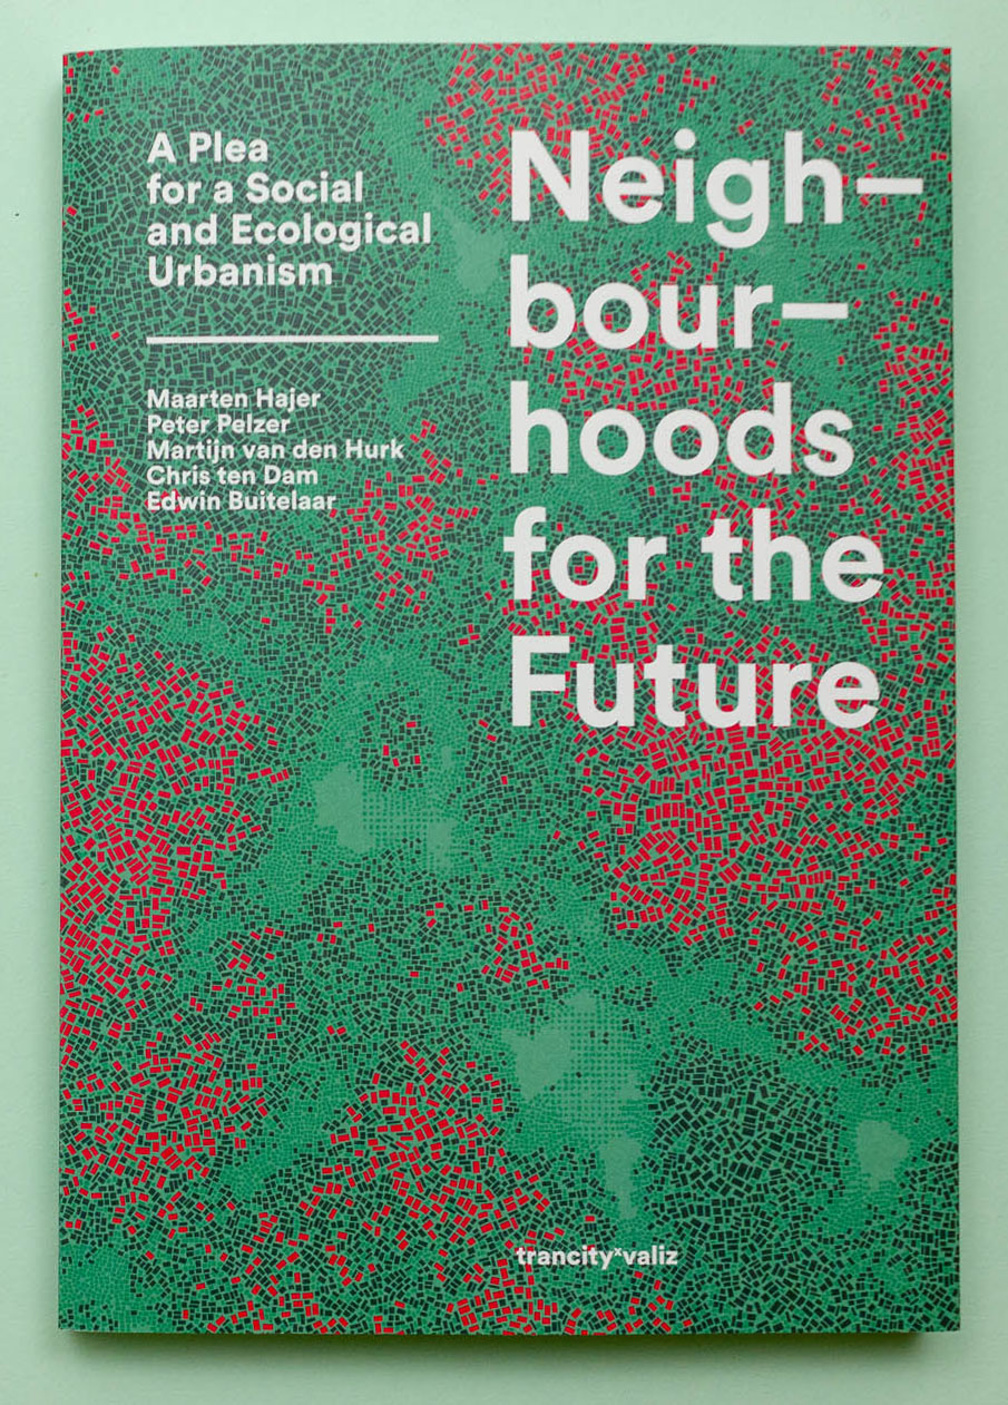
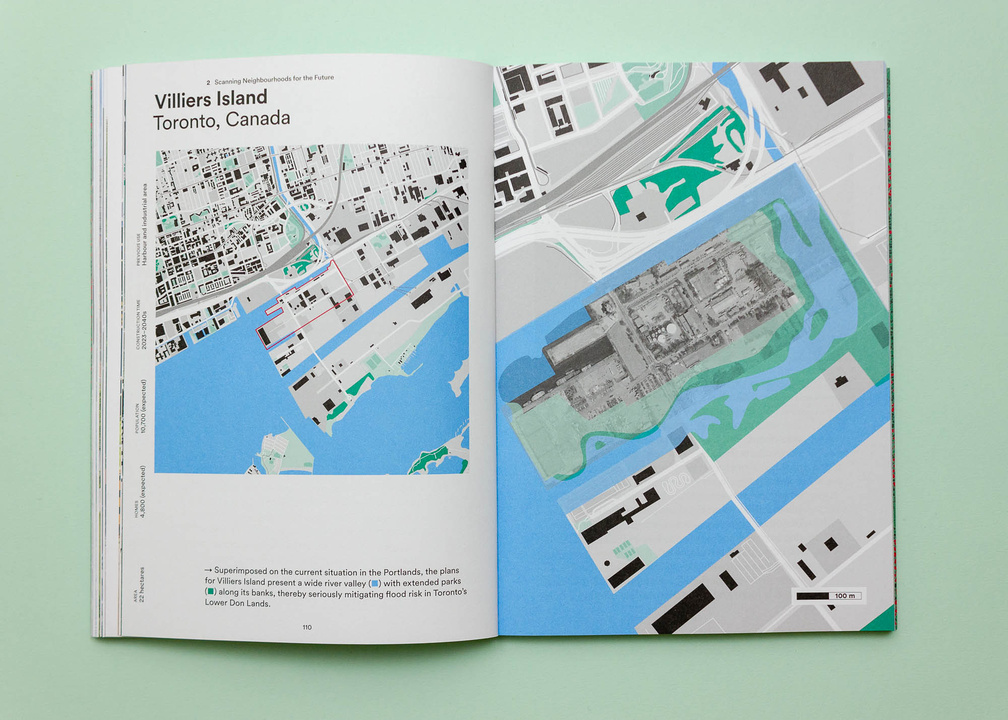
November 2020 – Book Design and cartograhy for 'Neighbourhoods for the Future, A Plea for a Social and Ecological Urbanism'. On the city, urban change and the public domain. Authors: Maarten Hajer, Peter Pelzer, Martijn van den Hurk, Chris ten Dam and Edwin Buitelaar.
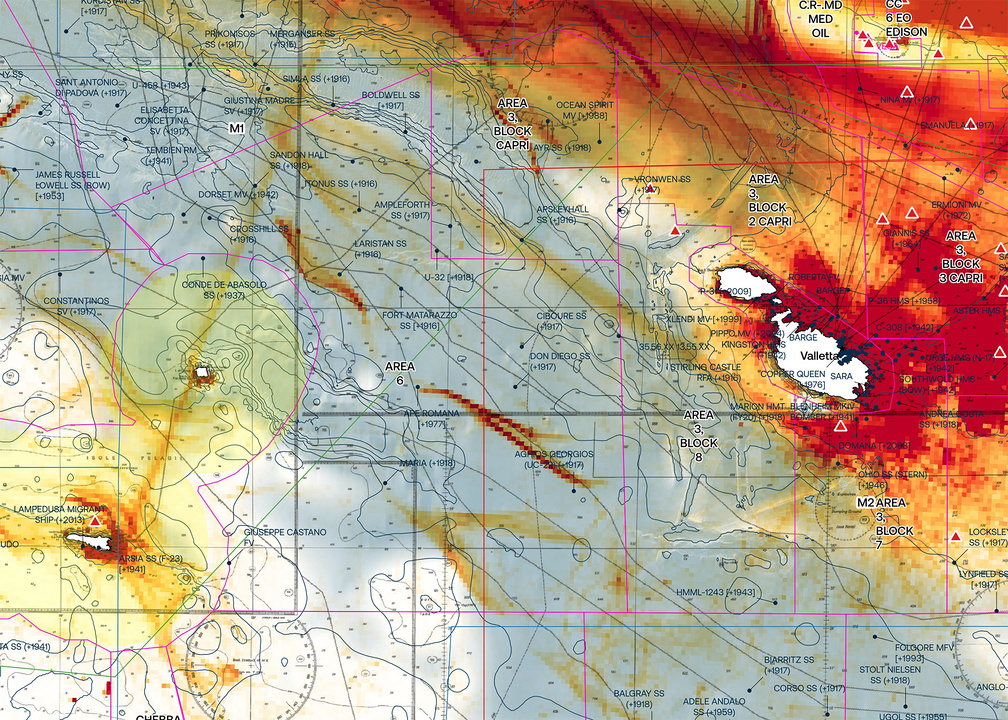
Mediterranean Sea
September 2020 – Map aggregation and map reprojections for artist Rossella Biscotti project "The Journey" -- a performance of a ship navigating a GPS content-related route inspired by time, history and current geopolitical data researched together with different experts and communities in an area of the Mediterranean Sea between Italy, Malta, Tunisia, Libya.
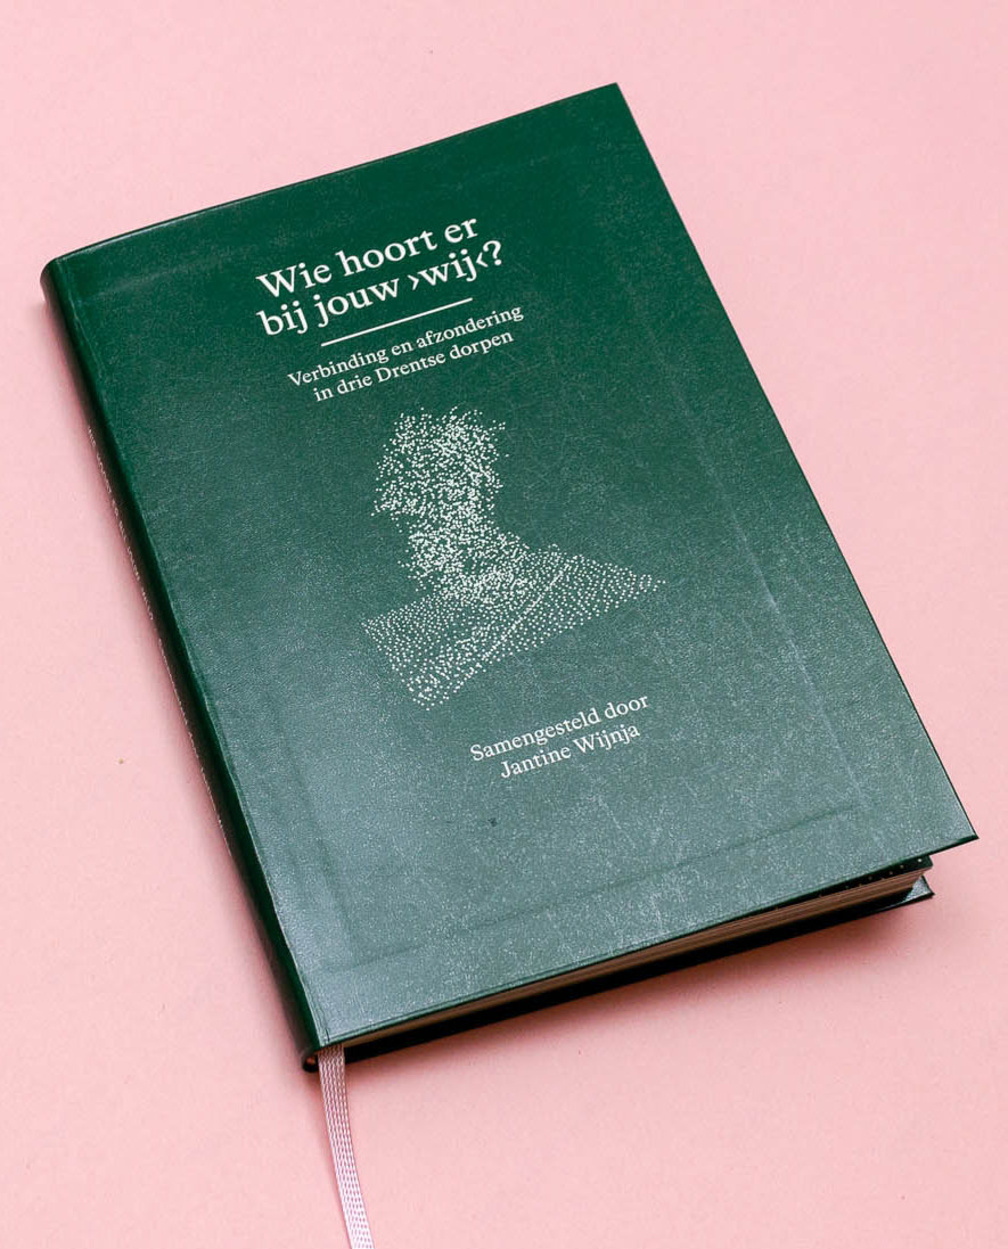
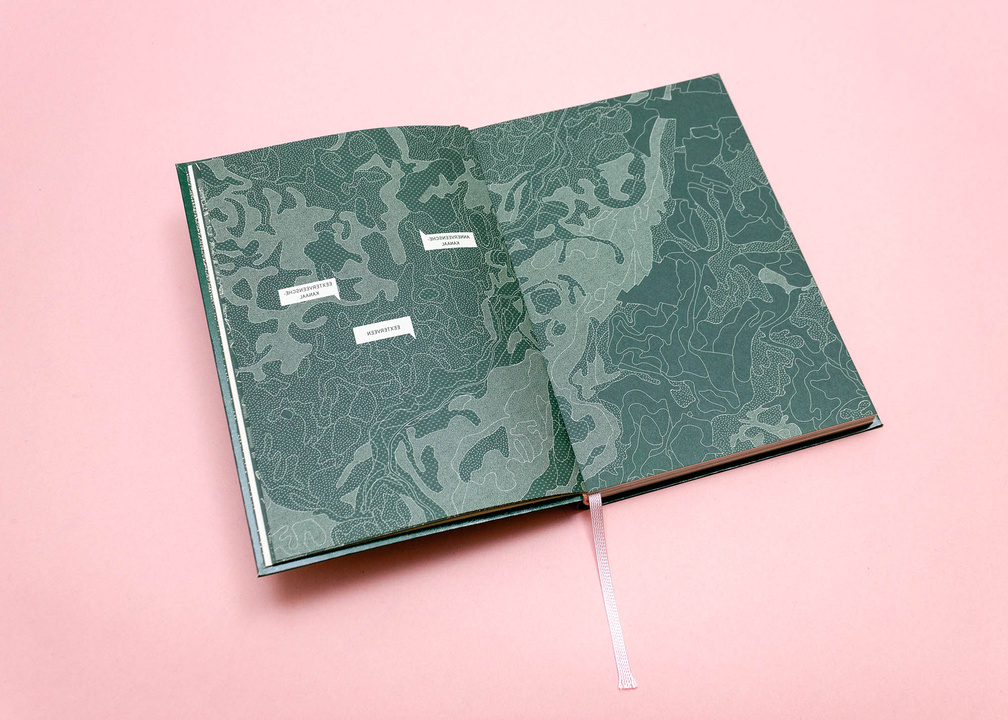
September 2020 – Book Design, text analysis and maps for ‘Dit Is Nu’ (‘This is Now’), an ongoing project of artist Jantine Wijnja.
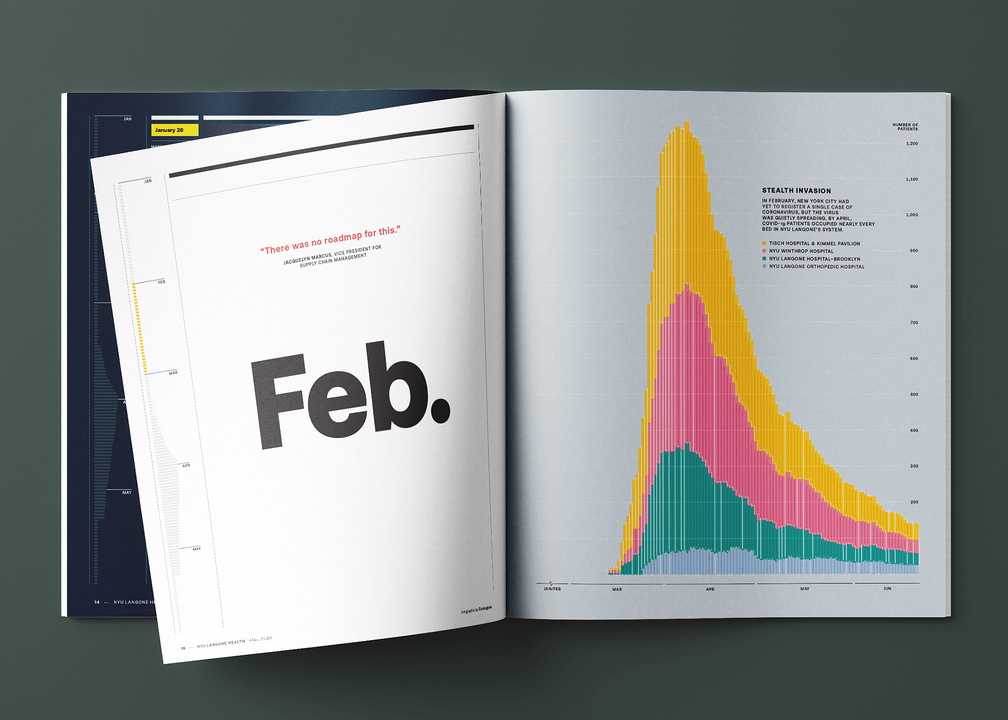
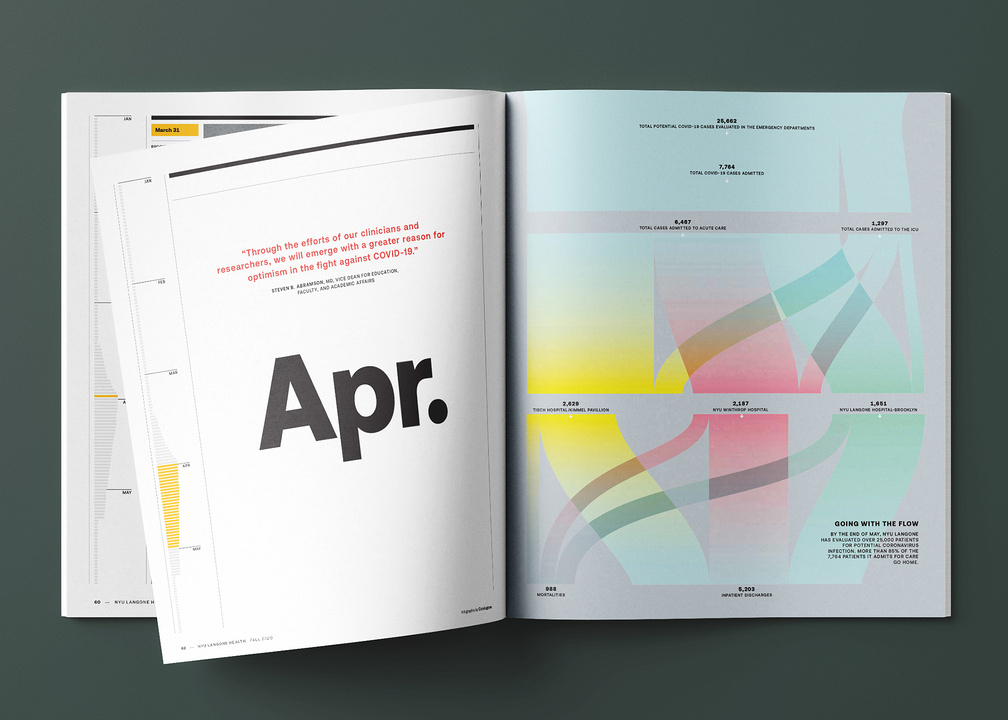
July 2020 – Infographics and openers for "How We Saved Lives", a special issue of the NYU Langone Health Magazine, New York (USA).


How competition makes us creative
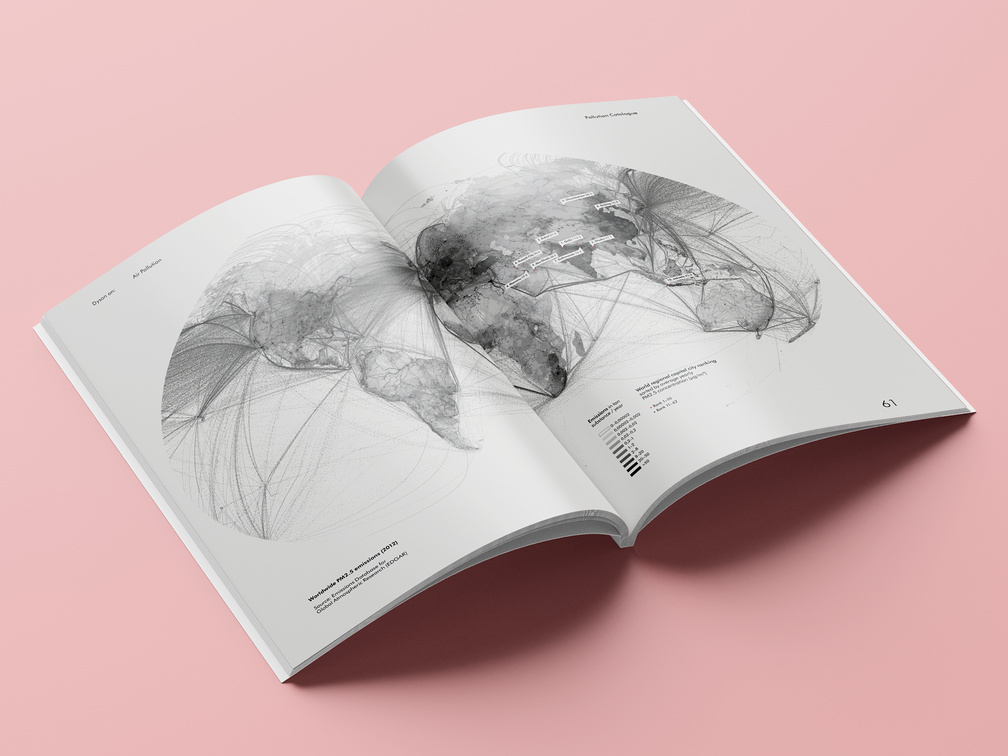
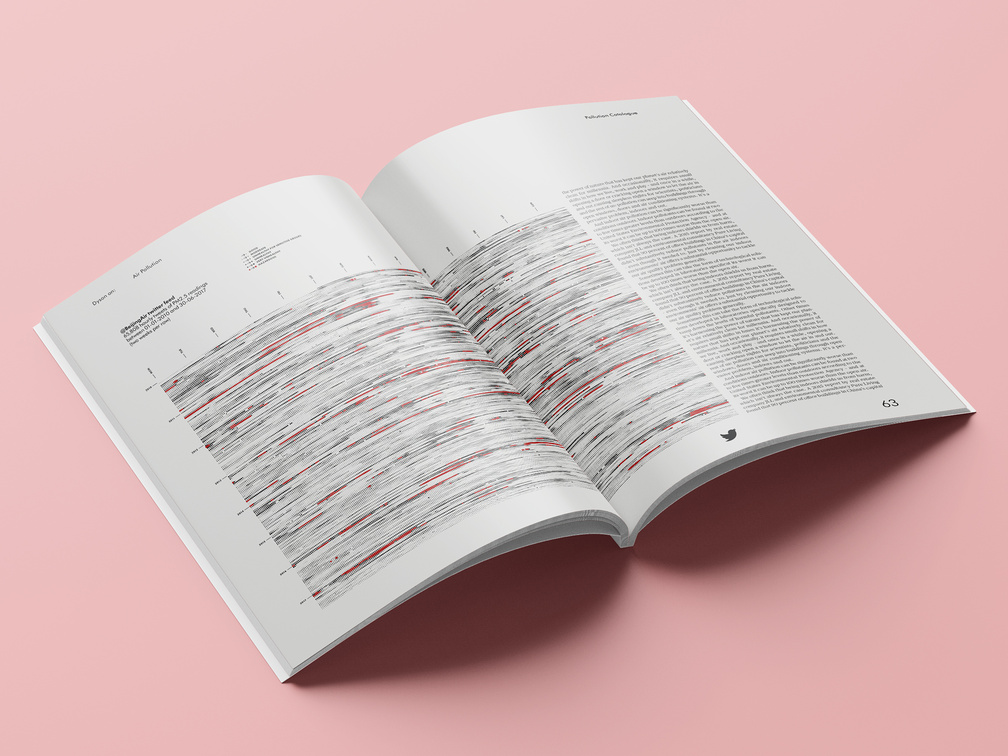
July 2019 – Graphics on air pollution for the second issue of Dyson on: Magazine.
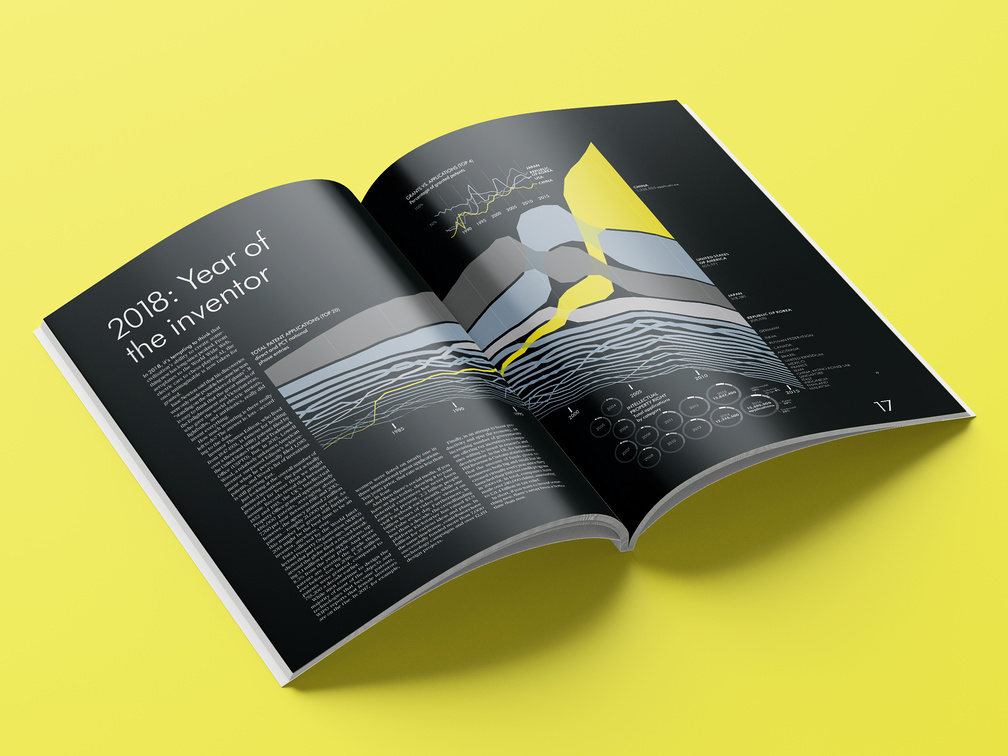
Year of the inventor?
March 2019 – Graphics on worldwide patent applications for the first issue of Dyson on: Magazine.
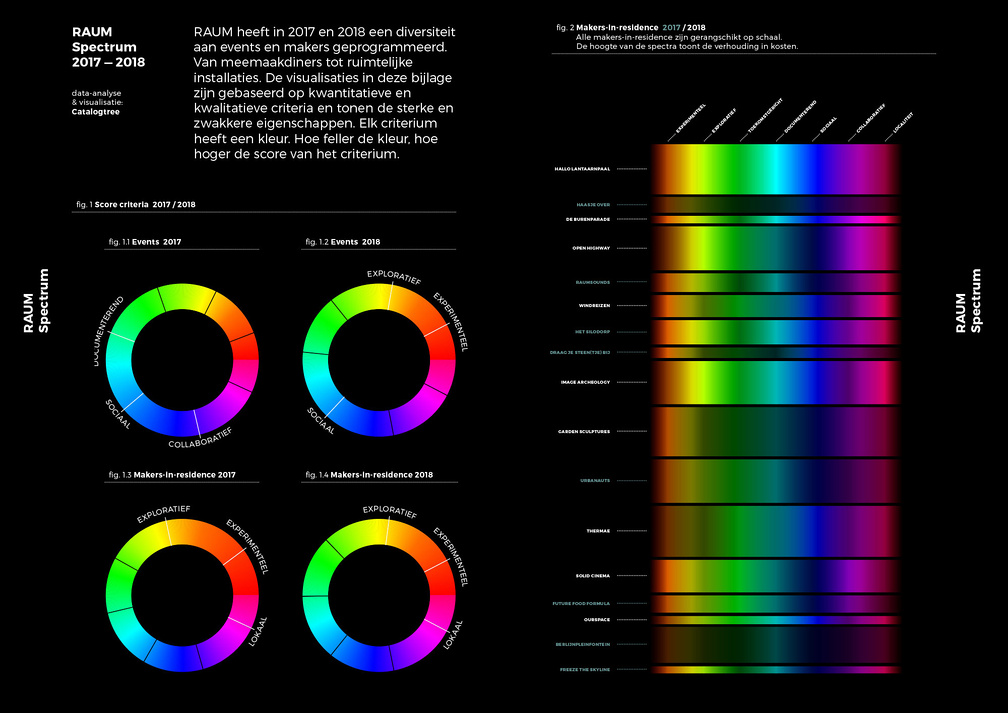
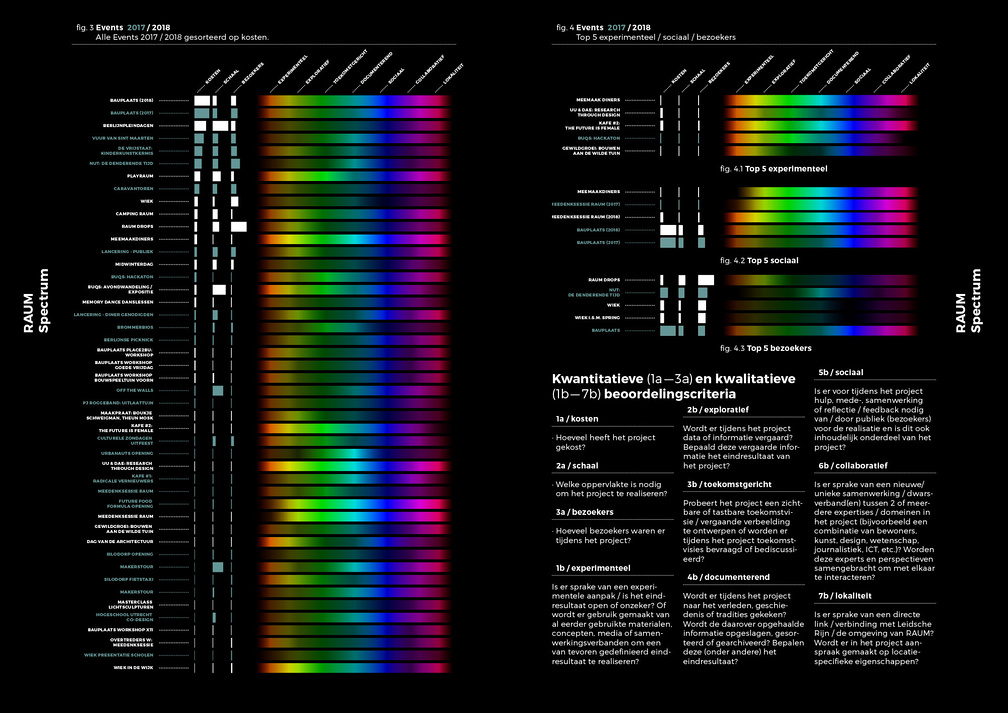
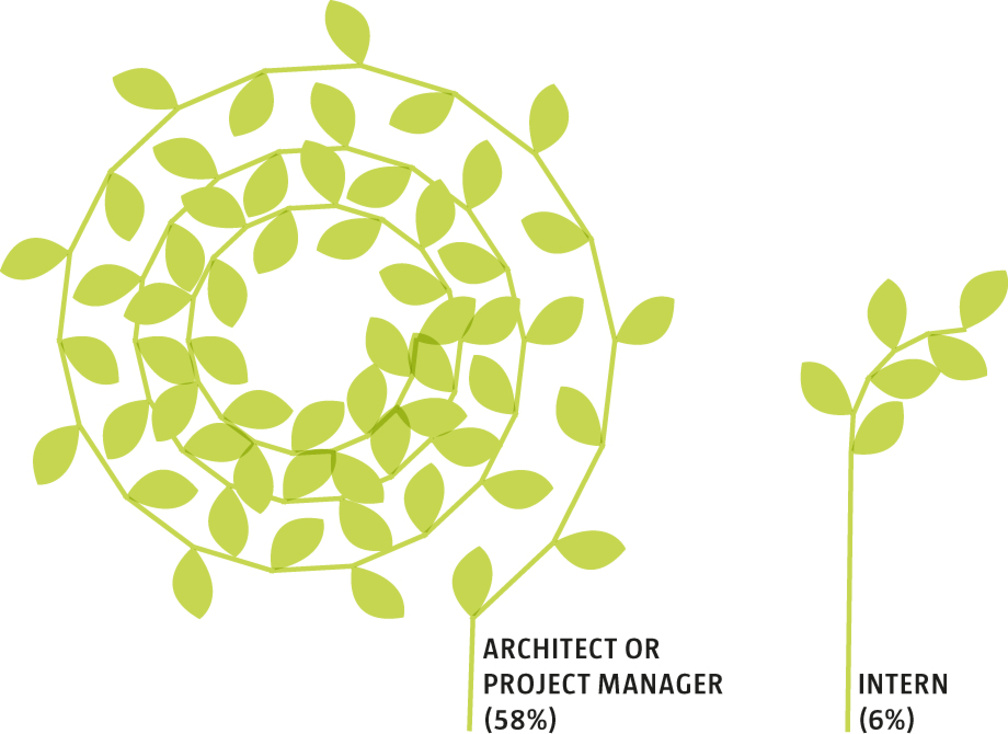
RAUM spectrum
October 2018 – Visualisations of all projects in 2017/18 organized by RAUM (Utrecht, NL). Most frequent adverb-noun combinations are retrieved automatically from all RAUM reports and publications and used as a starting point to rate all projects based on their quantitative and qualitative characteristics.
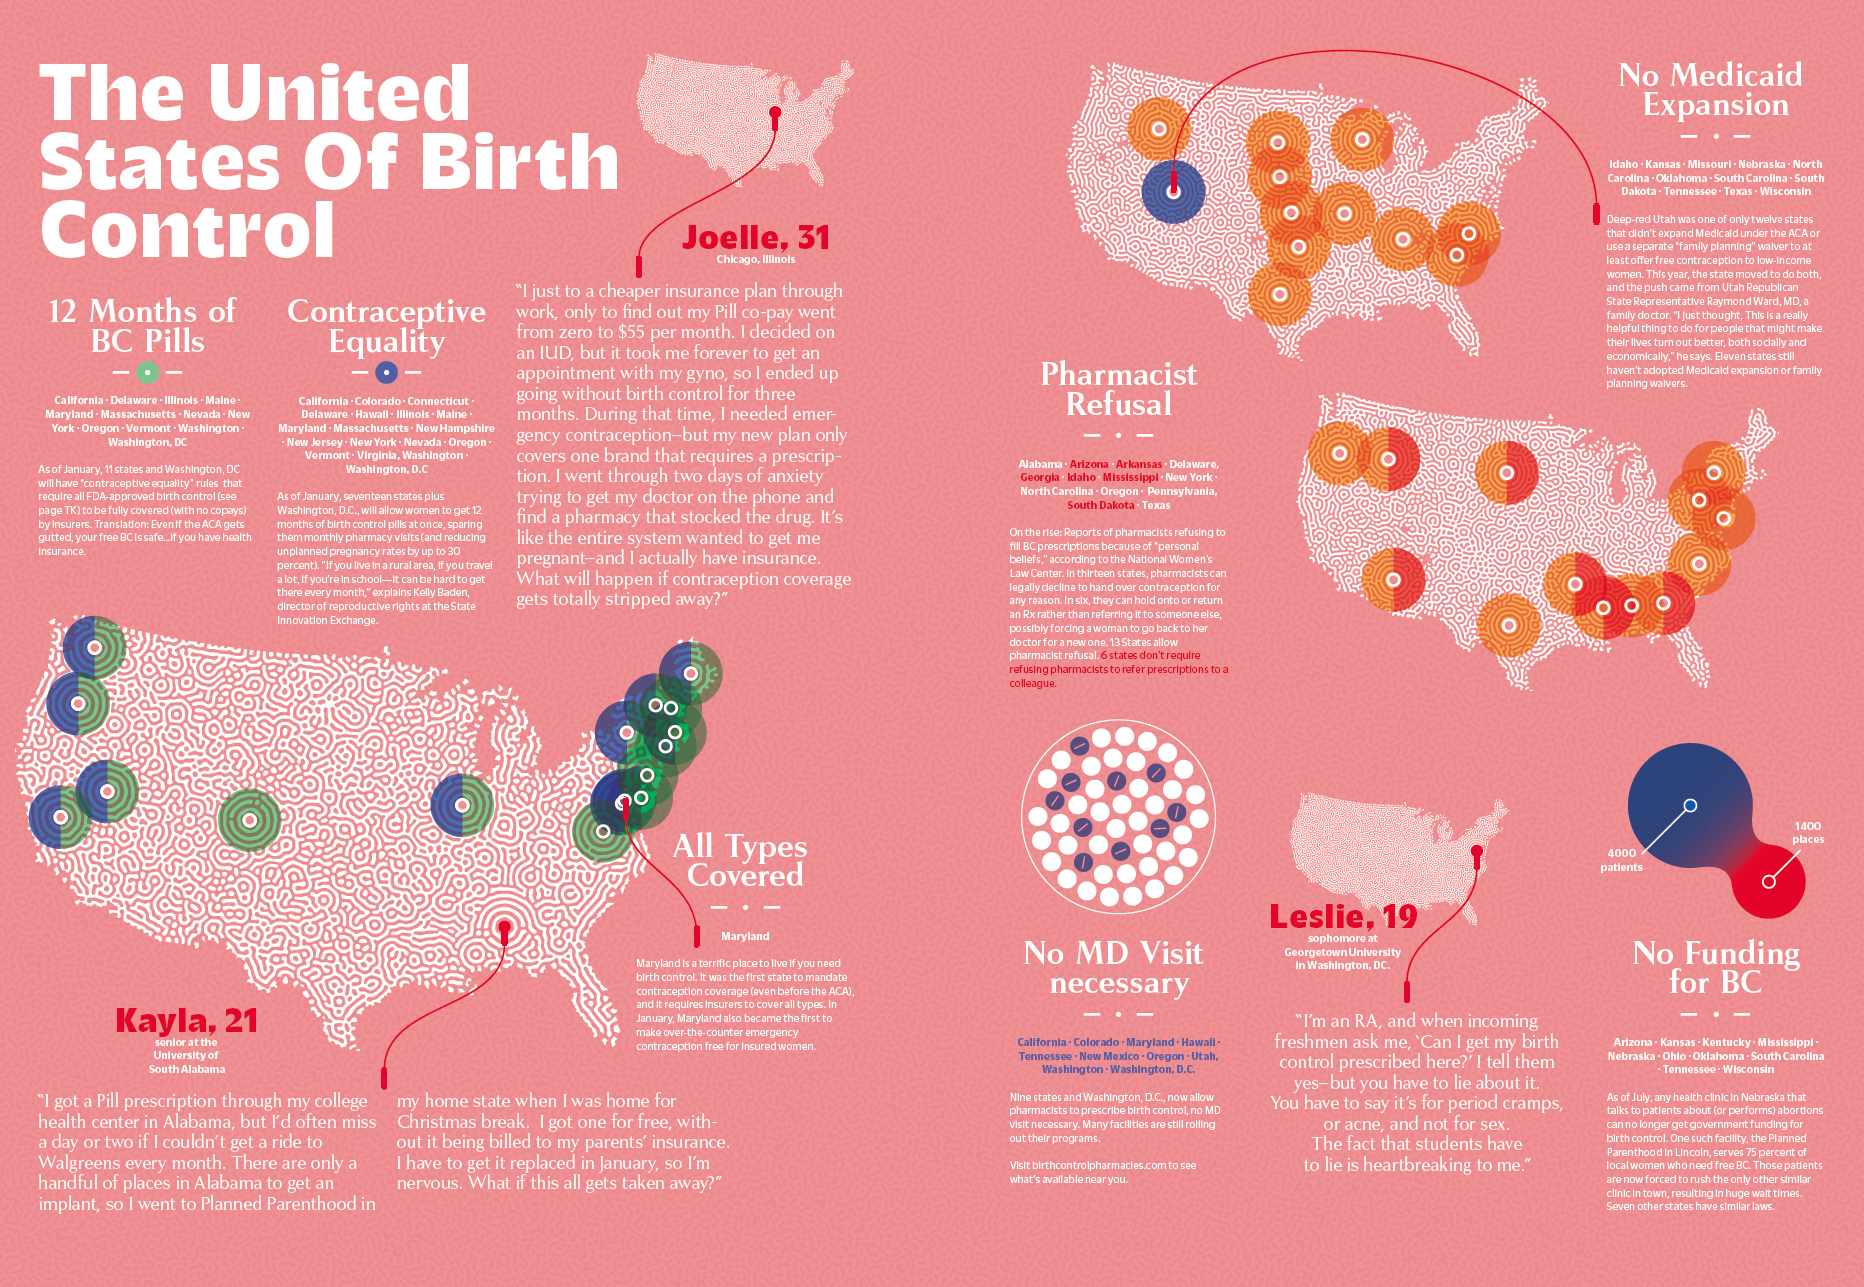

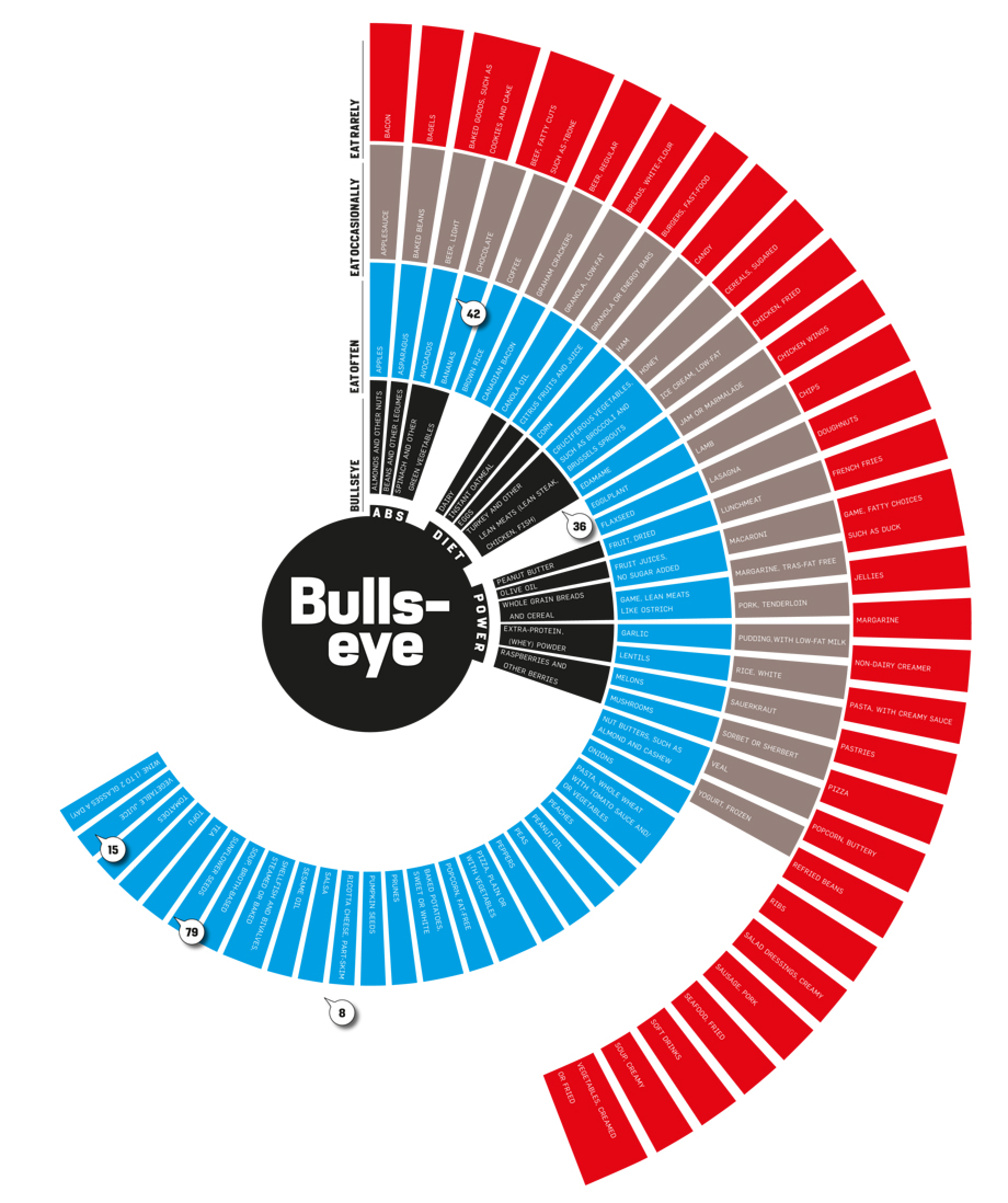
The United States of Birth Control
September 2018 – Various graphics on birth control in the U.S. for the November issue of Cosmopolitan Magazine.
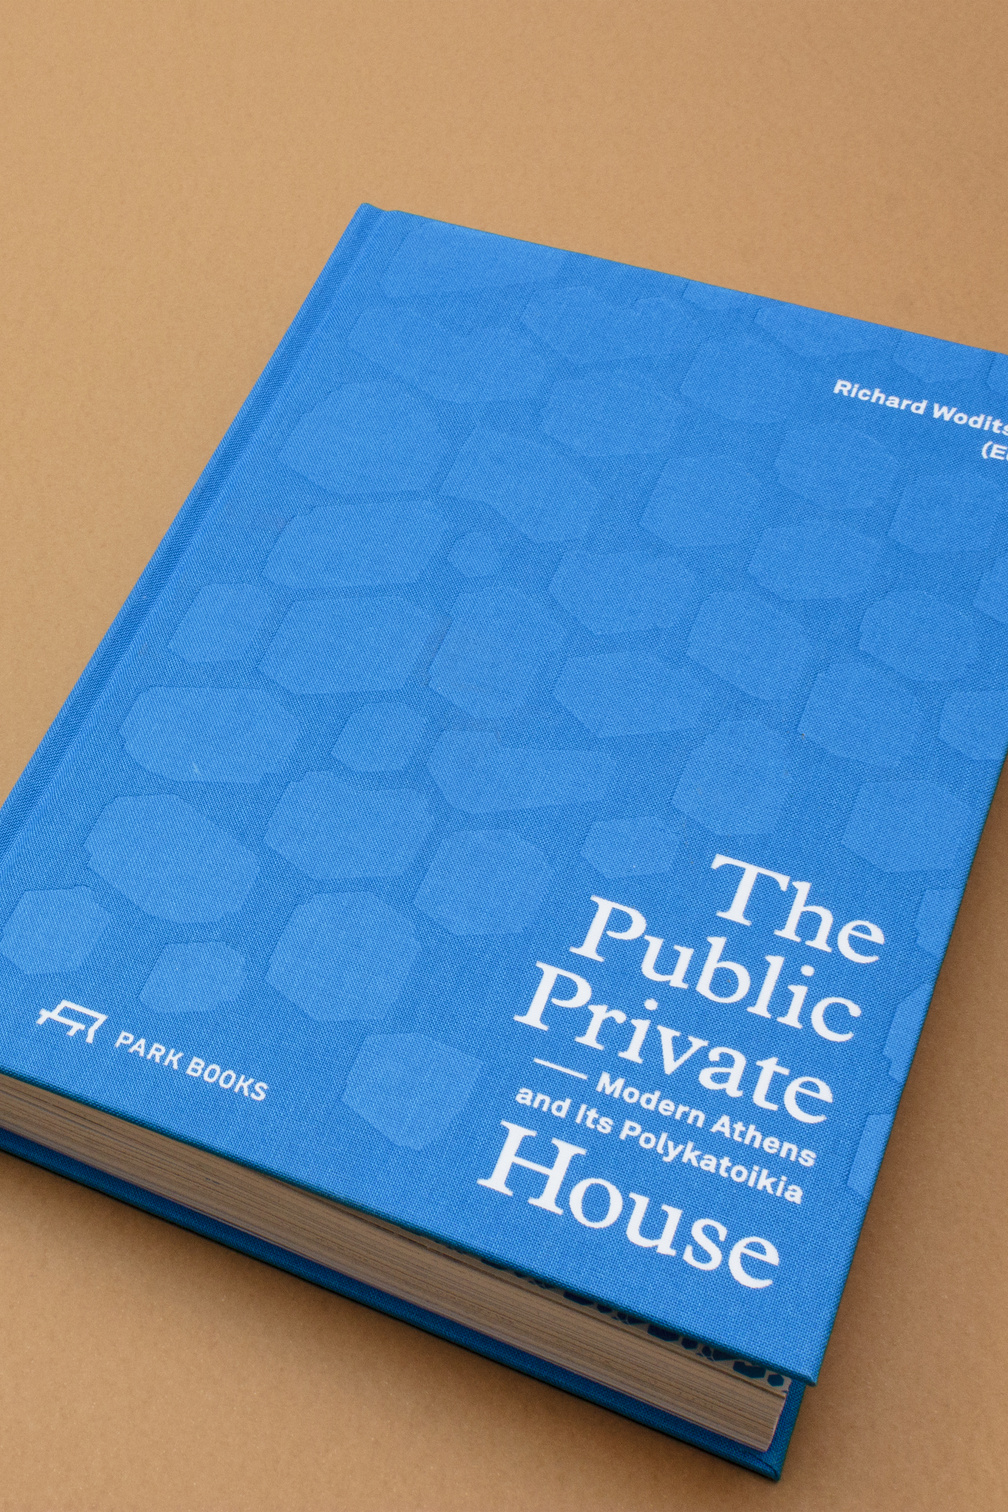
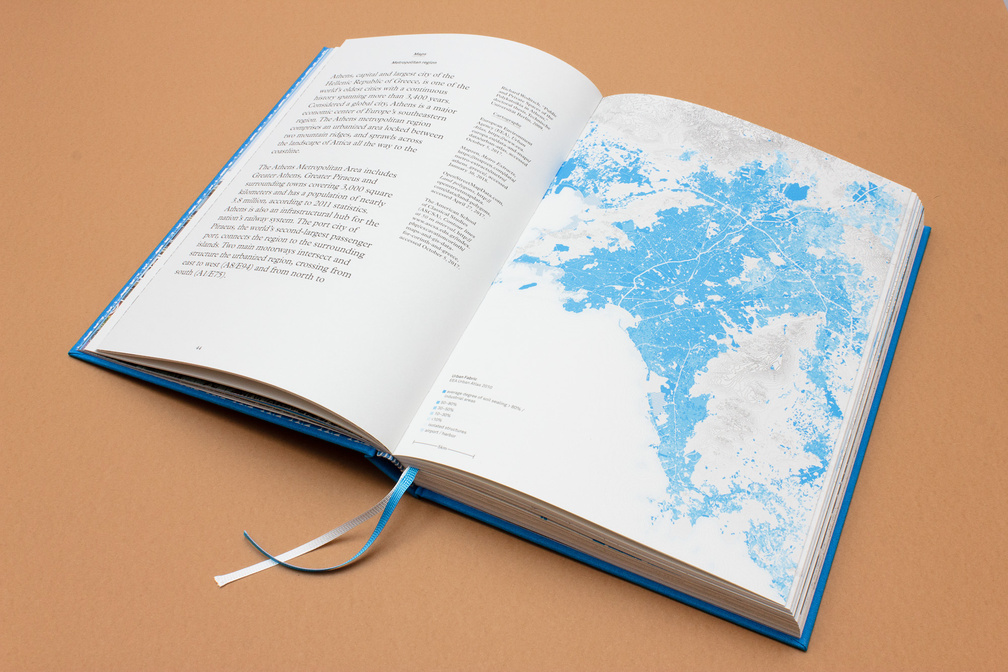
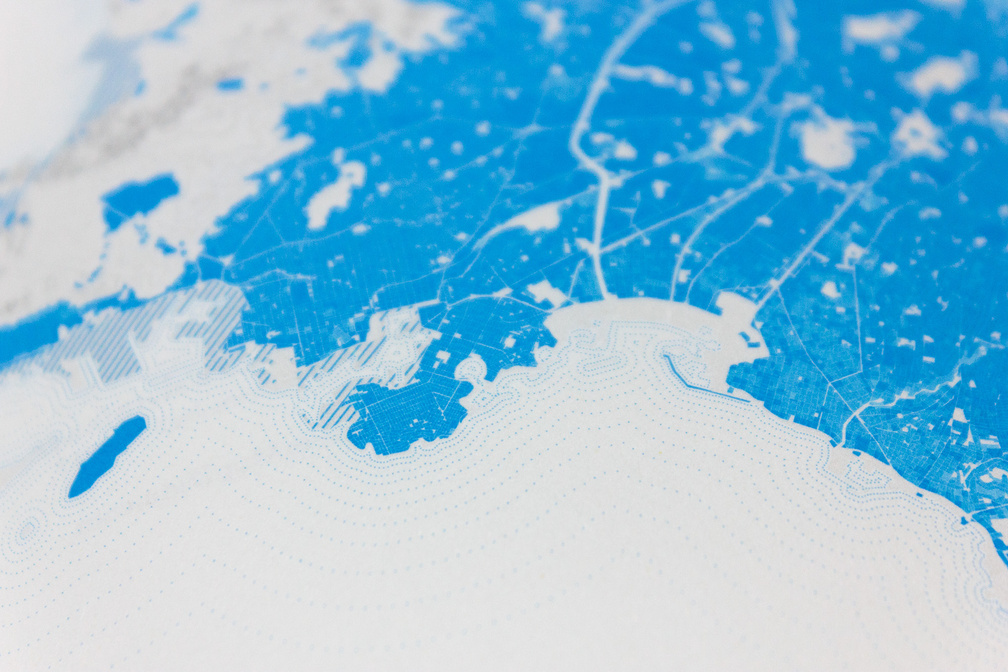
September 2018 – ‘The Public Private House’, edited by Prof. Dr. Richard Woditsch and published by Park Books, Zurich (CH), examines the building typology of simple apartments blocks, the ‘Polykatoikia’, that define Athen's signature housing structure. On the shortlist for ‘Die schönsten Deutschen Bücher 2019’.
Twenty years of KAAN Architecten
June 2018 – Video on the occasion of their 20 year anniversary for KAAN Architecten, Rotterdam (NL). In collaboration with Plaatsmaken (video editing) .
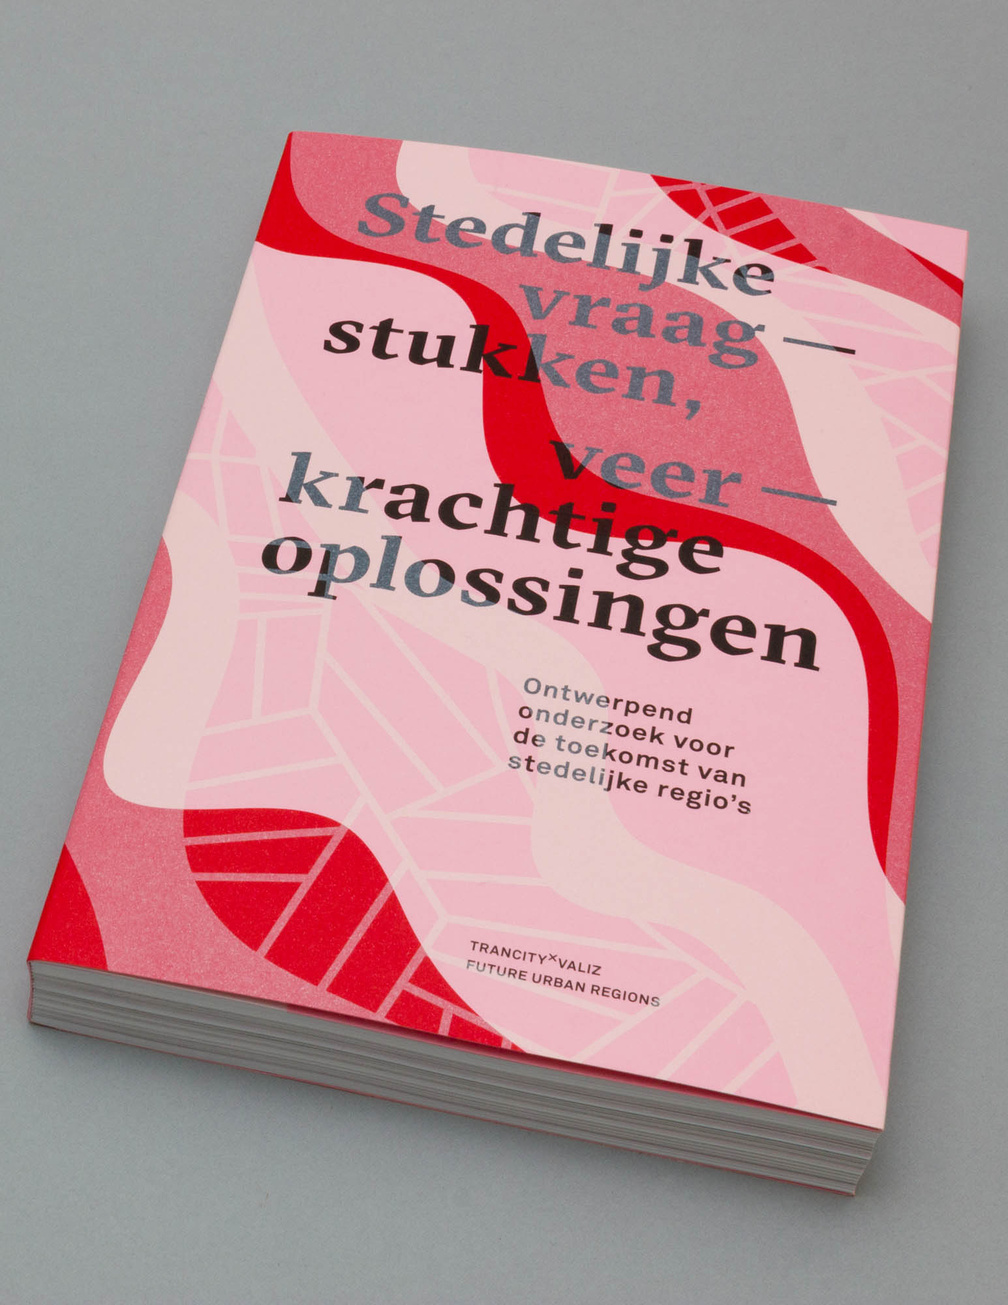

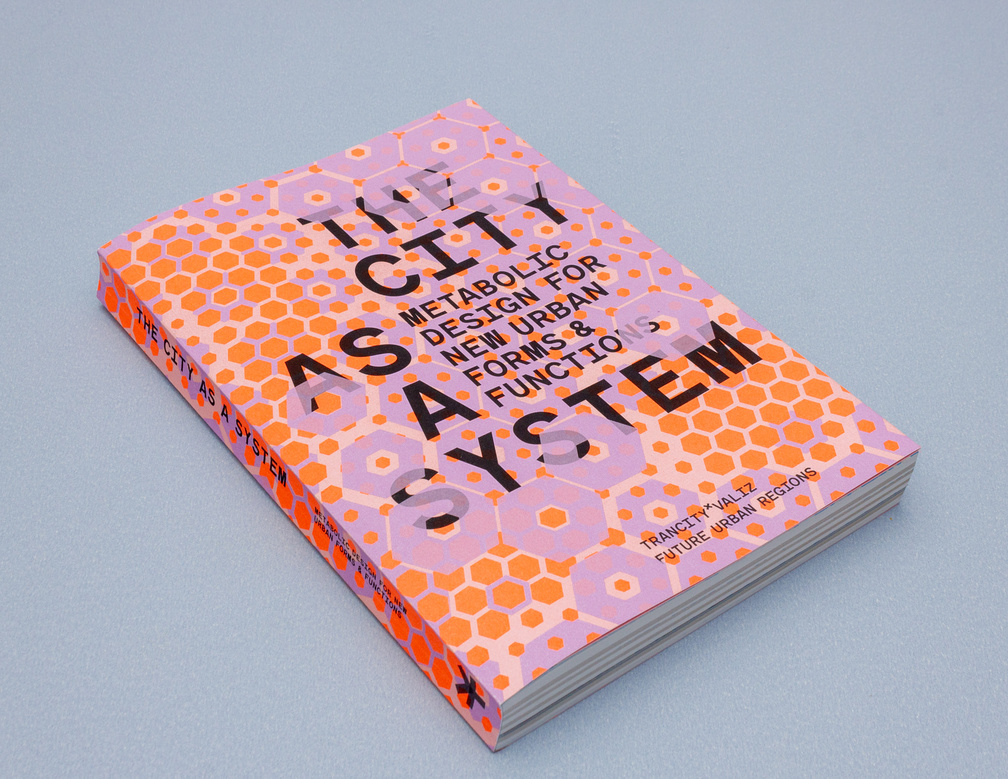
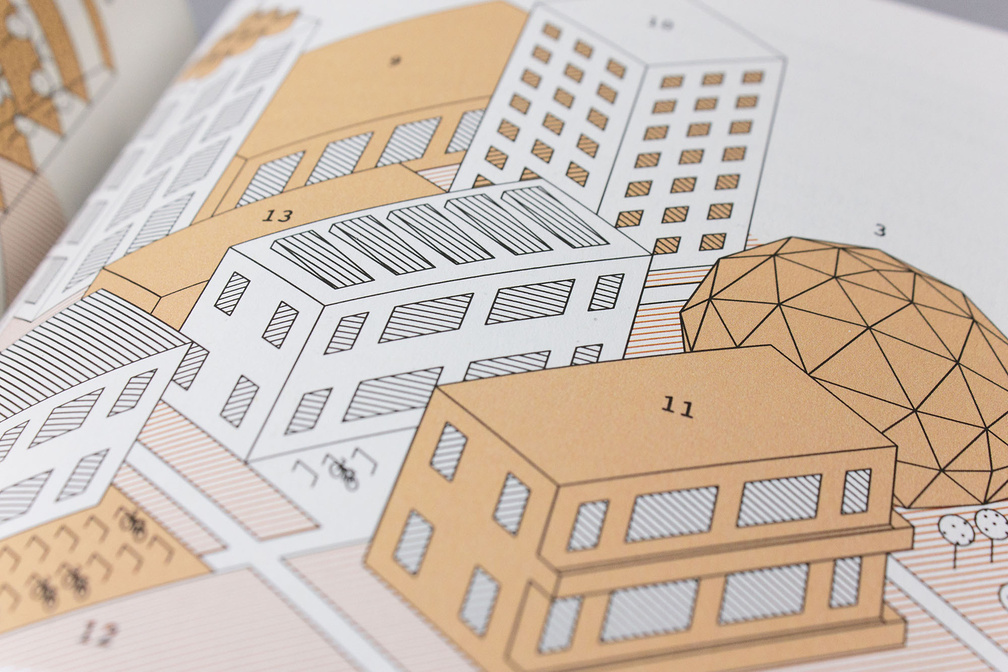
October 2017 – Book Design for ‘Urban Challenges, Resilient Solutions’ in which the ‘Future Urban Regions Lectorate’ offers designers, their commissioners and (local) governments new models and ideas to deal with healthy urban development. Published by trancity*valiz.
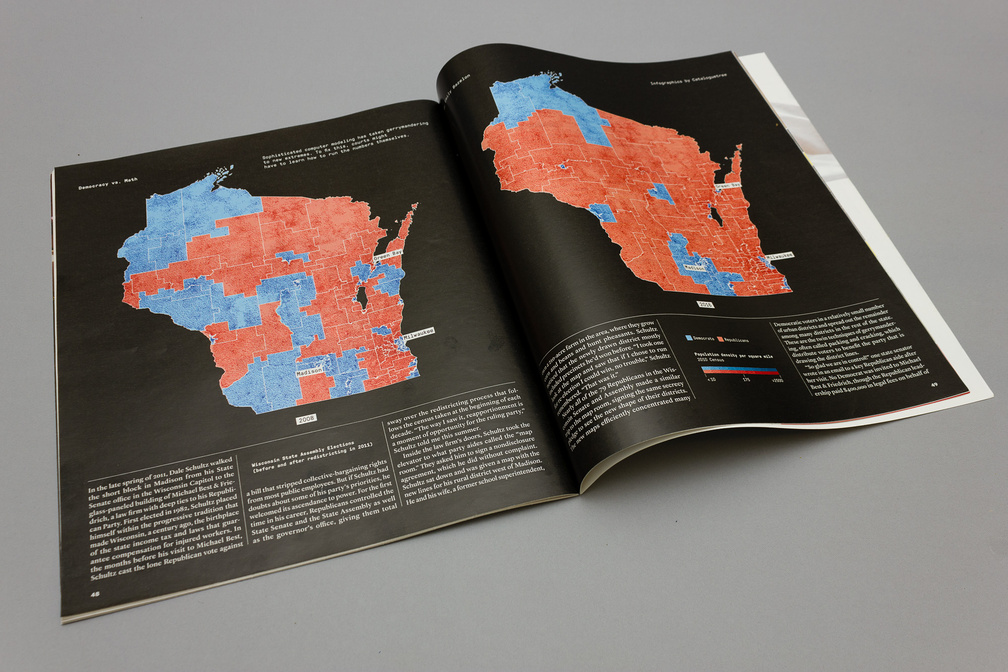
September 2017 – Maps and charts on the Wisconsin State Assembly elections for an article about Gerrymandering for New York Times Magazine.
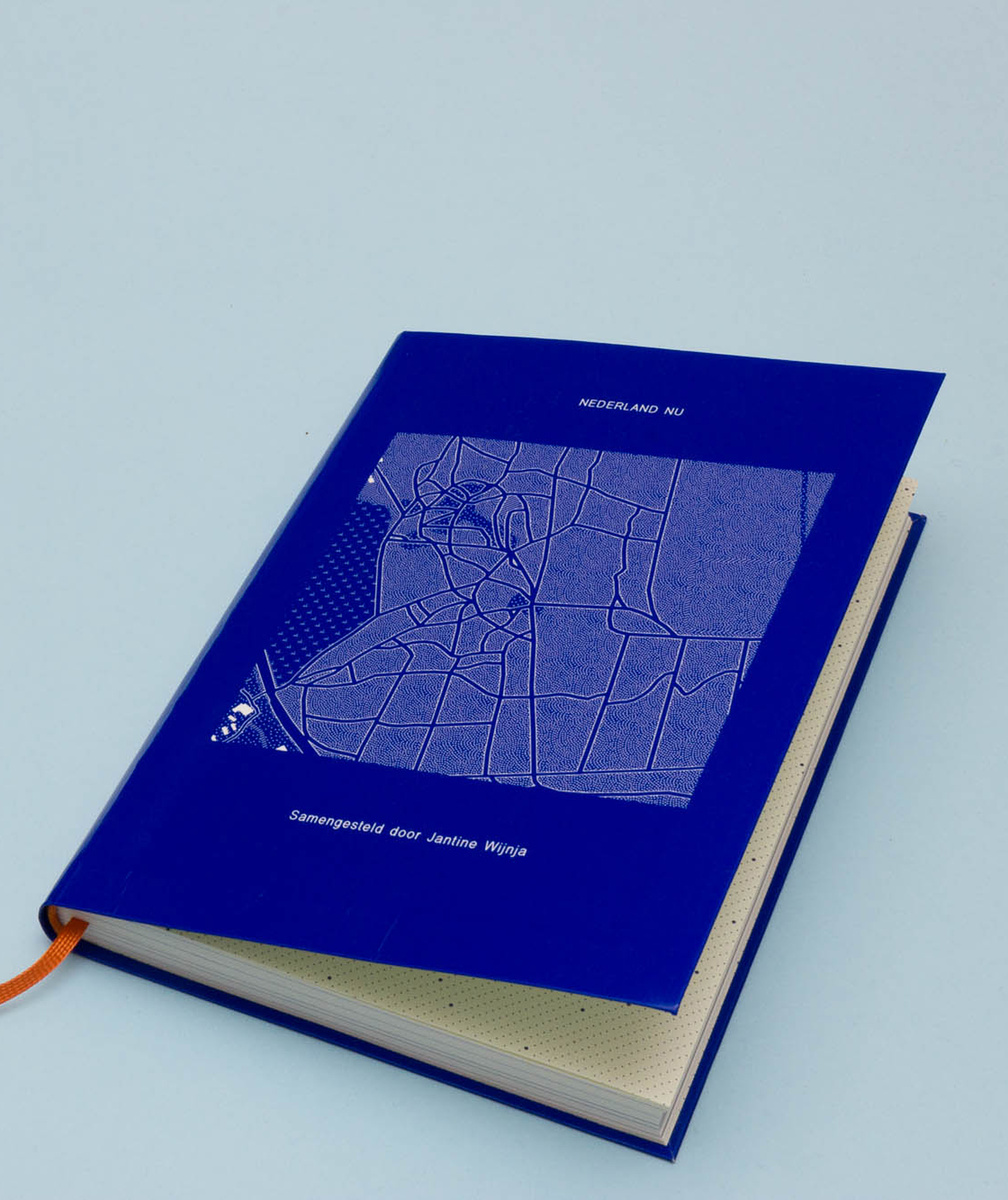
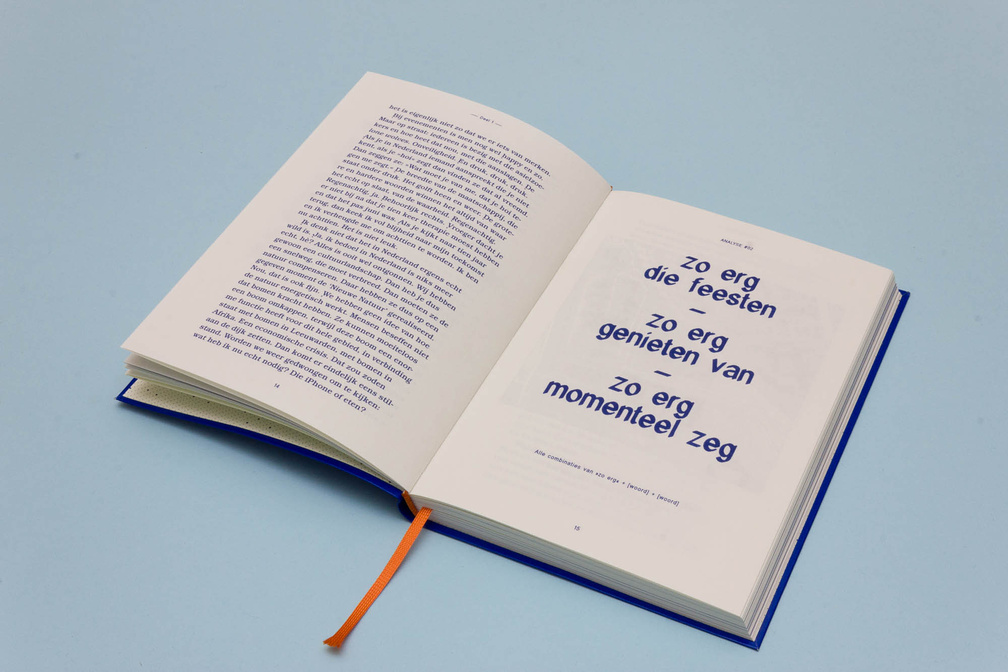
June 2017 – Book Design, text analysis, machine monologues and maps for ‘Dit Is Nu’ (‘This is Now’), an ongoing project of Jantine Wijnja.
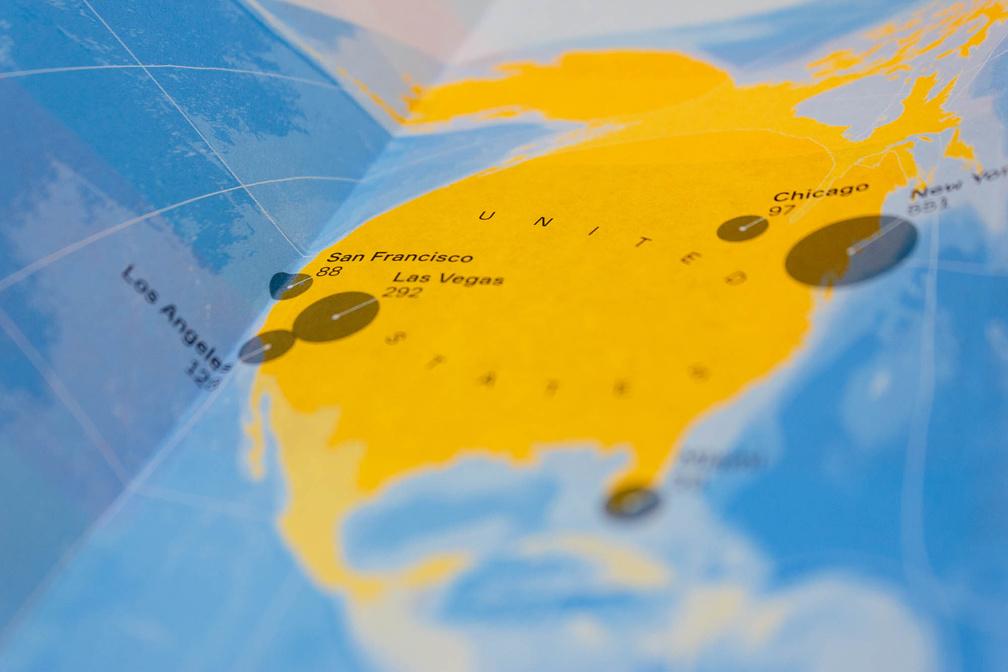

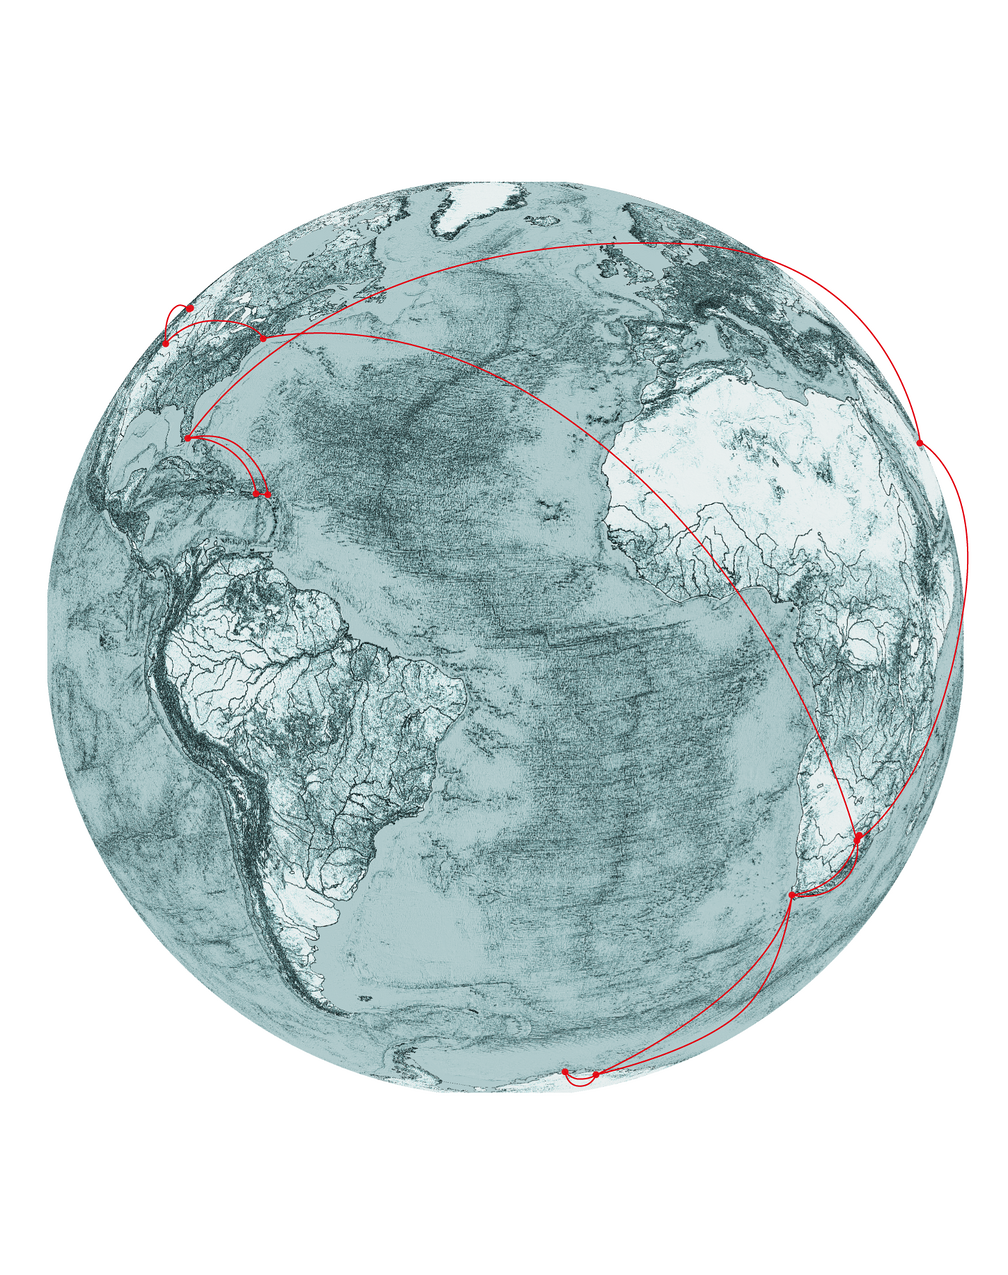
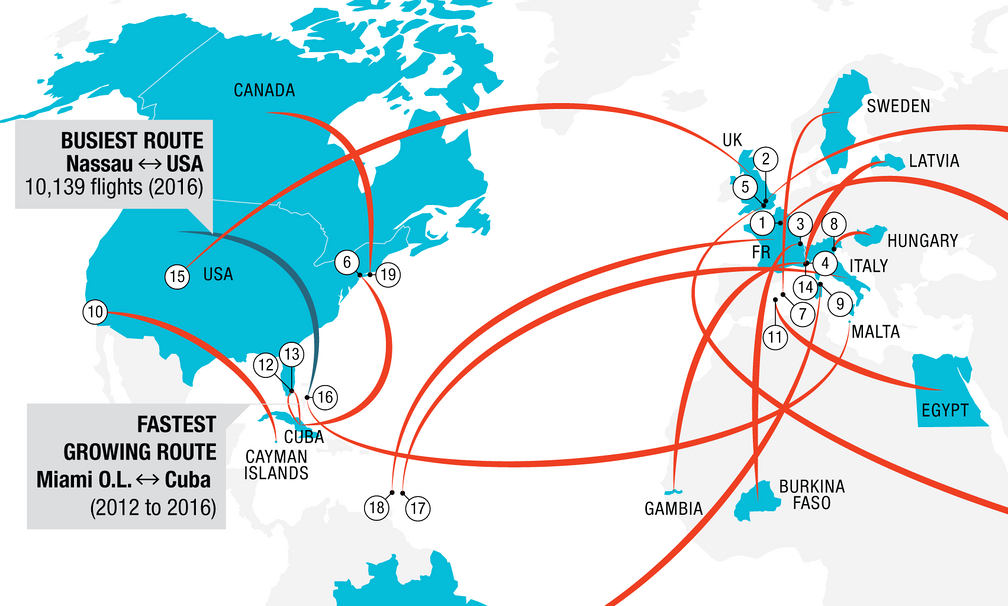
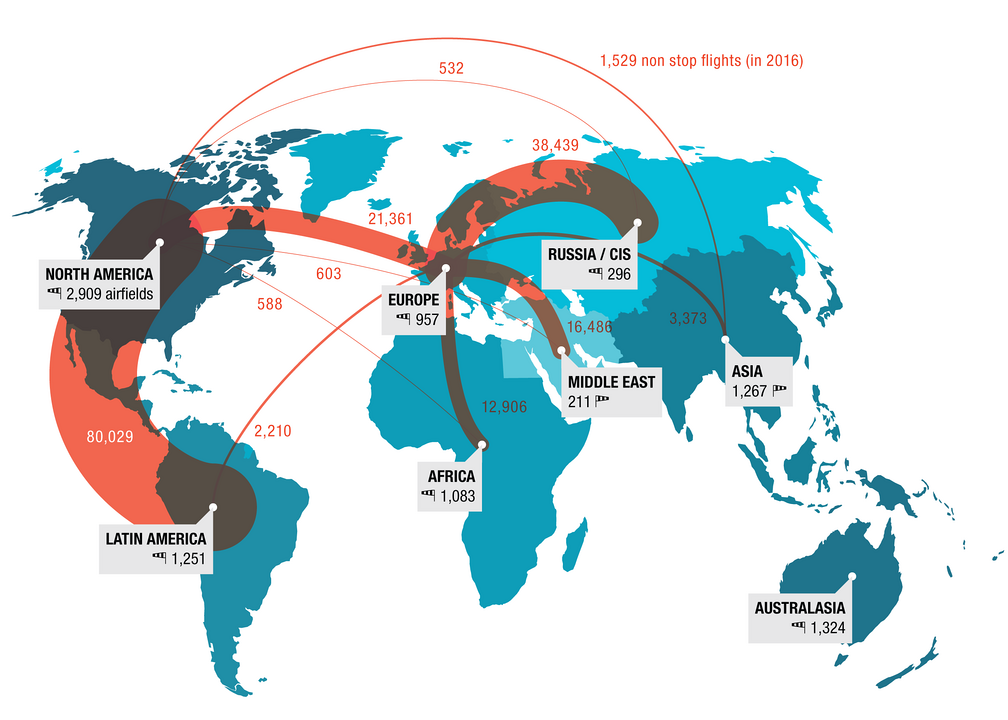
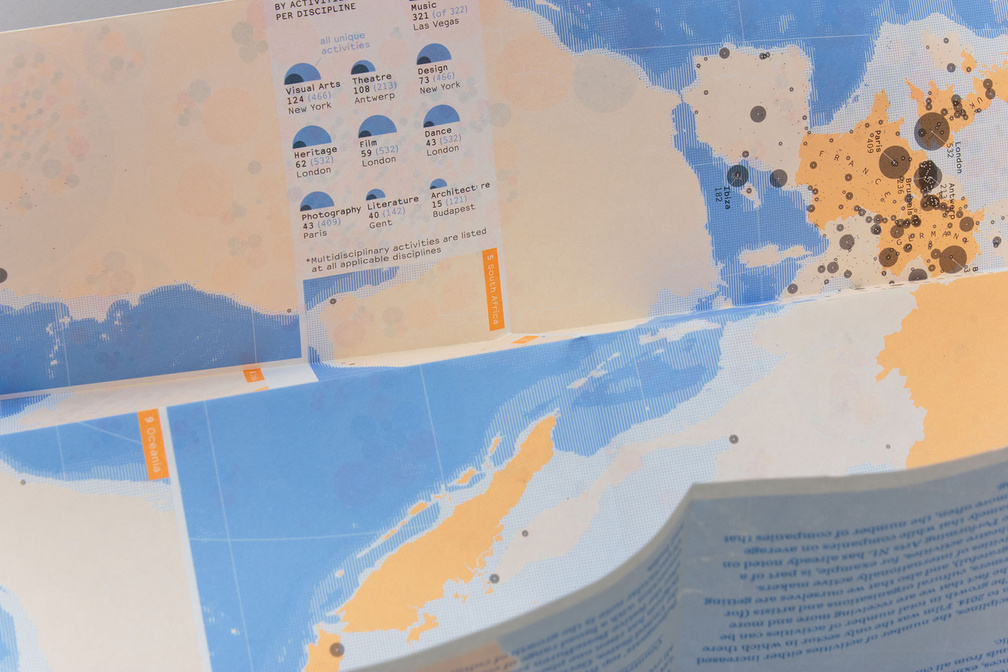
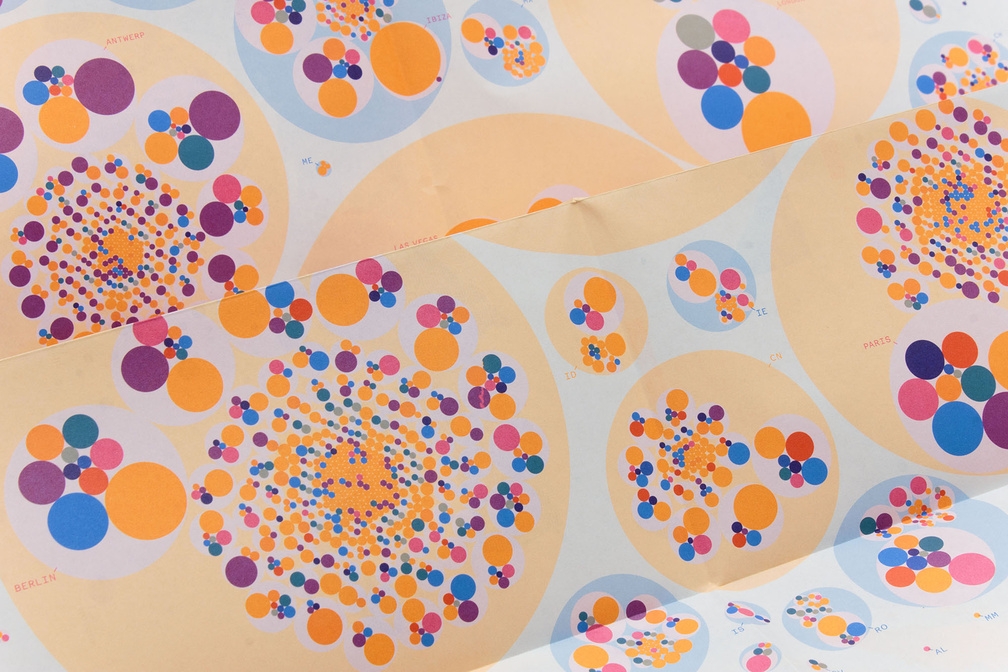
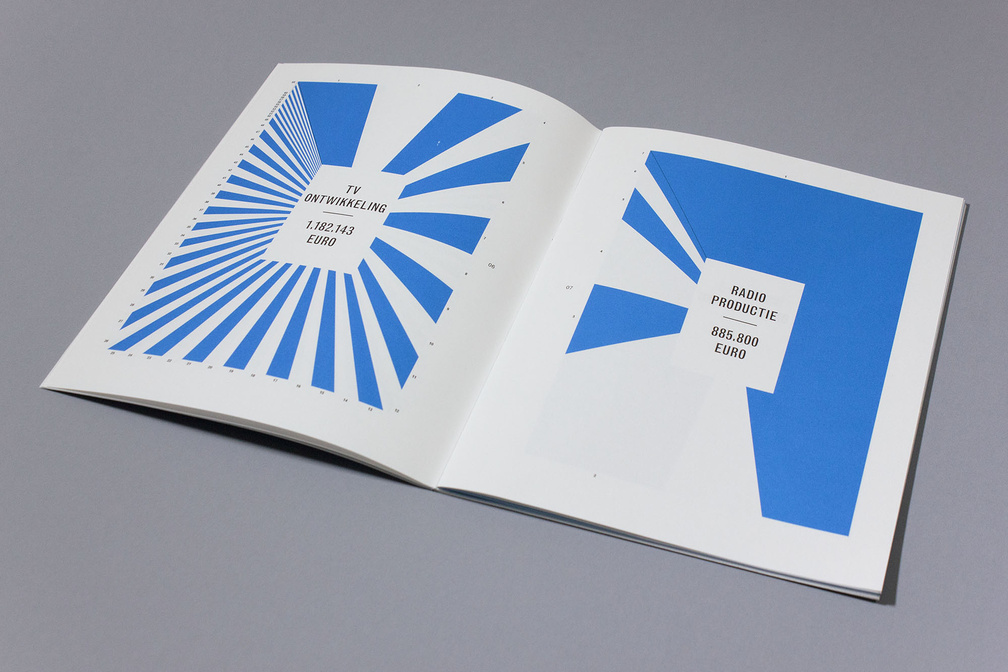
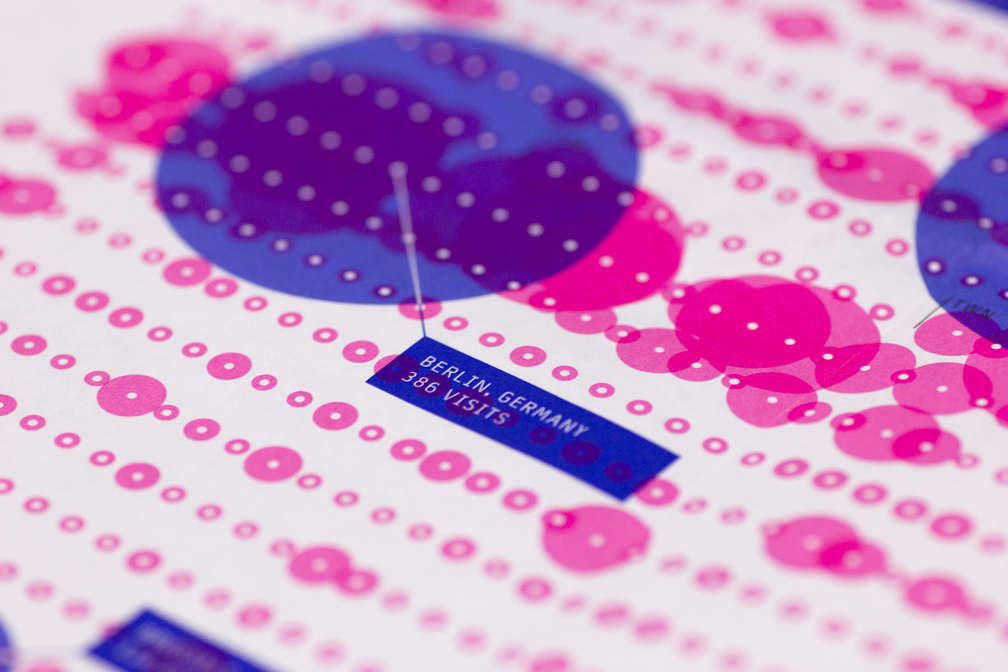
June 2017 – Annual report for DutchCulture, centre for international cooperation, Amsterdam (NL) visualising all cultural activities of dutch artists around the globe in 2016. All activities are sorted by country, city and discipline.
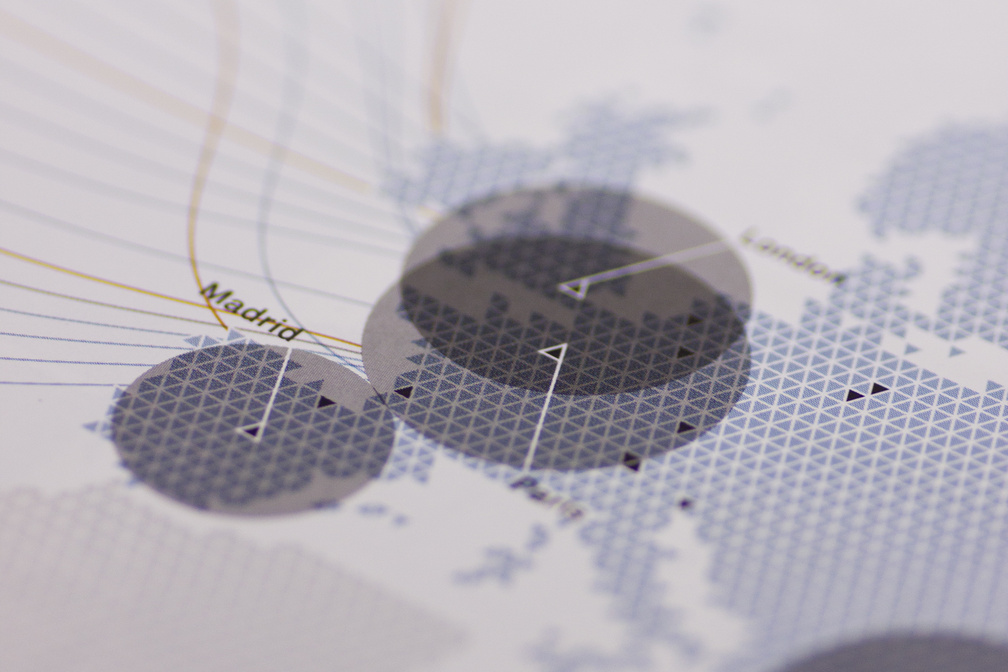
February 2017 – Maps and graphics for ‘The Wealth Report 2017’ published by Knight Frank, London (UK).
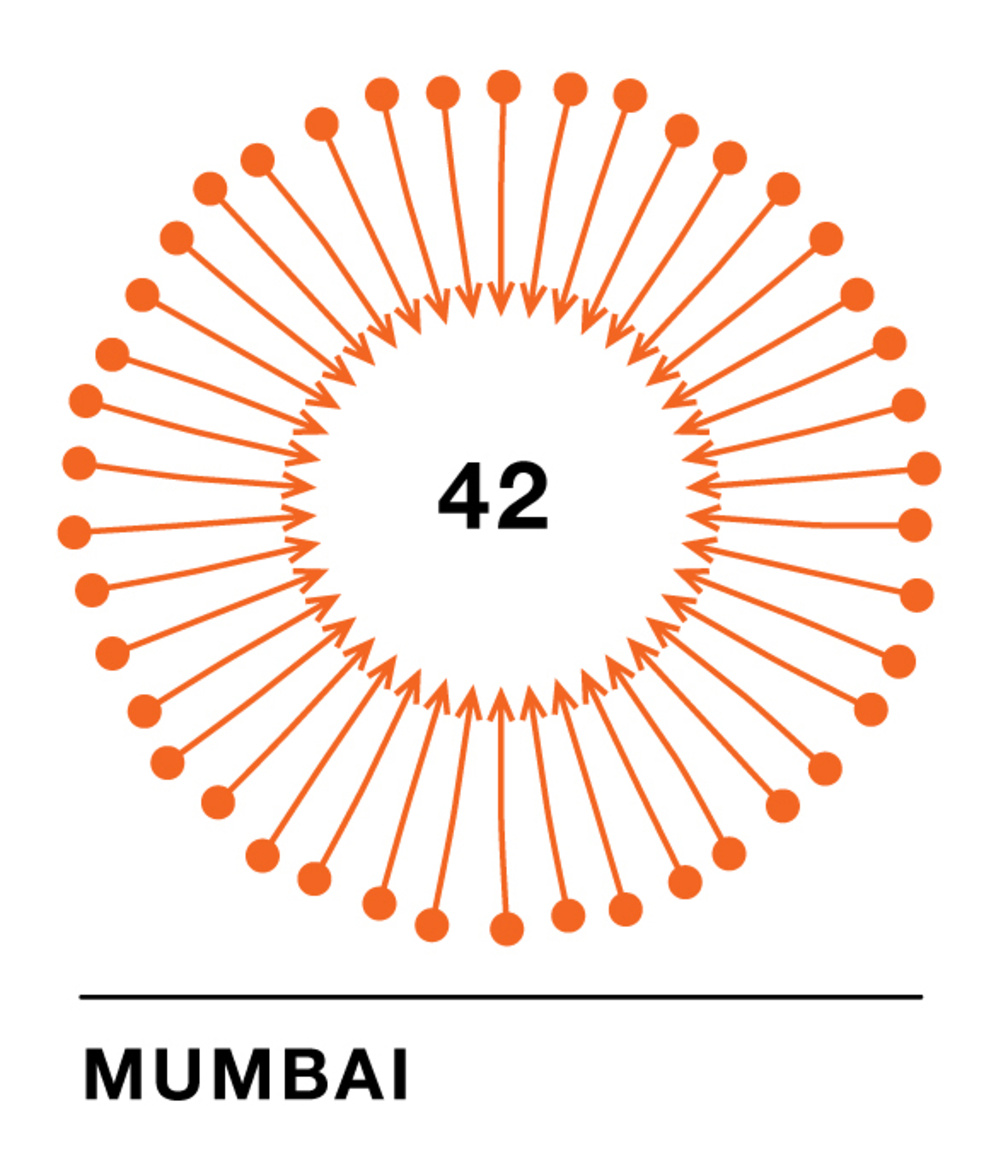
June 2016 – Annual report for DutchCulture, centre for international cooperation, Amsterdam (NL) visualising all 14,470 cultural activities of dutch artists around the globe in 2015. All activities are sorted by country, city and discipline.
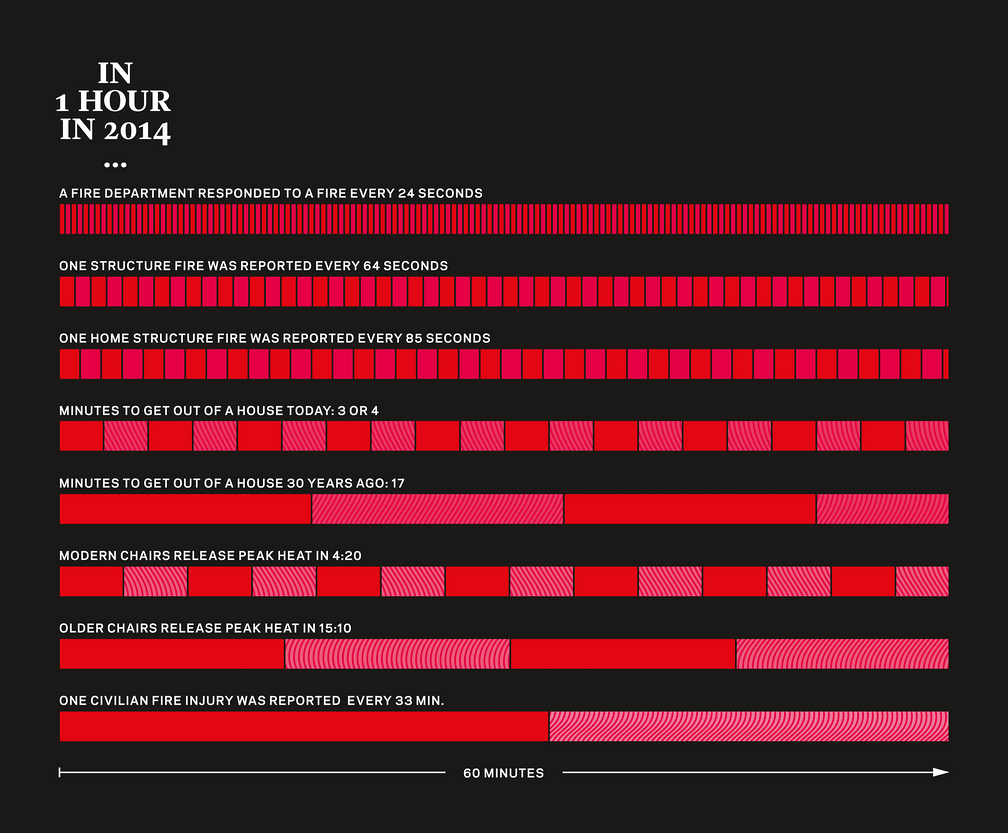
November 2015 – Various graphics on Home Fires in the US for the November Issue of BUILDER Magazine, Washington D.C. (US).
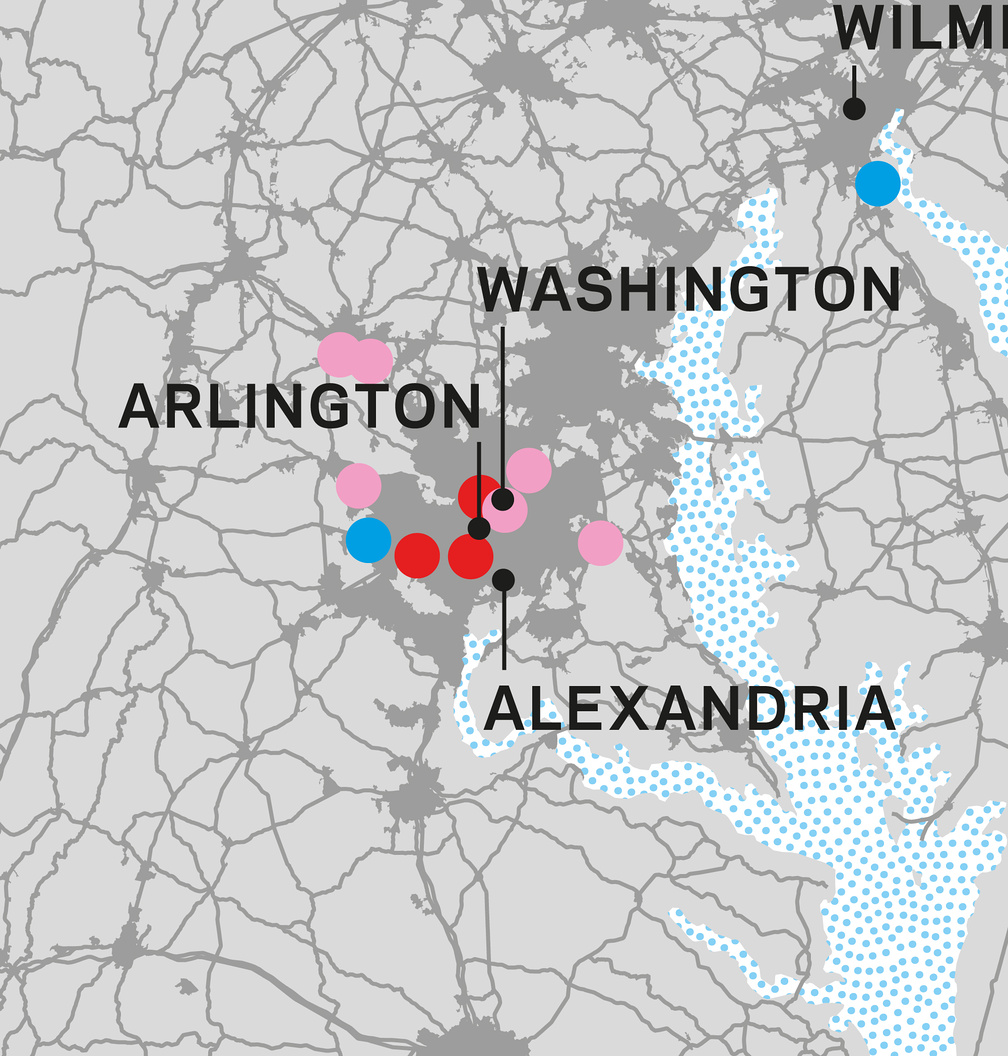
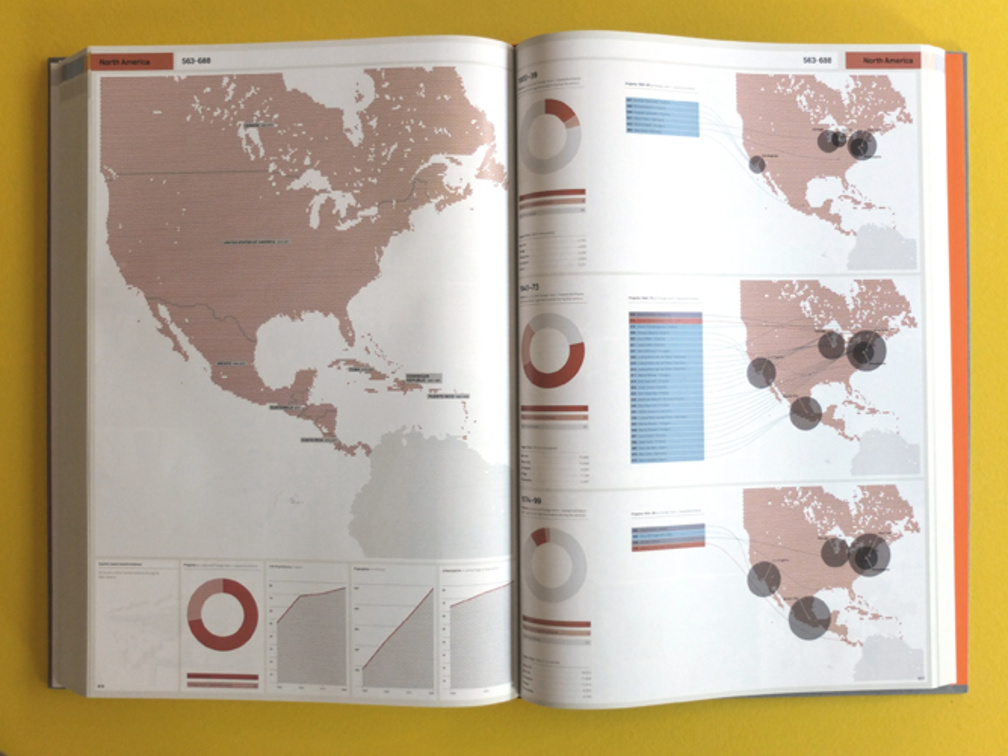
June 2015 – Maps and charts on new community sales in the US for BUILDER Magazine, Washington D.C. (US).
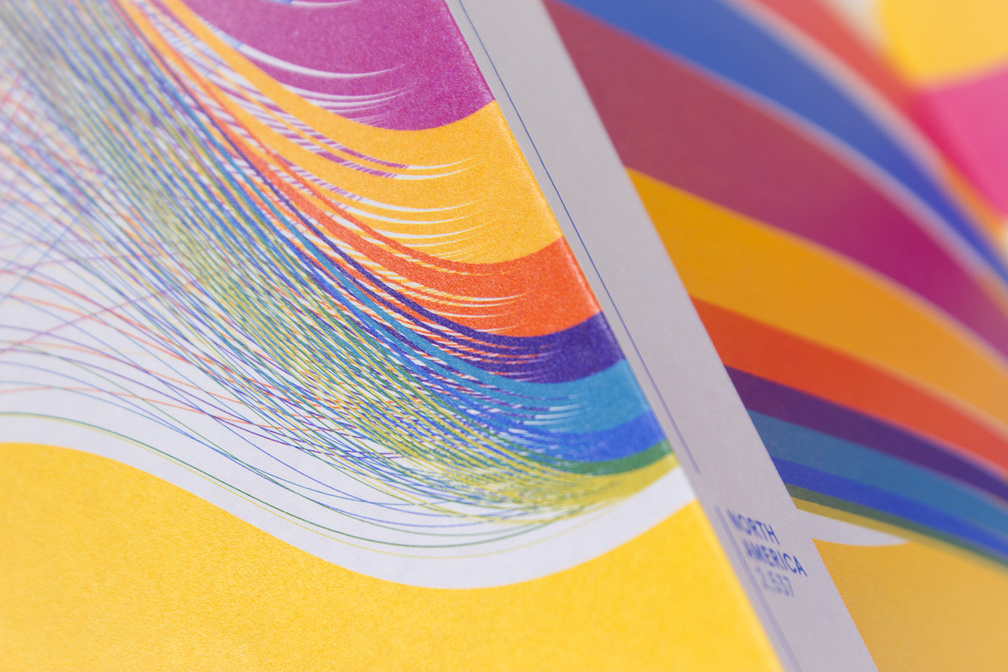
May 2015 – Annual report for DutchCulture, centre for international cooperation, Amsterdam (NL) visualising all 12,978 cultural activities of dutch artists around the globe in 2014. 12,614 activities took place in the top 50 countries and are split up by discipline, continent, country, city and traveller.
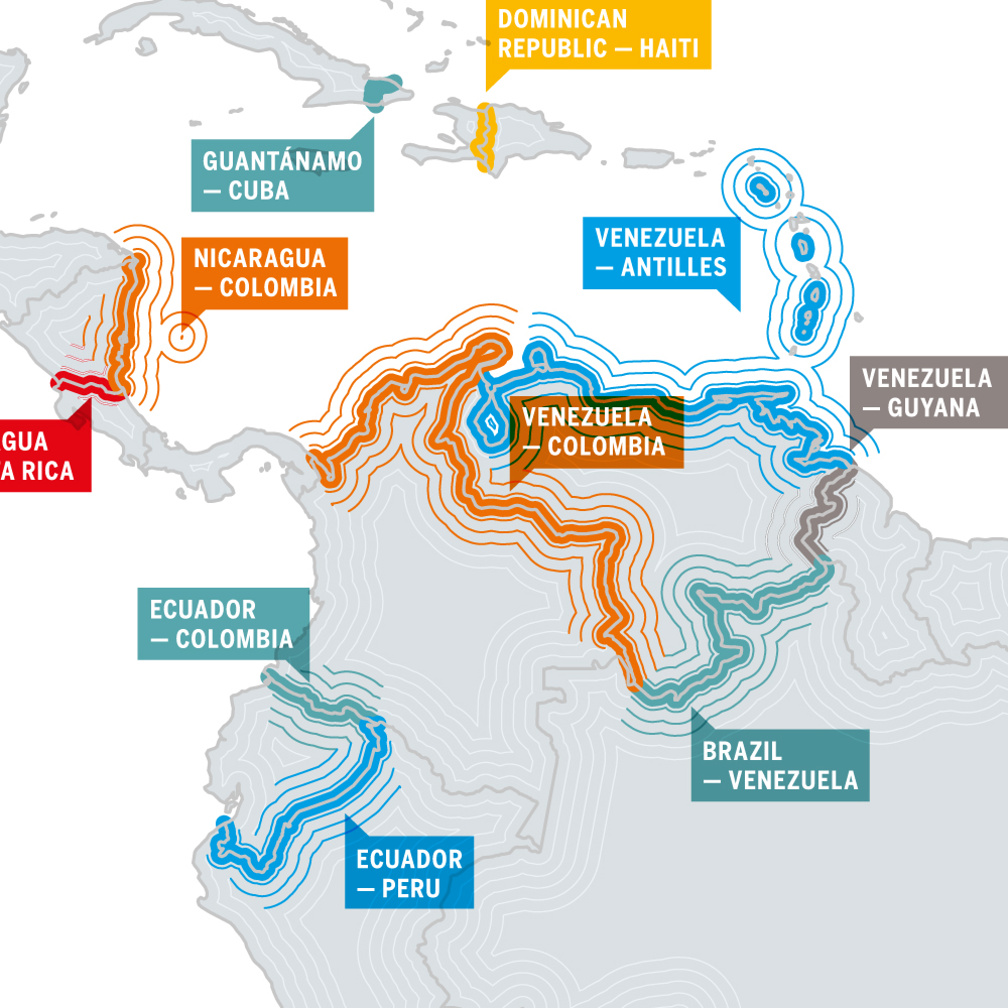
Hot or Not? Border Conflicts in the Americas
February 2015 – A map on border conflicts in The Americas for Americas Quarterly, North Hollywood (US).
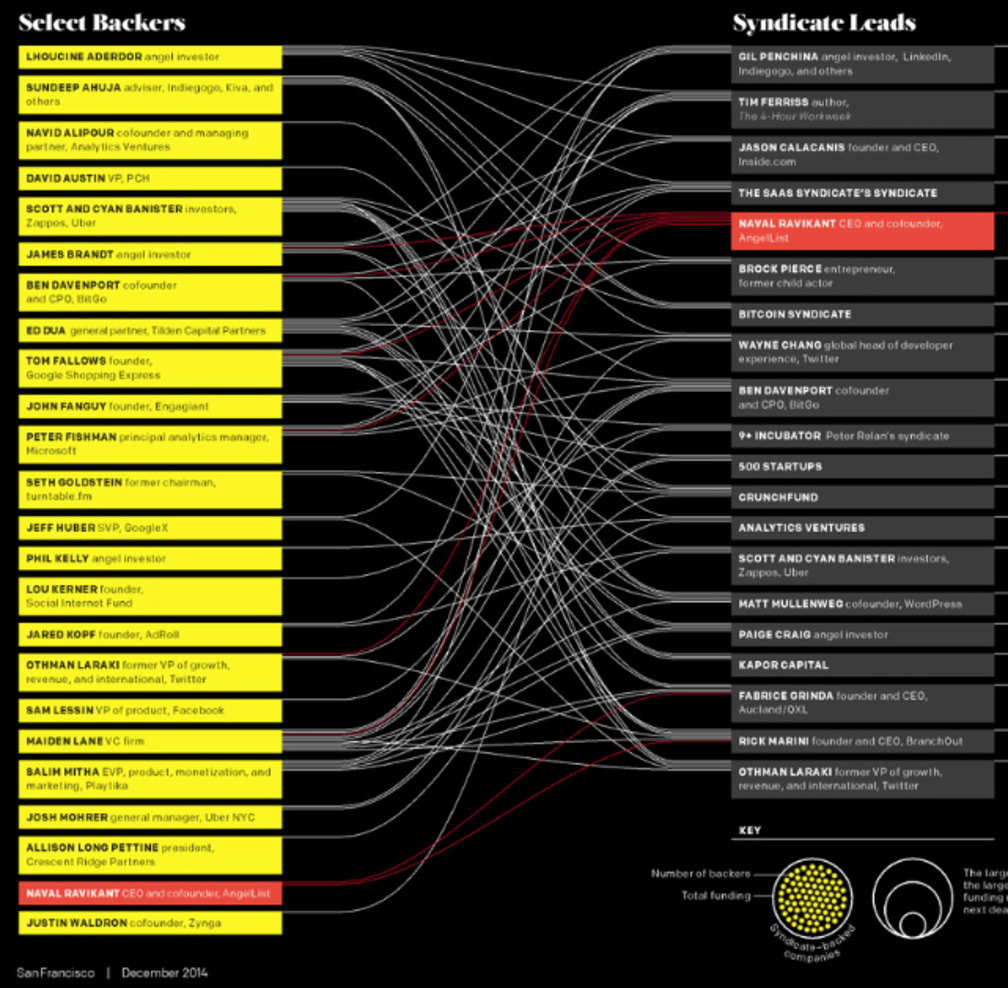
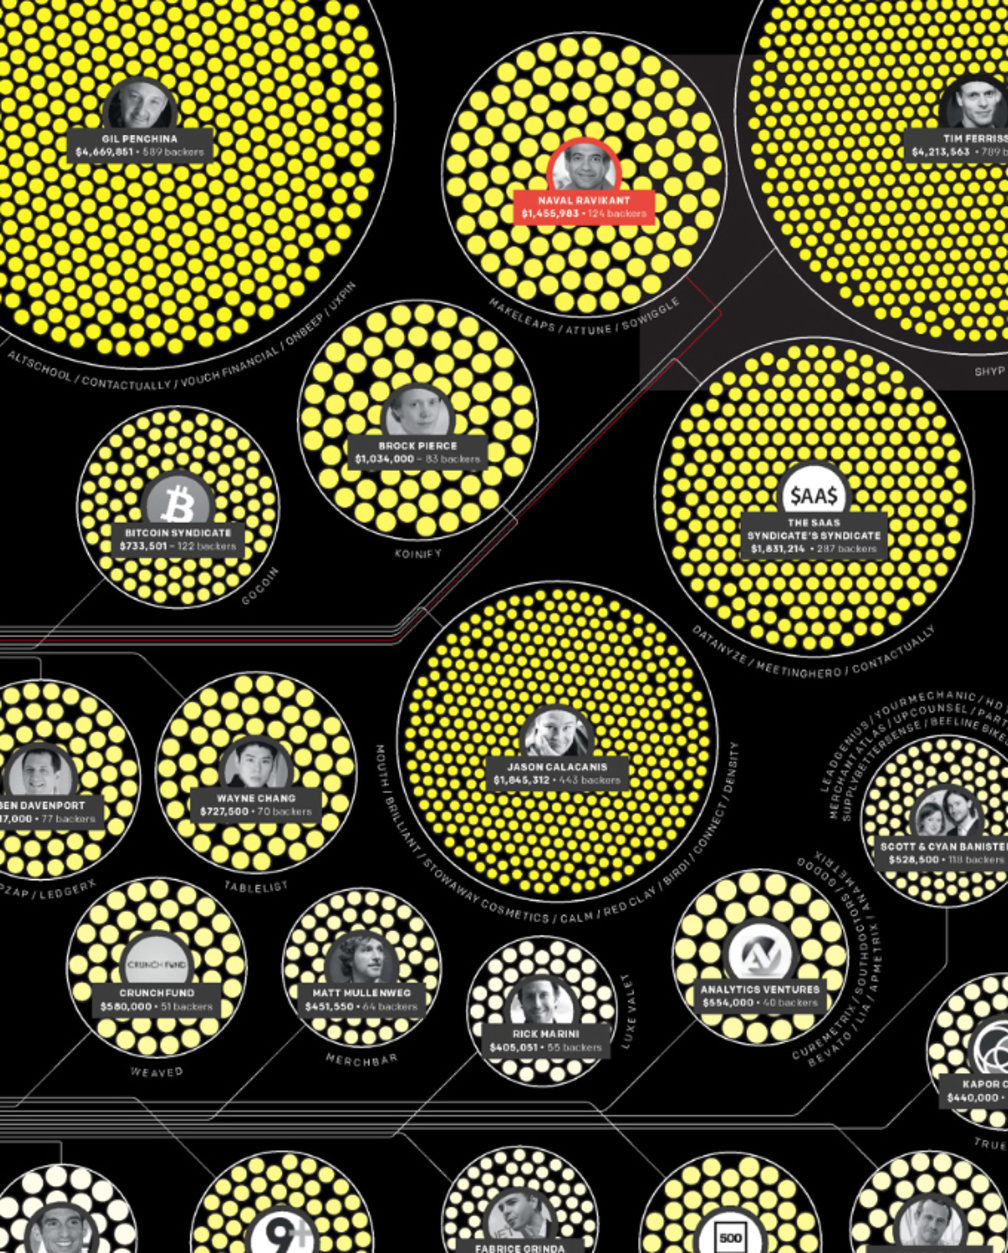
Silicon Valley Dart Club
December 2014 – Infographic for San Francisco Magazine showing the powerful syndicates on the crowdsourcing platform Angellist.
September 2014 – Programming and data visualisation for artist Rossella Biscotti's installation at Museum Haus Esters in Krefeld, Germany. Installation view Museum Haus Esters 2014, © Kunstmuseen Krefeld, photos: Volker Döhne

July 2014 – Book Design of 'Landscape and Energy' for HNS landscape architects – a book about the effects of the transition from fossil fuels to renewable energy on our environment.
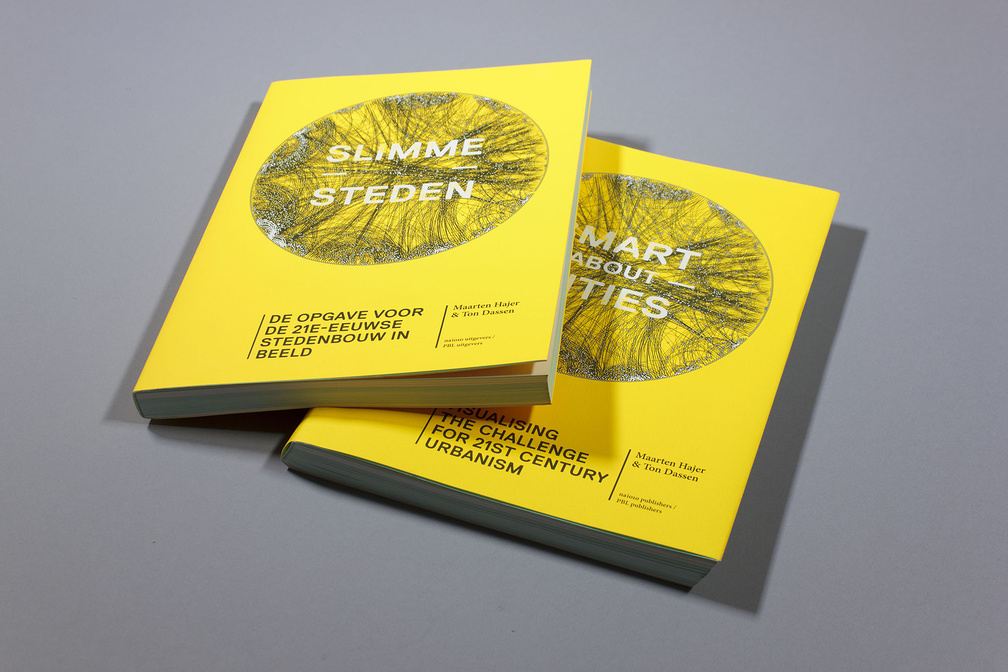
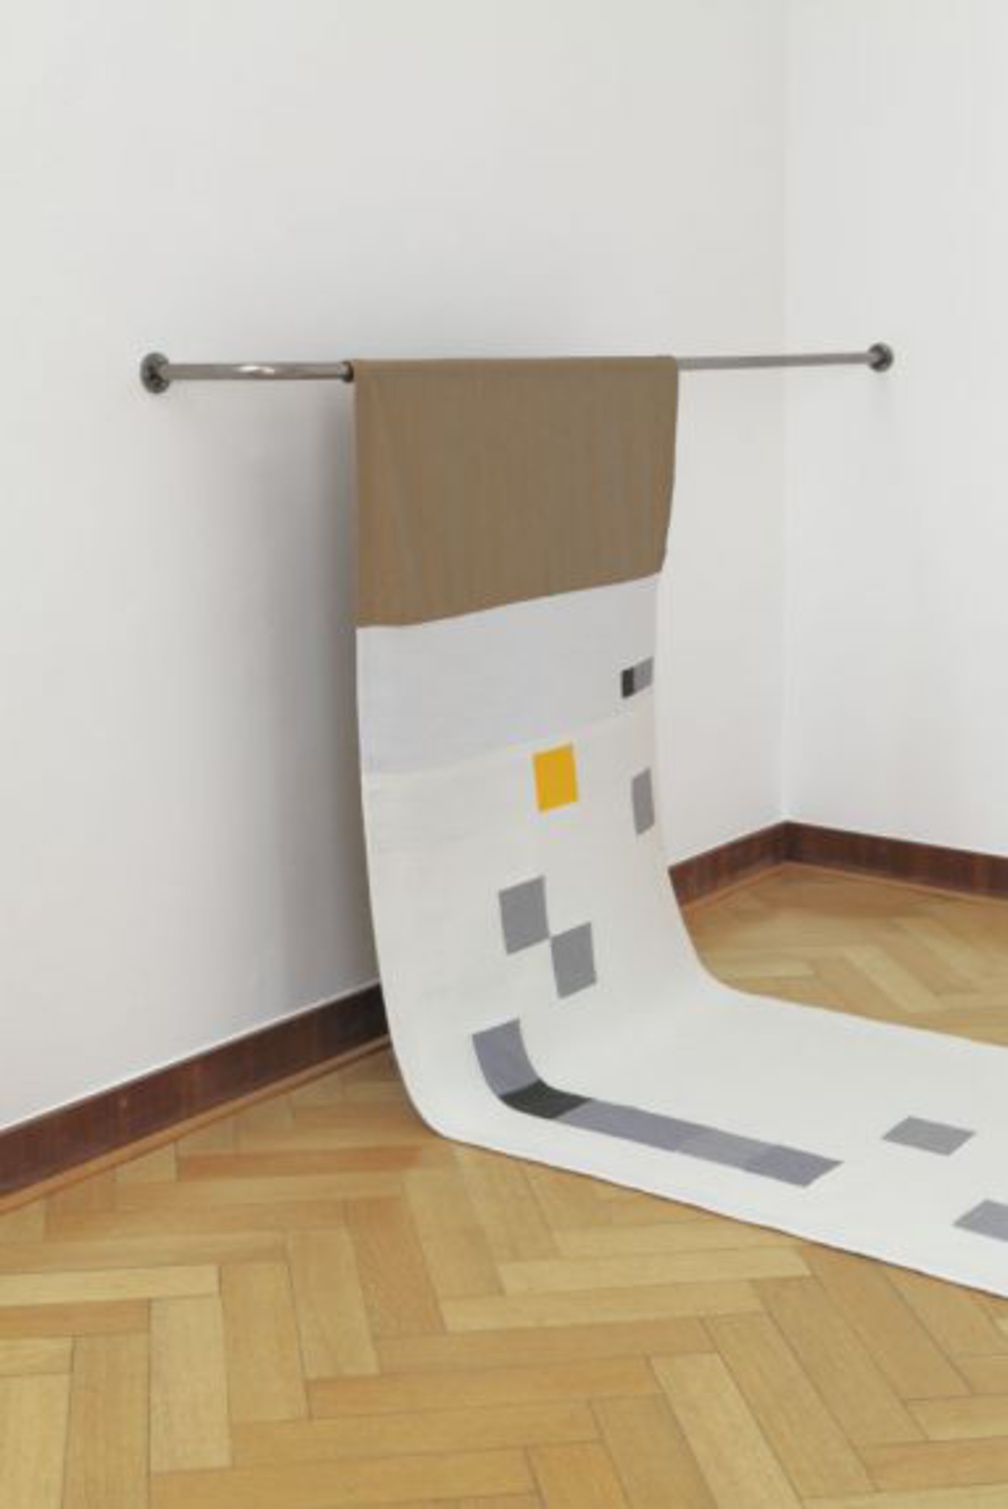
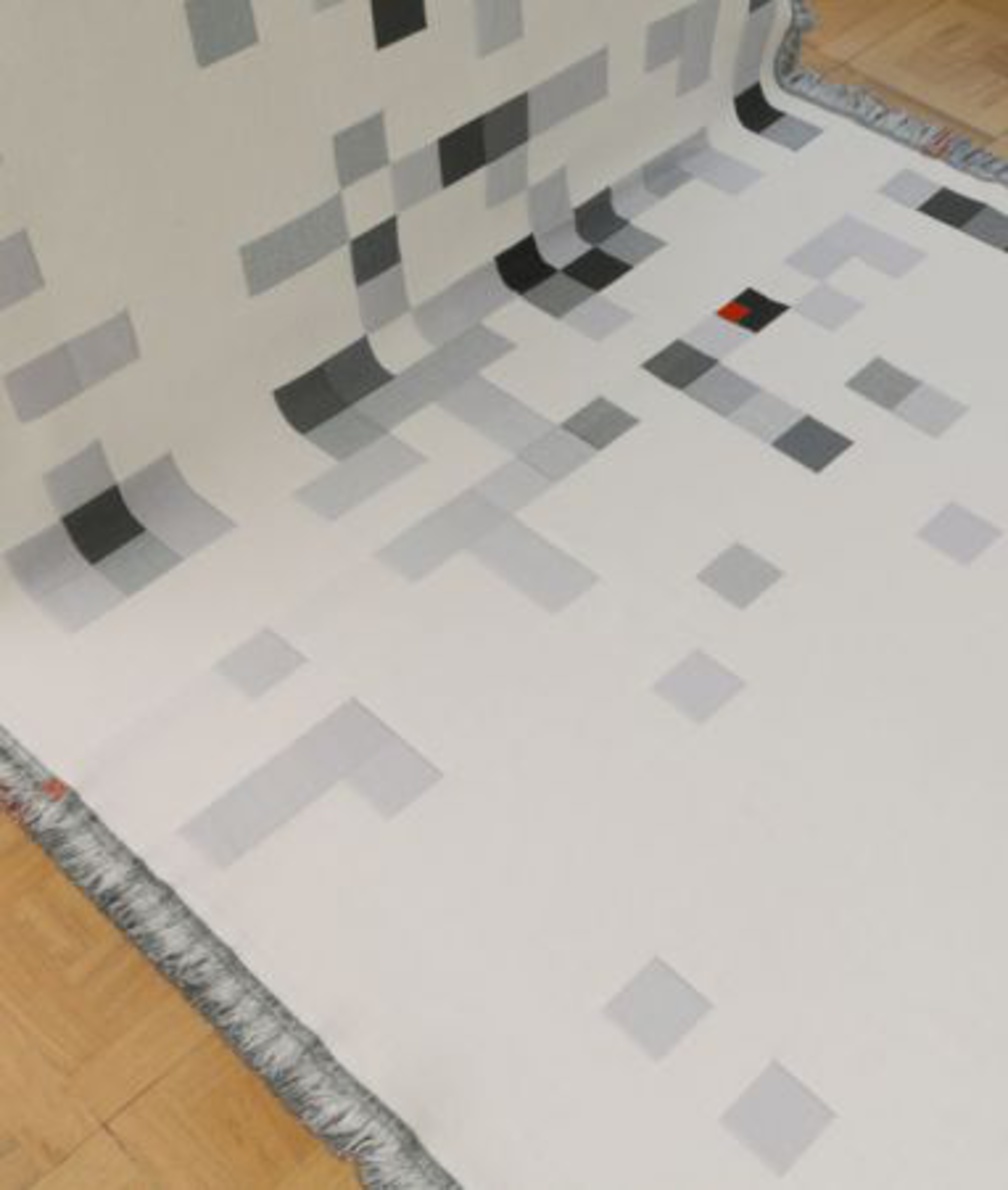
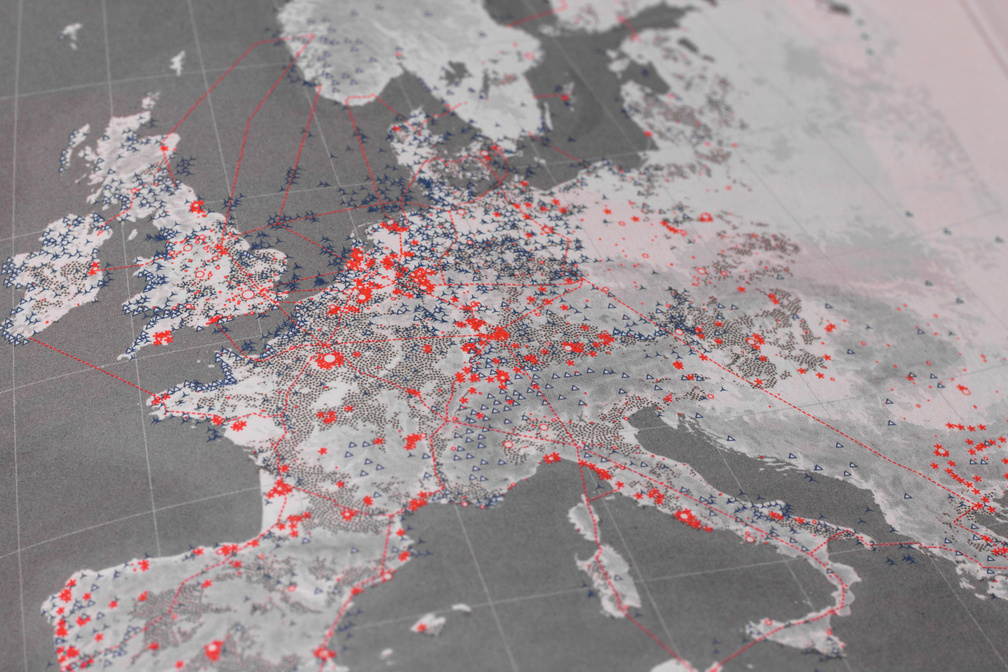
June 2014 – Book Design and Infographics for 'Smart about Cities' commissioned by PBL Netherlands Environmental Assessment Agency.
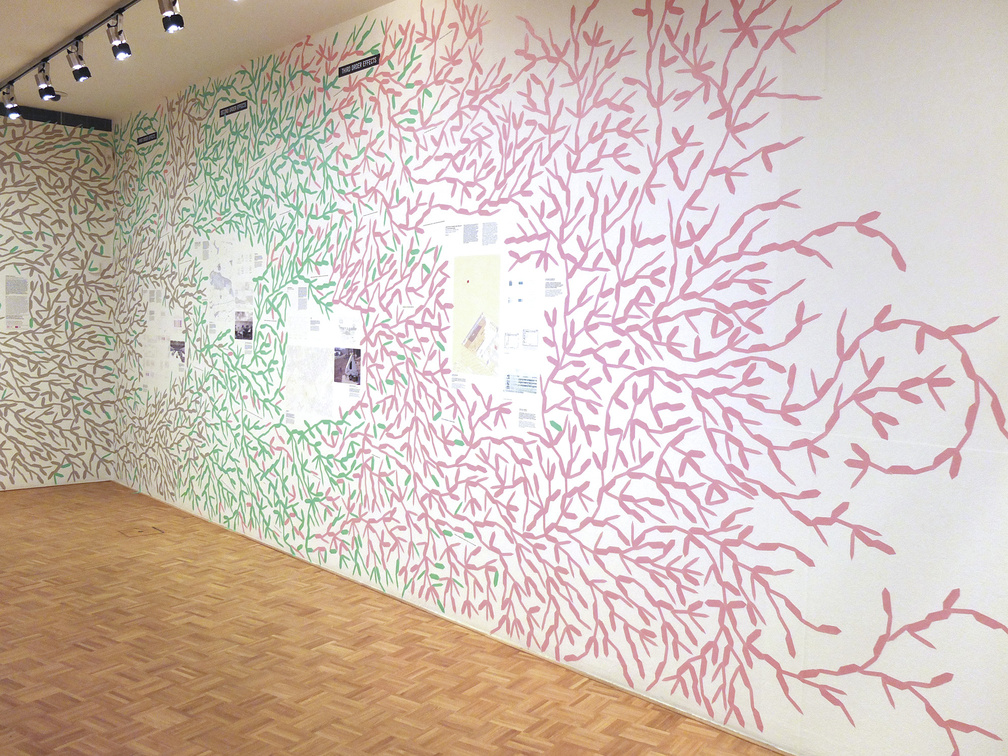
May 2014 – Infographic and illustration for the CAT (Carbon Added Tax) walls at the International Architecture Biennale Rotterdam 2014 consisting of about 9000 preprinted stickers in three different colors.
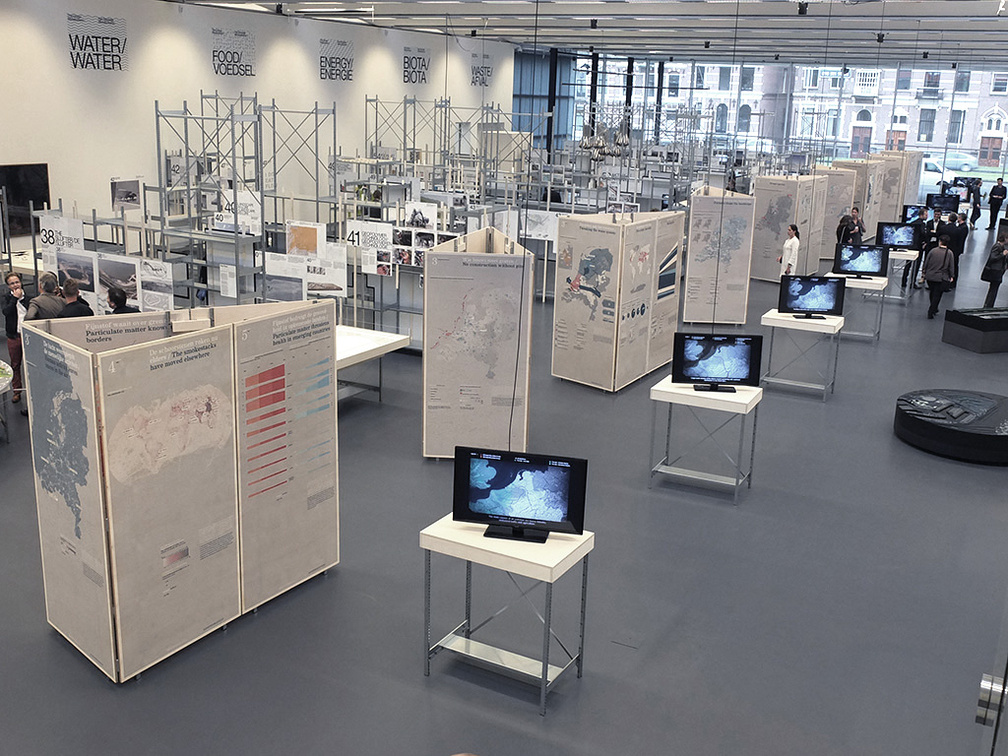
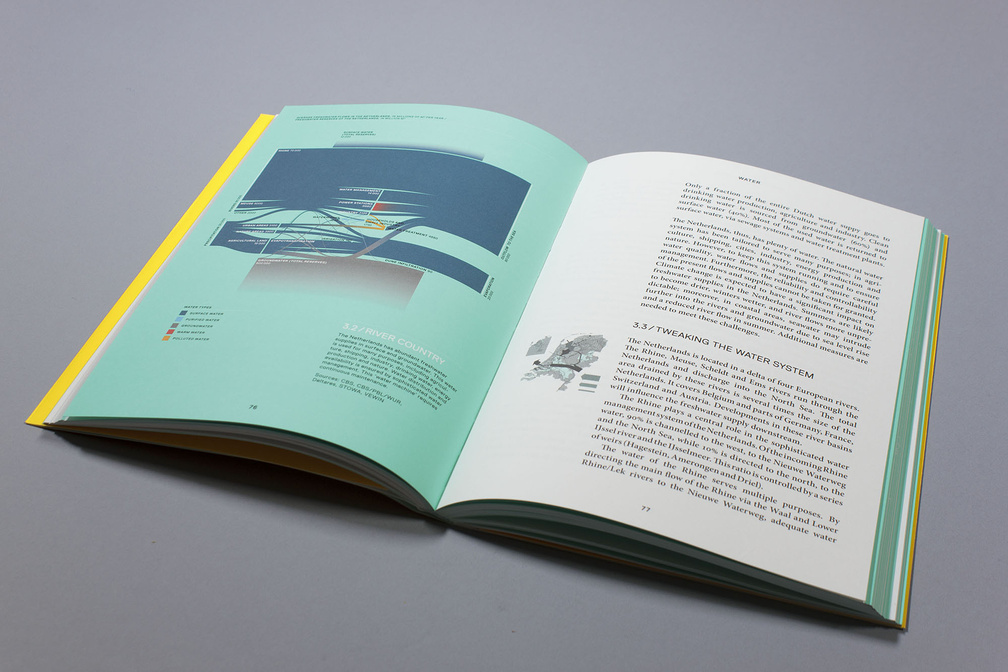
May 2014 – 45 large scale Infographics for IABR–2014–Urban by Nature, the International Architecture Biennale Rotterdam.
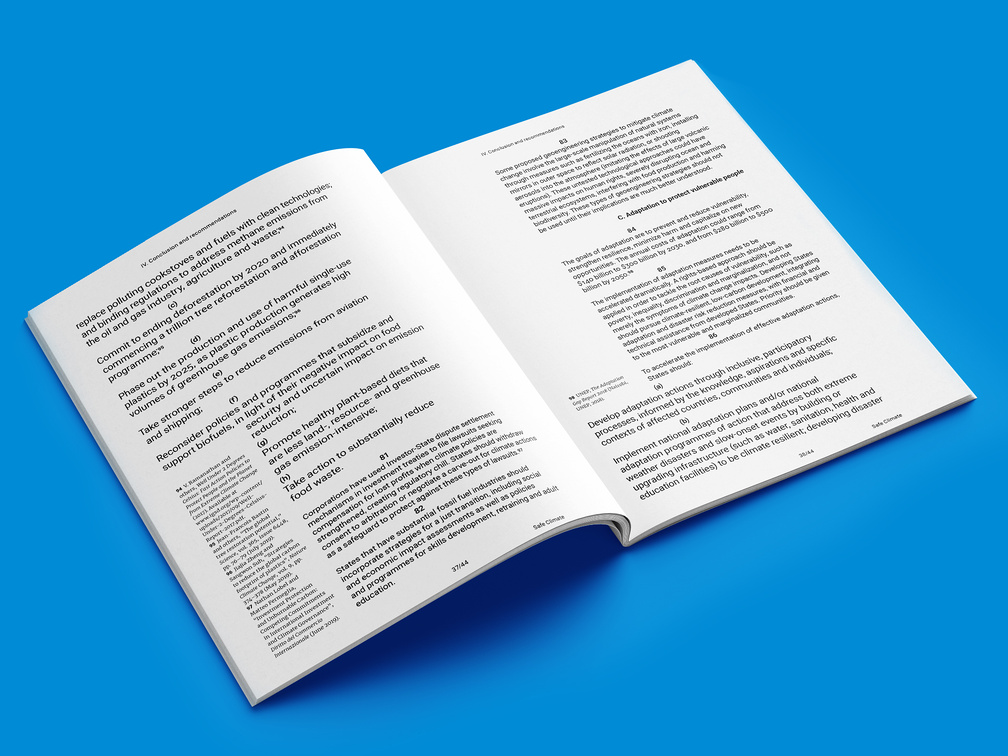
October 2013 – Infographics for the book 'The World We Made' by Jonathon Porritt which is written from the viewpoint of a fictional history teacher in 2050.
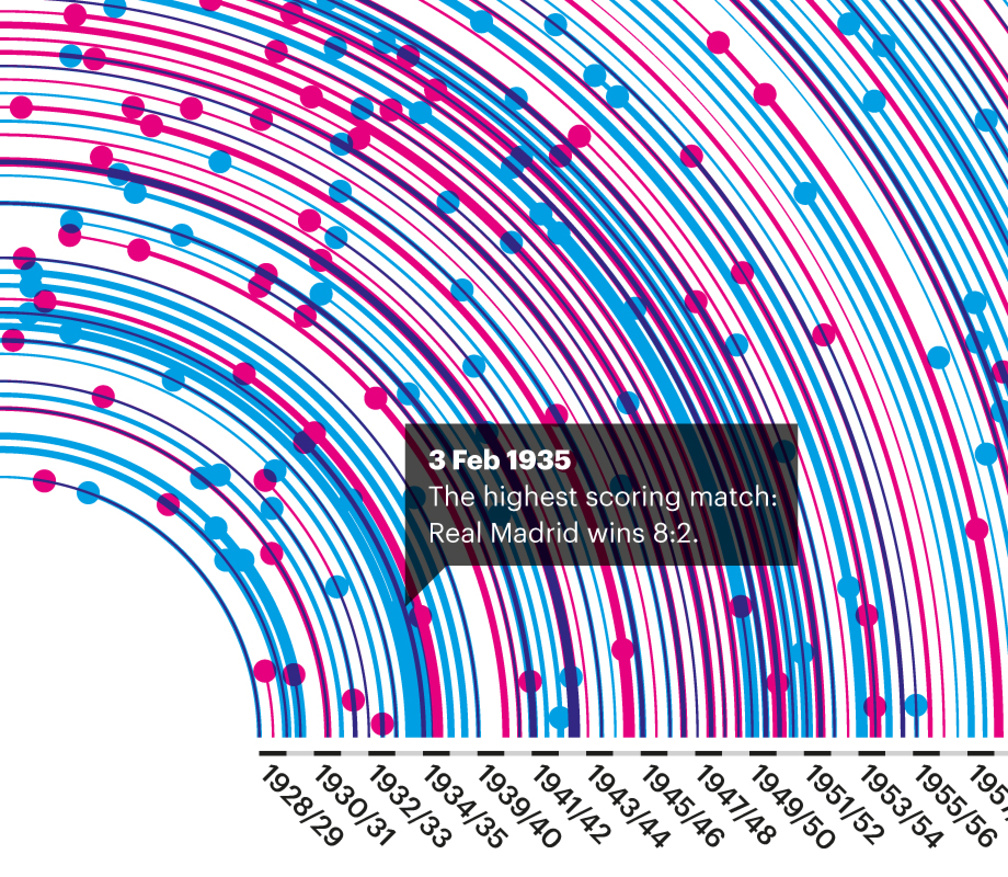
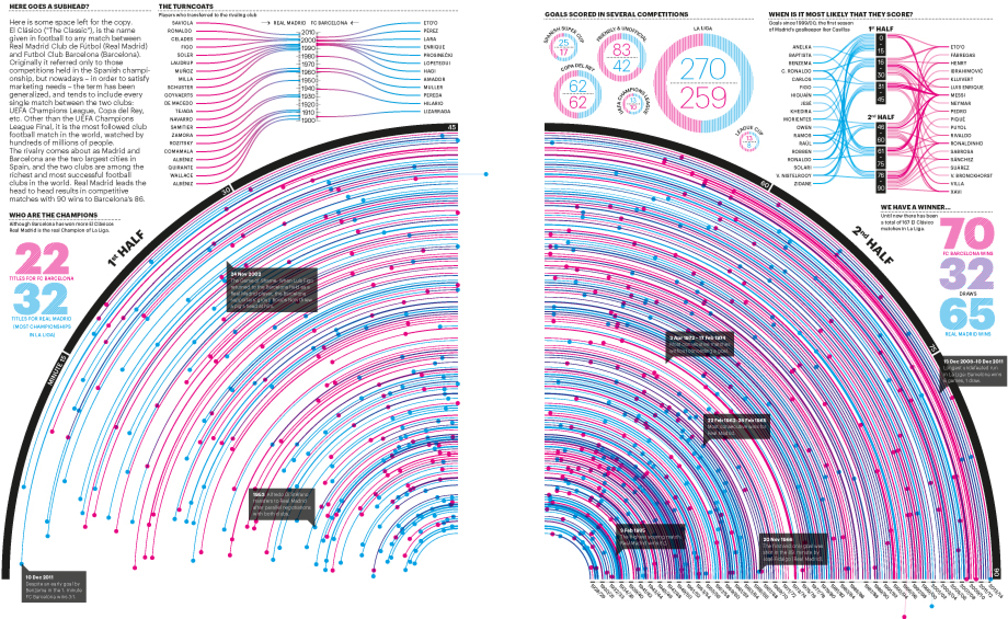
El Clásico
October 2013 – Infographics about the rivalry between Real Madrid C.F. and FC Barcelona for 8x8, a football magazine from the US. The main graphic shows all 166 'El Clásico' matches in the Spanish football league until 2013.
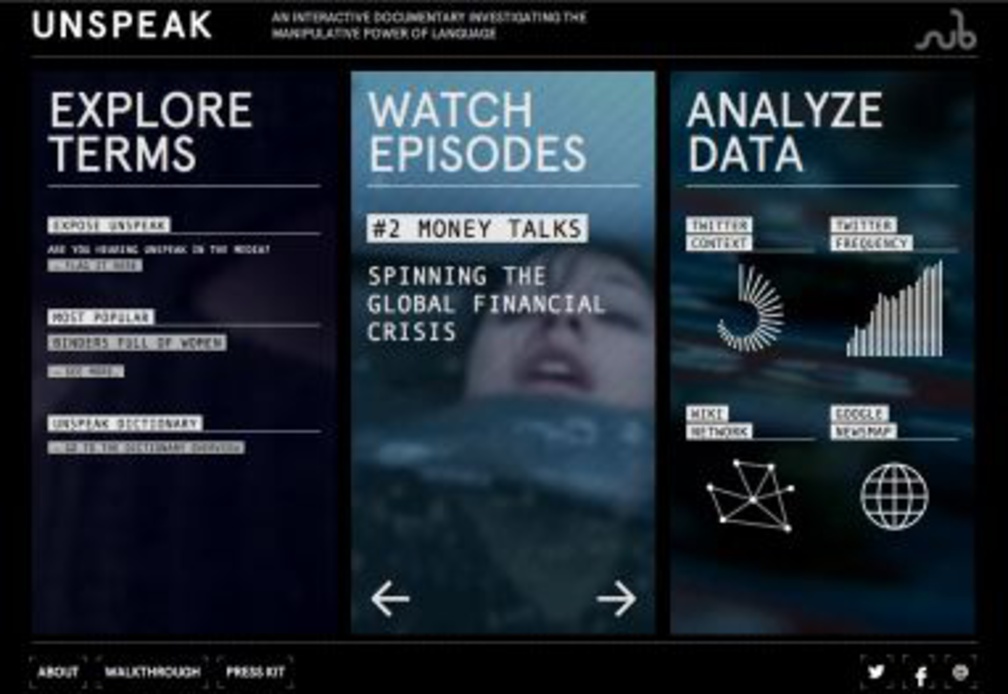
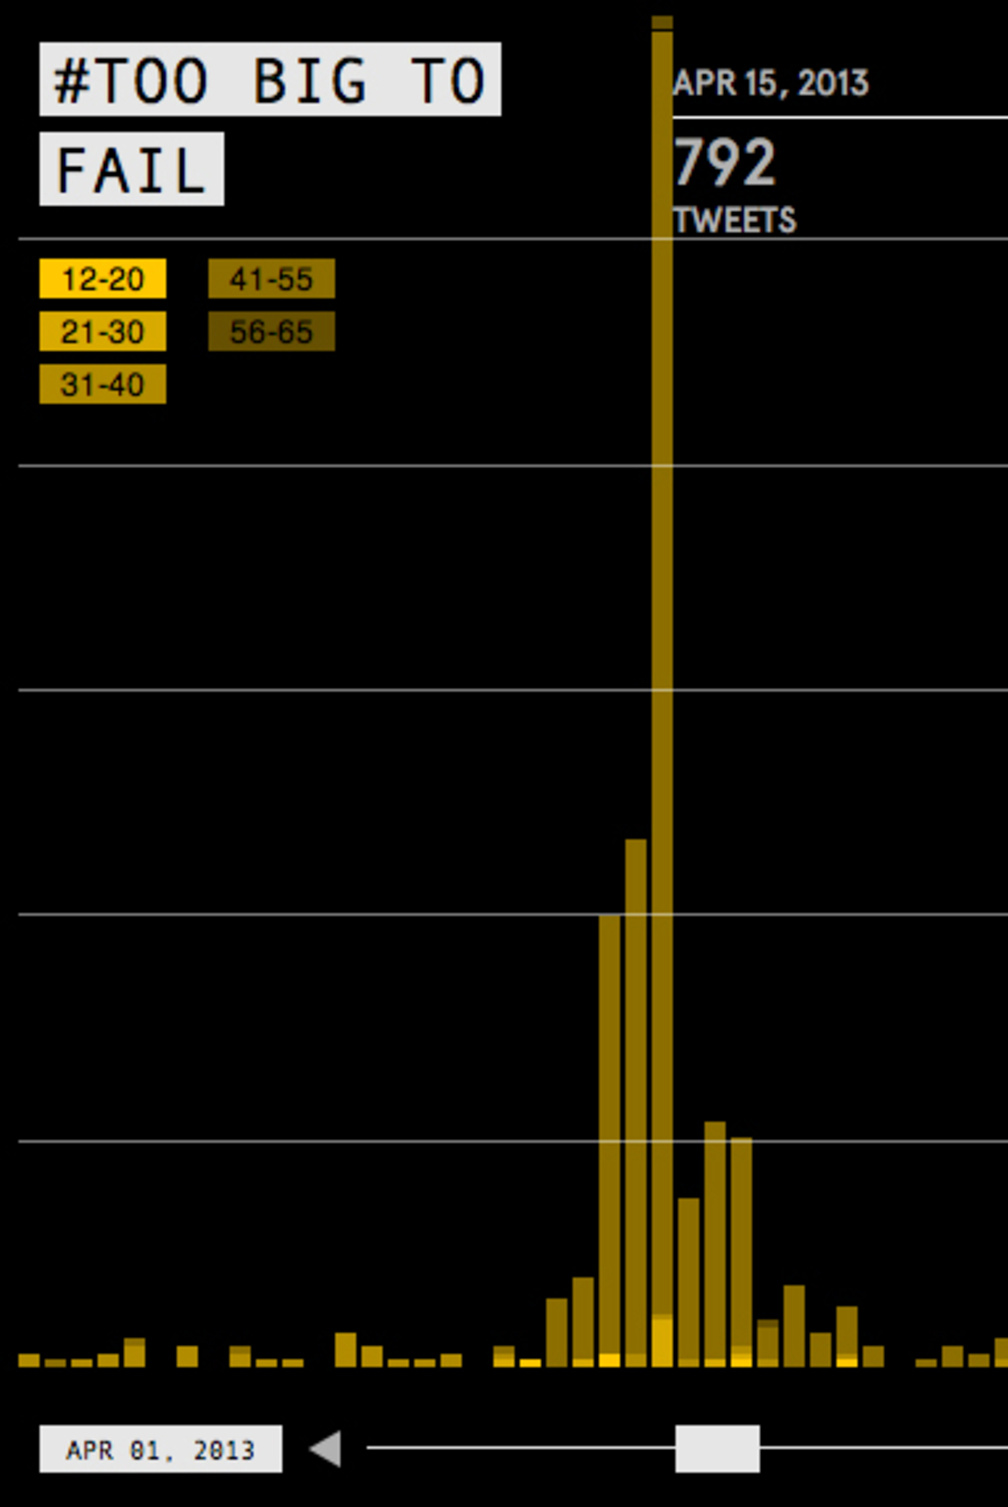
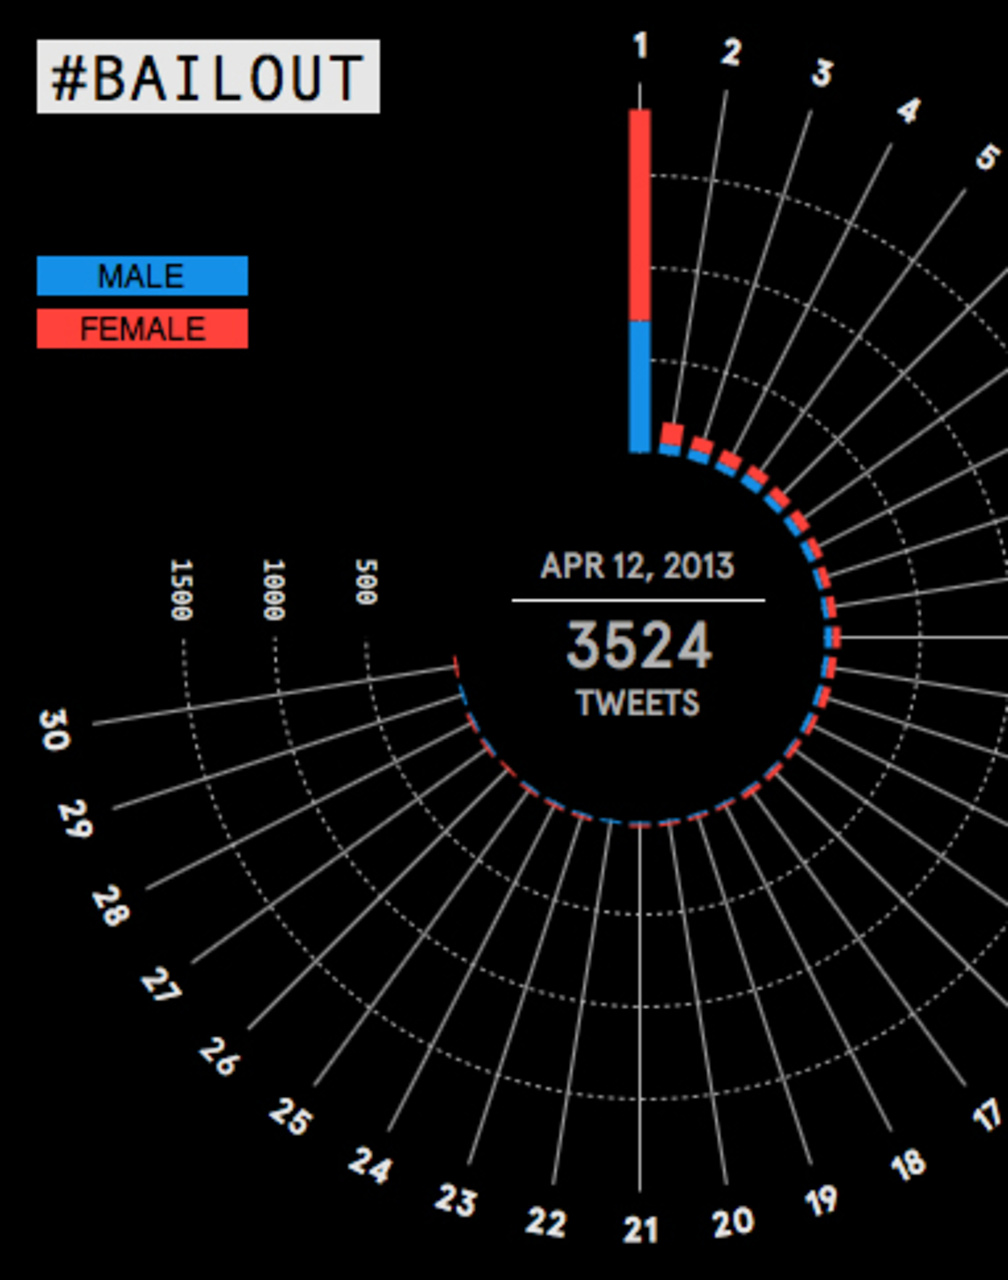
UNSPEAK
July 2013 – 'UNSPEAK' is a web-based interactive documentary investigating the manipulative power of language, based on the book by Steven Poole. A dictionary, datavisualizations and short films made by different directors reveal the unspoken messages and obscured meanings behind familiar media terms such as Weapons of Mass Destruction or Binders Full of Women. In collaboration with Submarine , Systemantics .
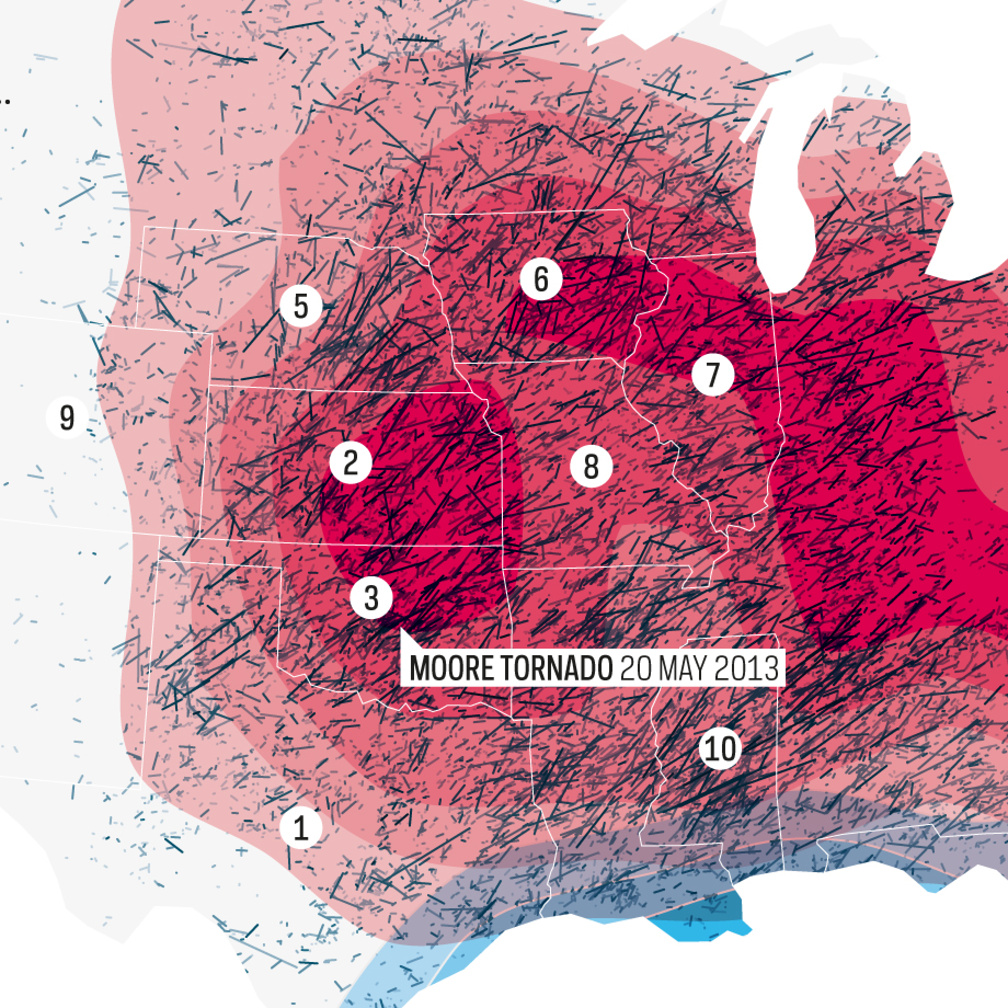
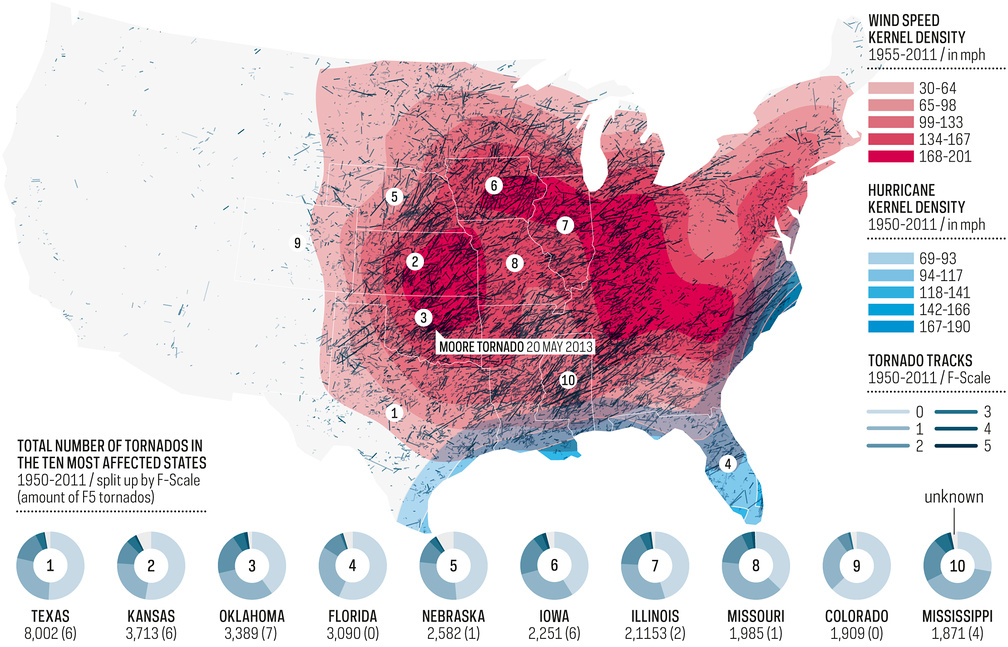
Disaster Strikes
June 2013 – Map for BUILDER Magazine, Washington D.C. (US) showing severe weather in the US over the past 50 years: Tornado Tracks, Kernel Wind and Hurricane Density.
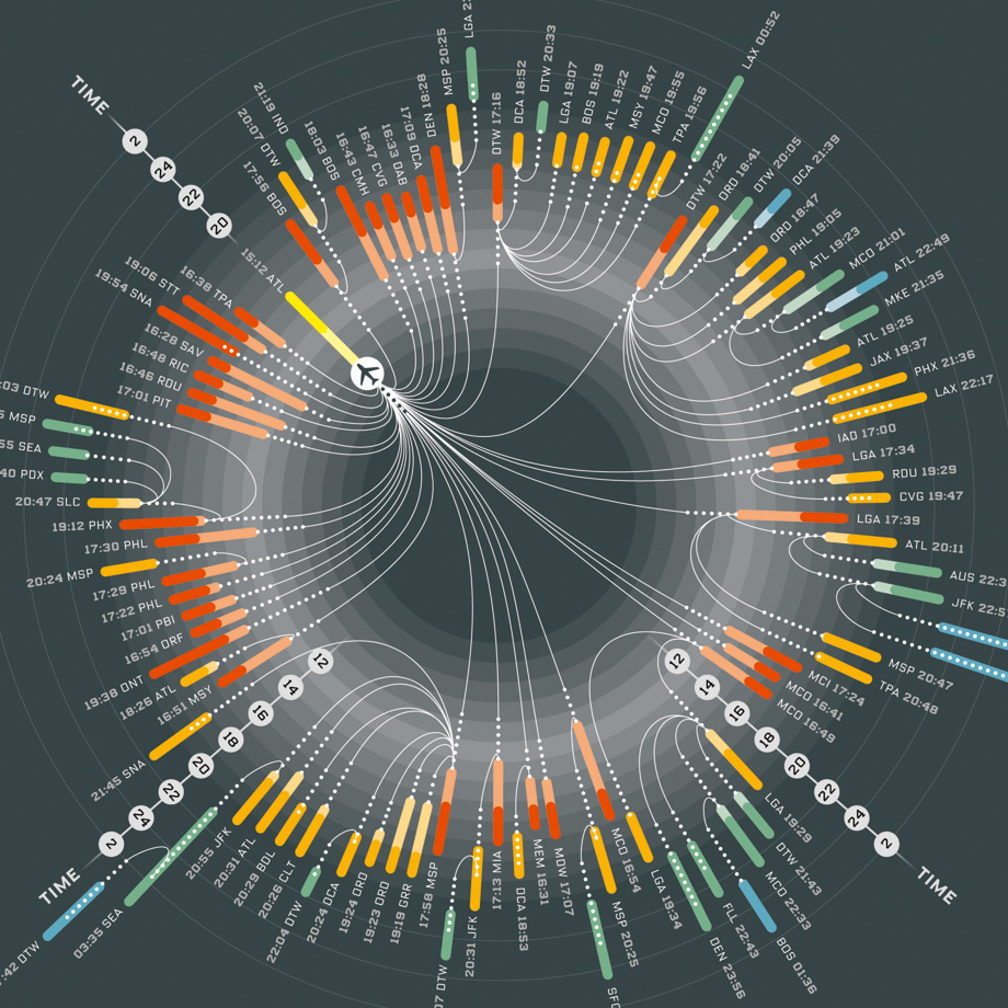
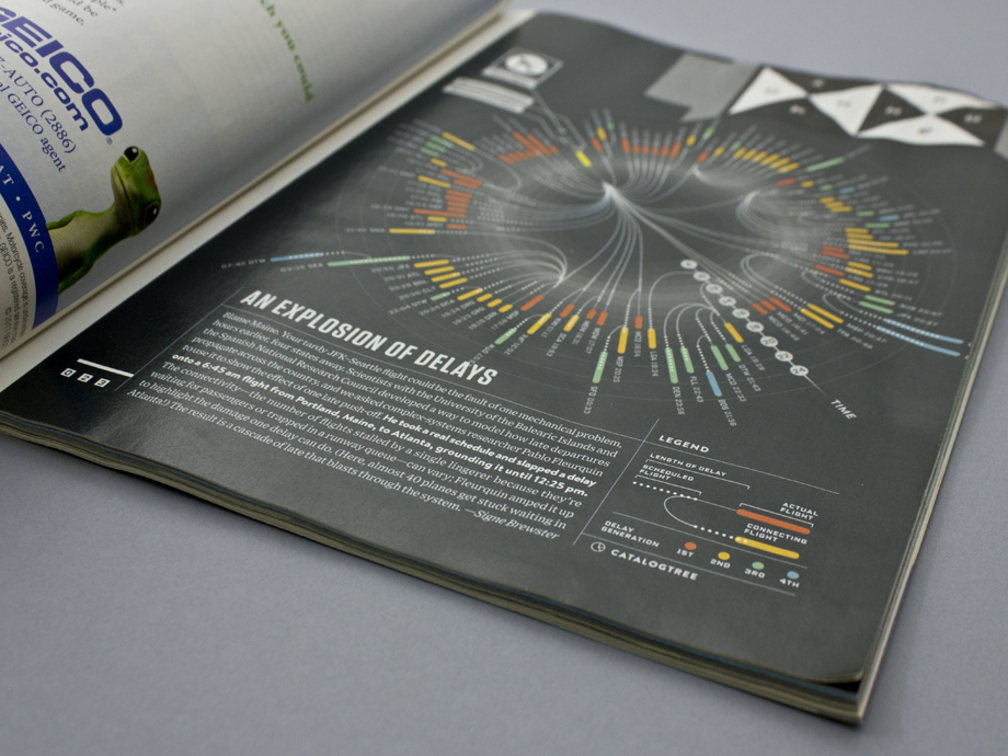
An explosion of delays
June 2013 – Infographic for WIRED magazine showing an explosion of delays caused by one delayed seed flight.
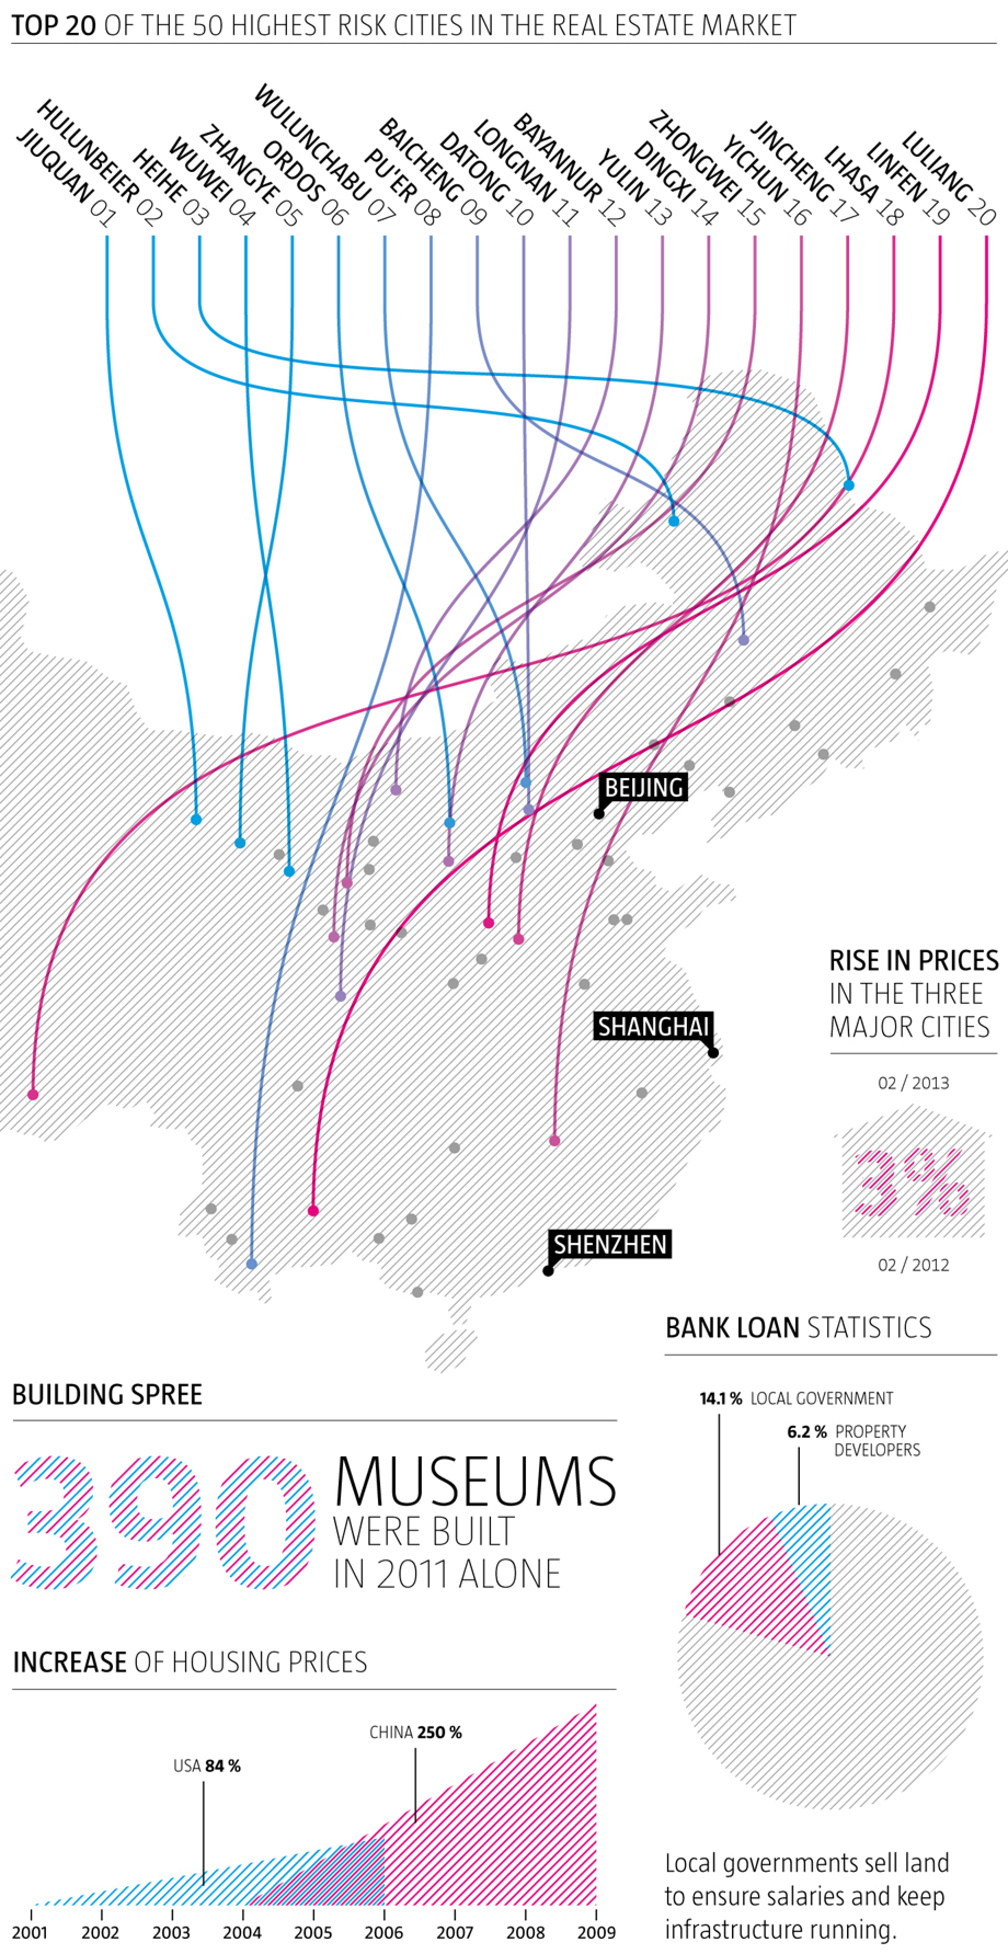
Is China's Real Estate Bubble About to Burst?
June 2013 – Map and infographics for Architect Magazine, Washington D.C. (US).
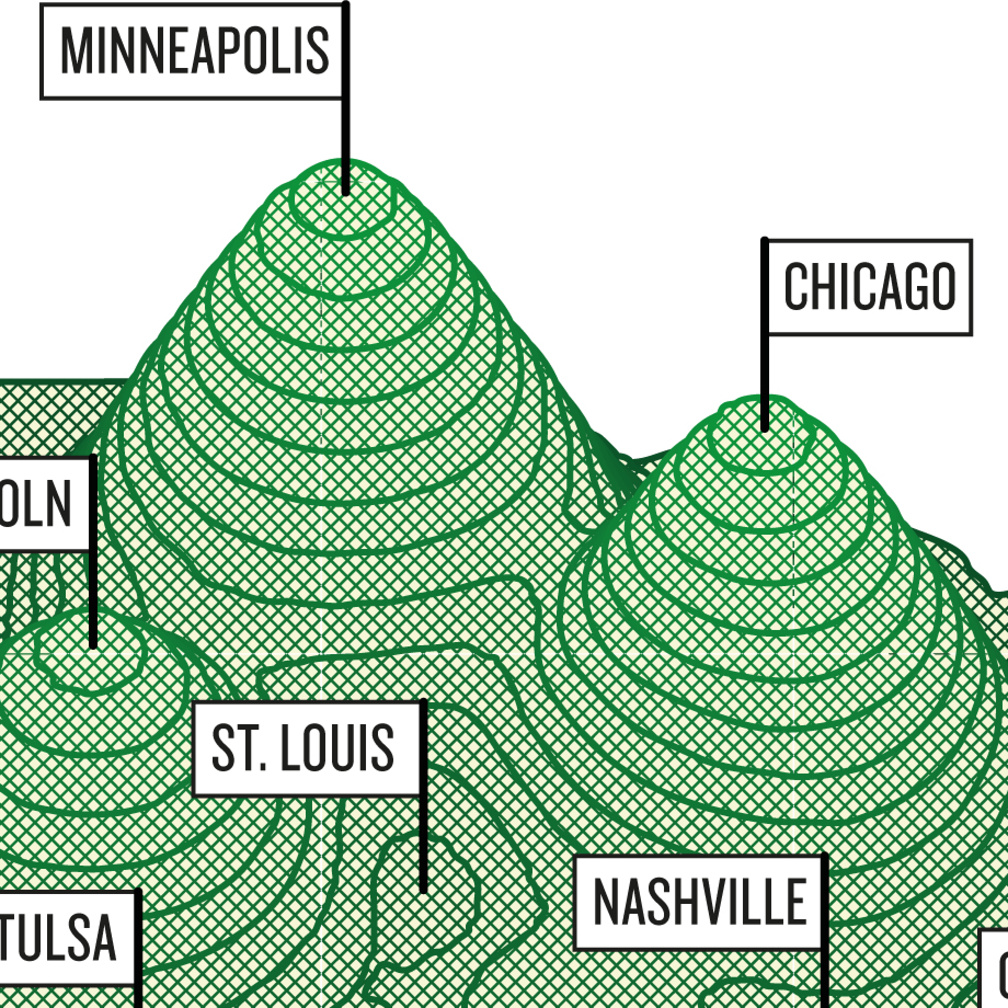
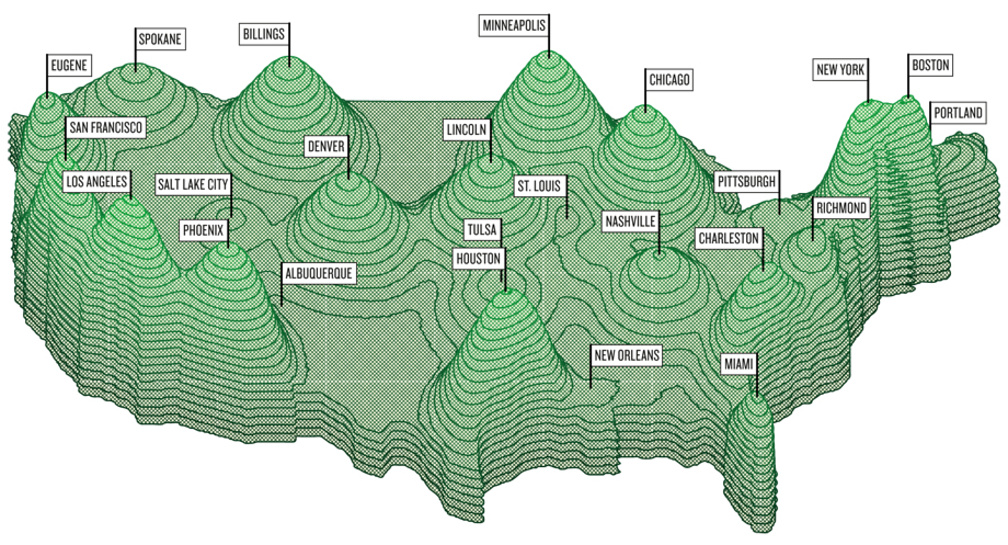
How Much Do You Have to Make to Be Successful?
May 2013 – Illustration for ESQUIRE magazine, New York (US). The map shows how much a family of four need to have to live very well in 24 cities of the US.
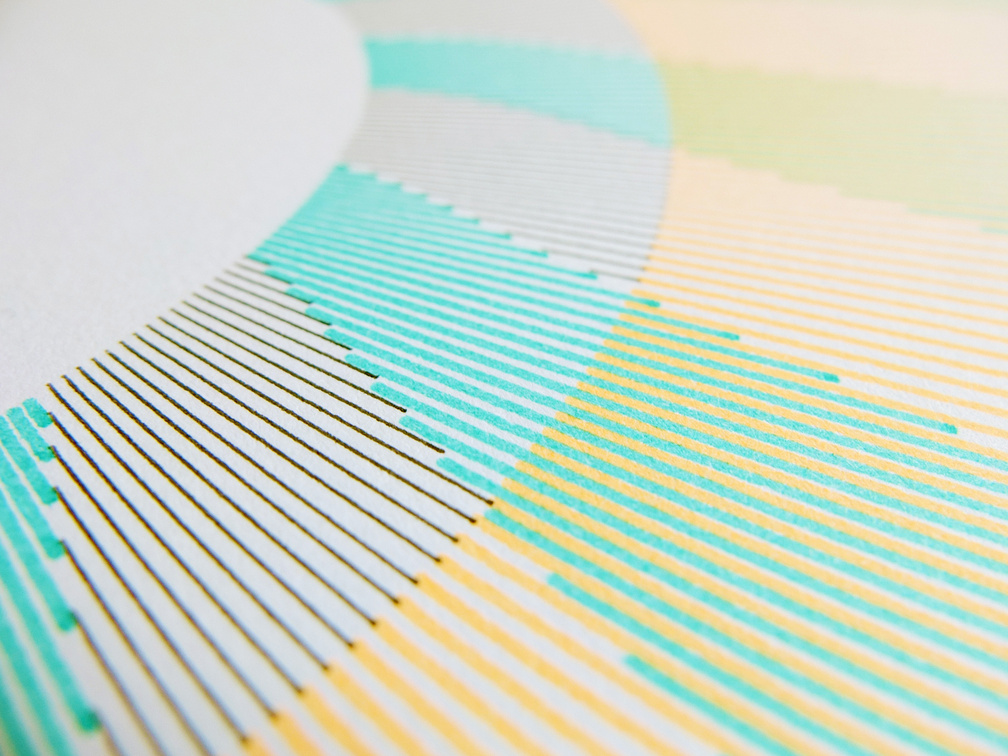
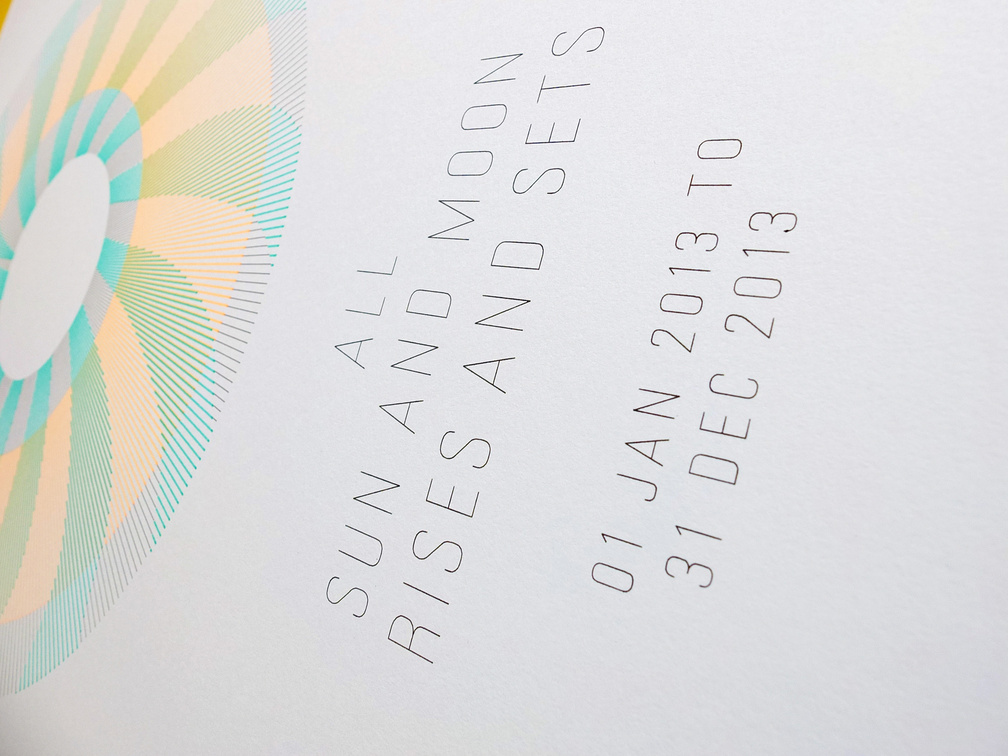
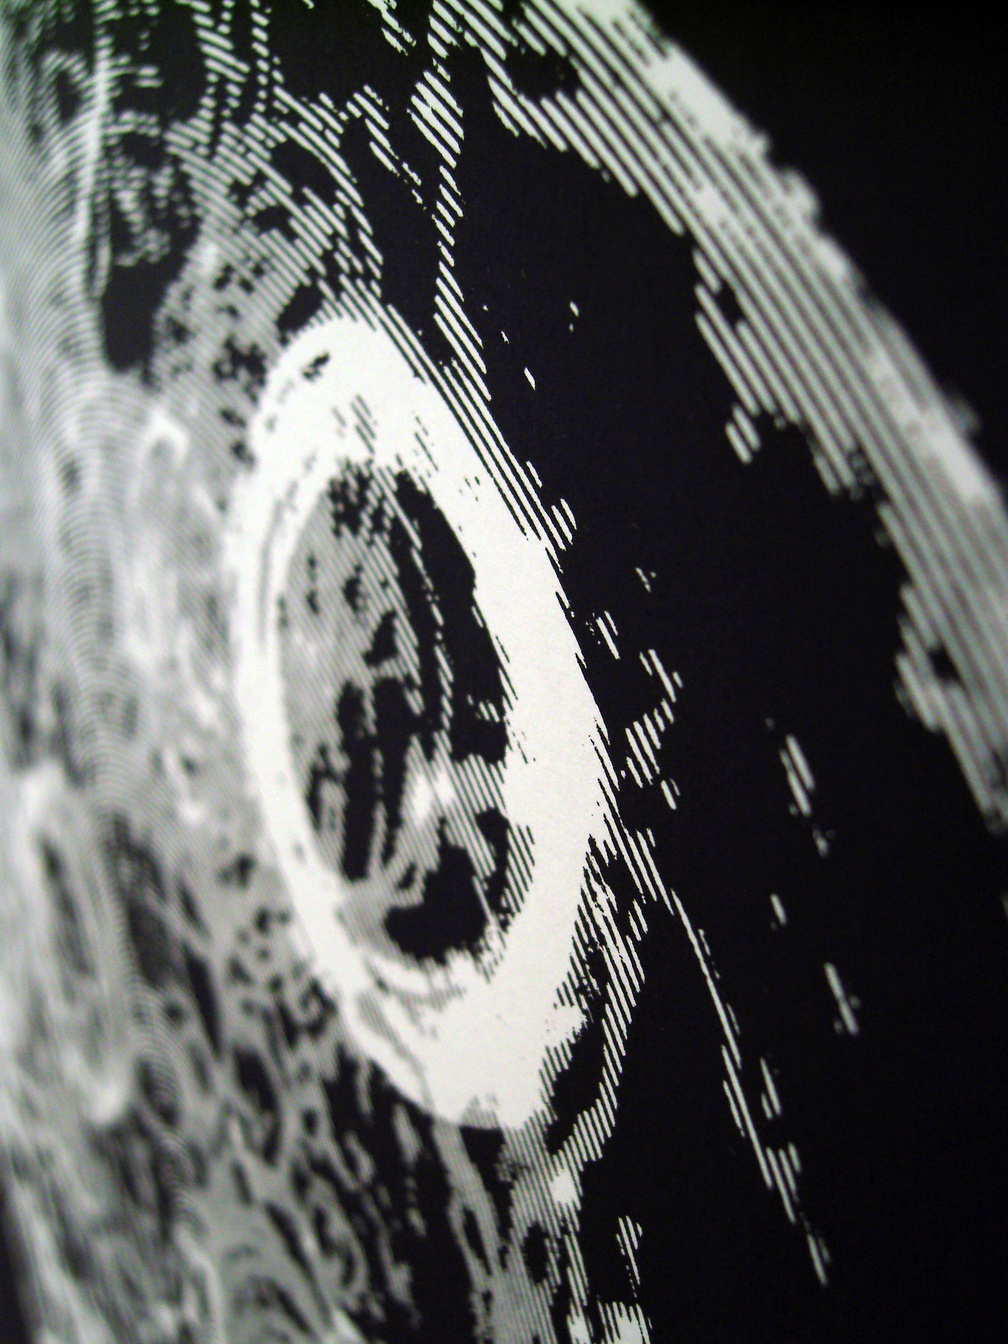
Sun & Moon
May 2013 – Periods of sun and moonlight for all days of 2013 (pen plot).
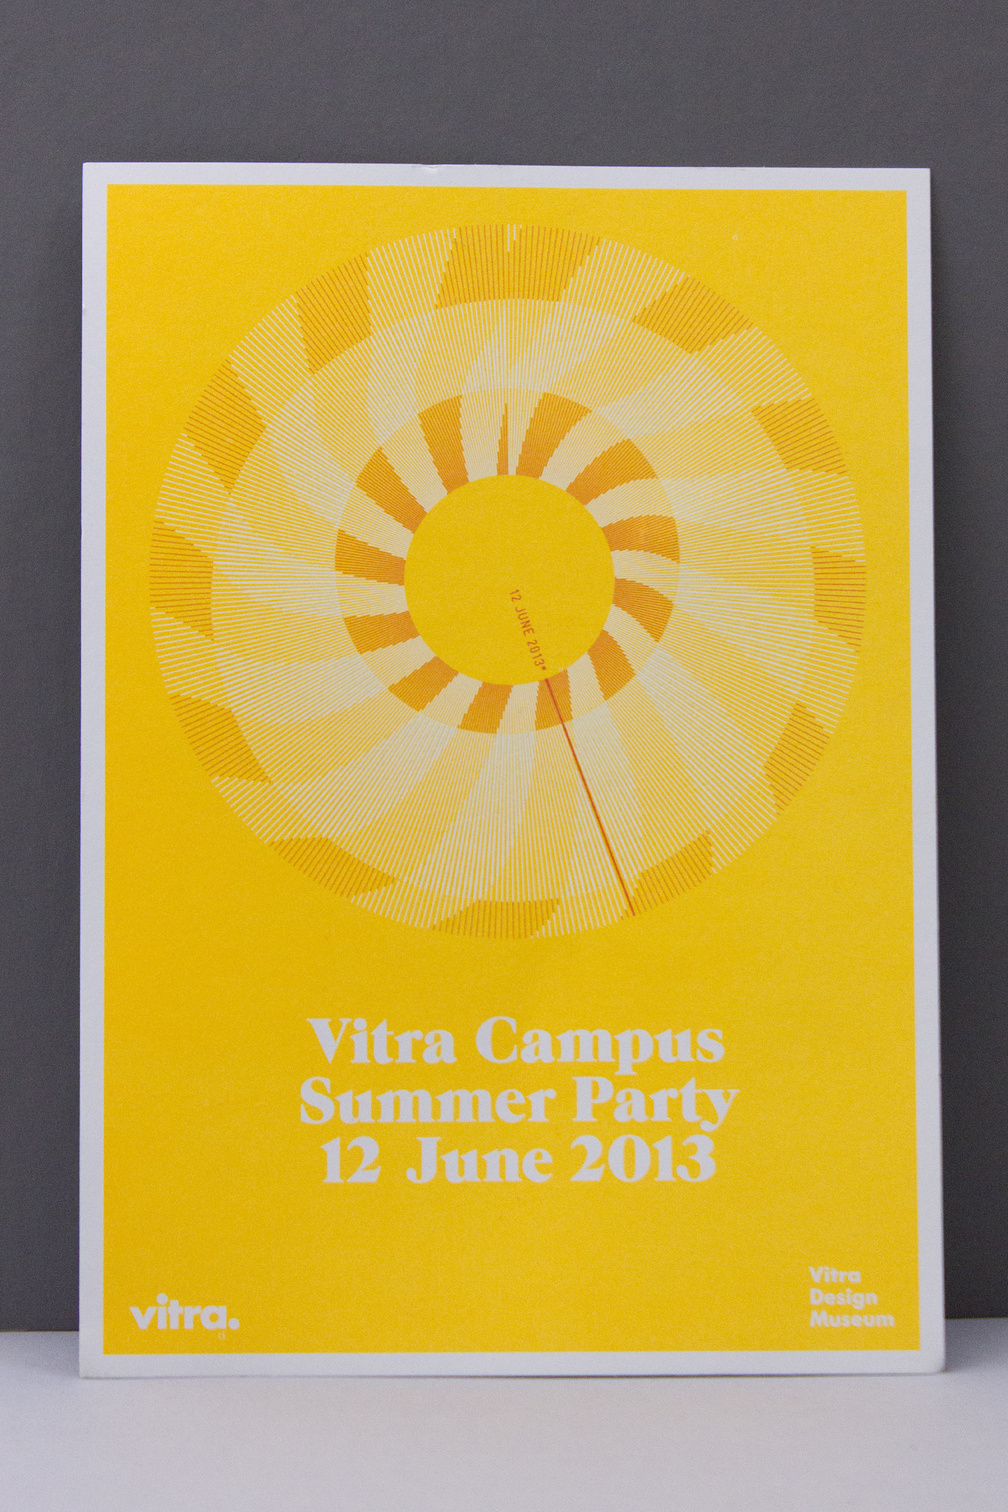

Vitra Campus Summer Party 2013
April 2013 – Invitation for the VITRA CAMPUS SUMMER PARTY. It shows the periods of sun and moonlight for all days of 2013 at the Vitra Campus, Weil am Rhein (DE). Periods of sun and moonlight are embossed by thermography printing.
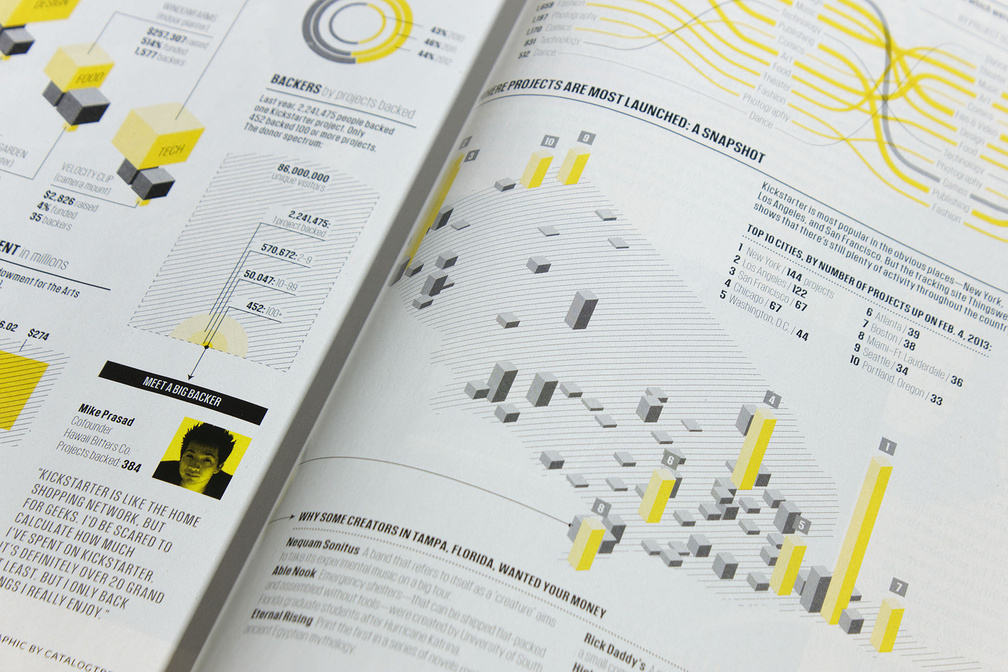
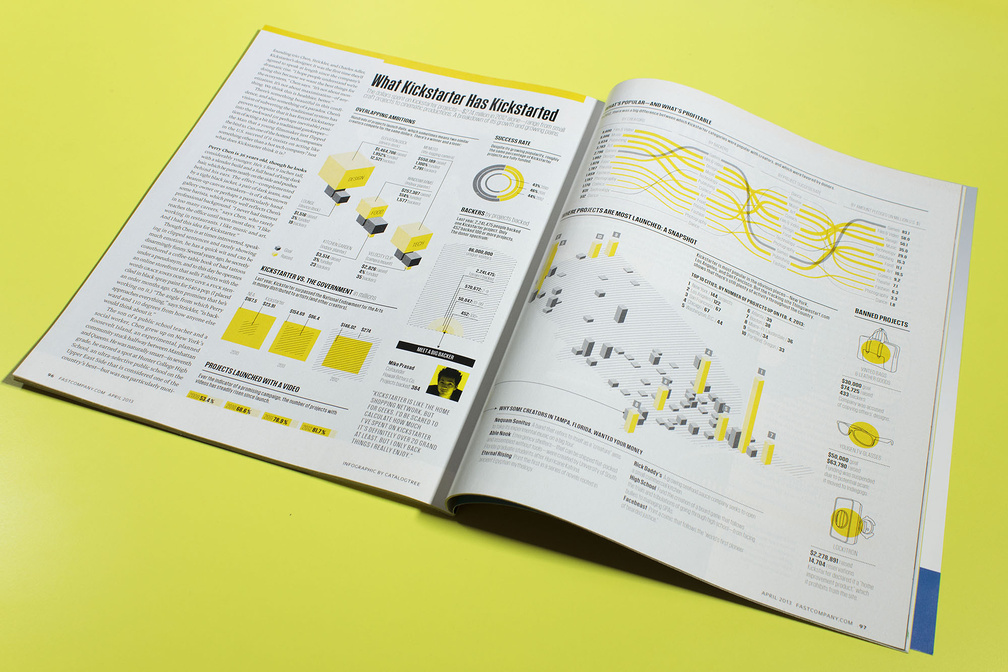
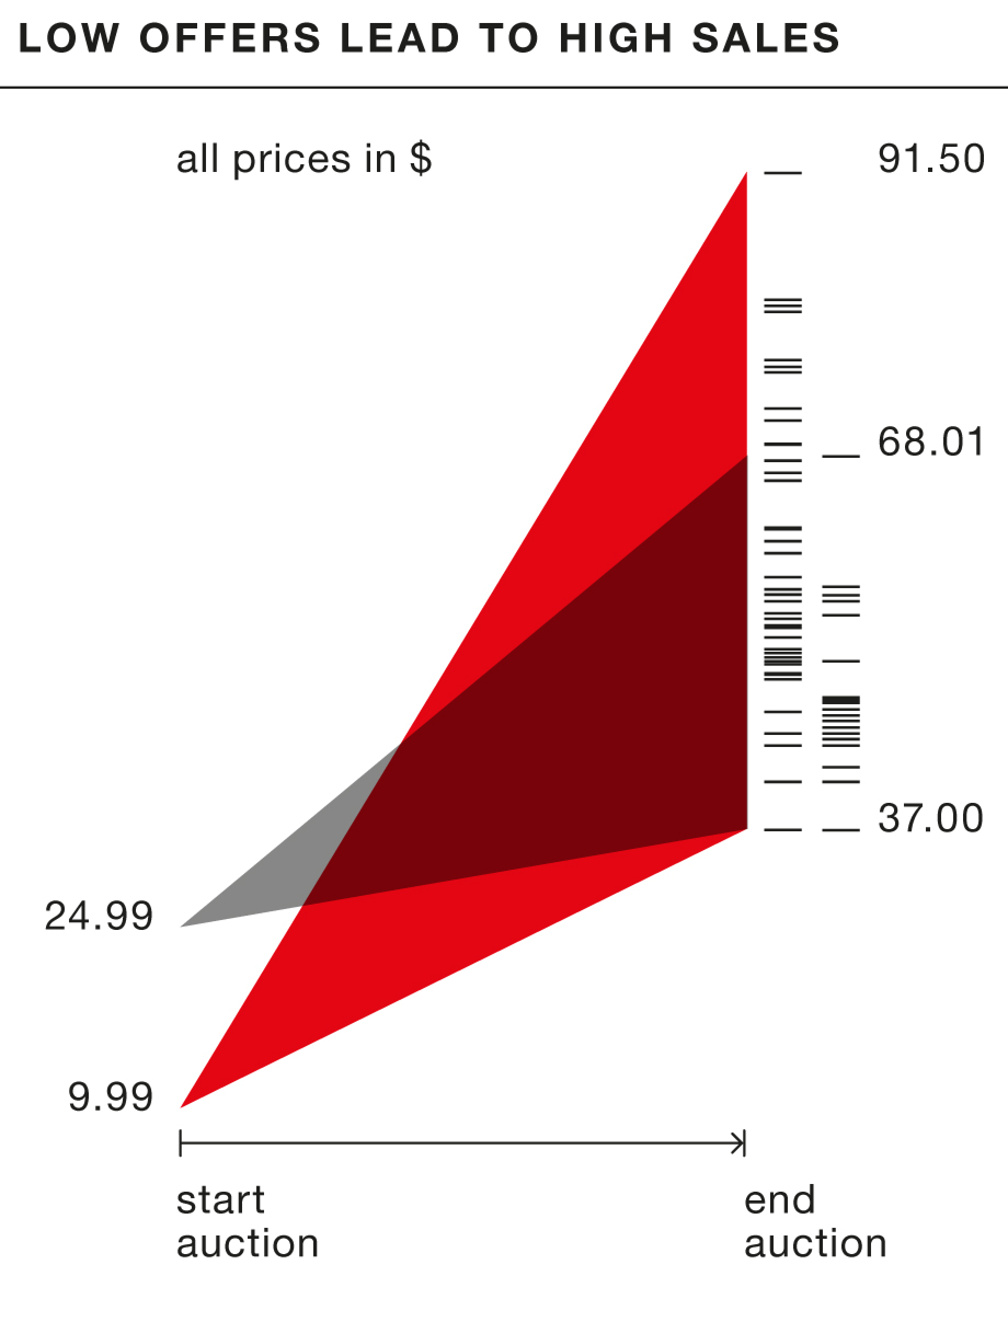
March 2013 – Charts and map about the crowdfunding platform 'Kickstarter' for Fast Company Magazine, Harlan (US).
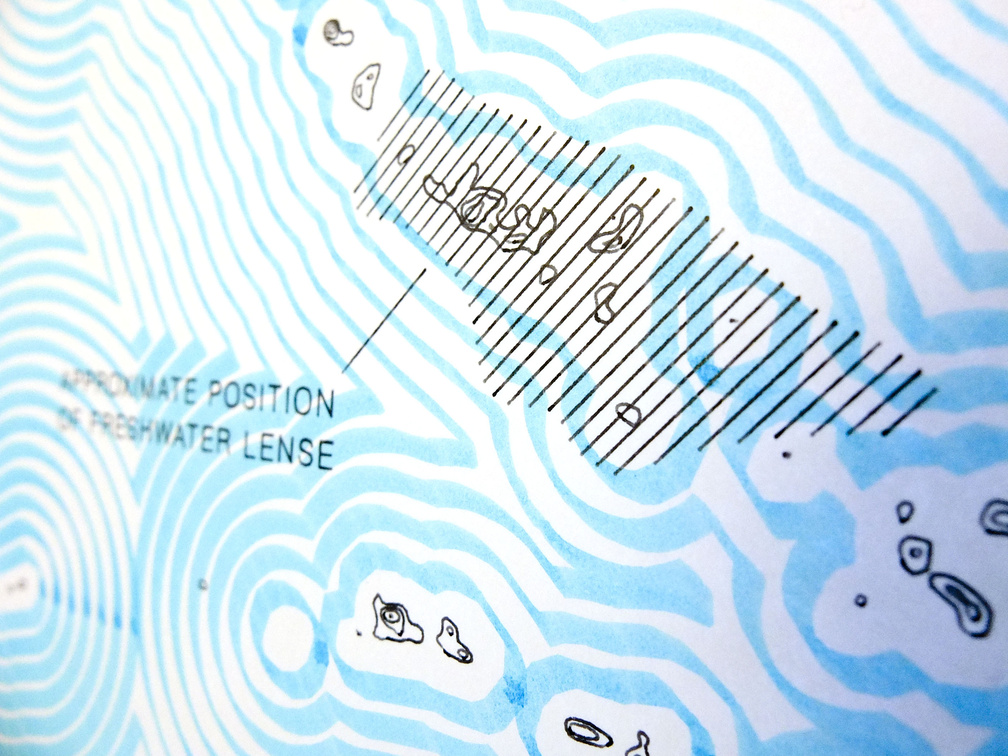
March 2013 – Series of four plotted posters about Tarawa which is part of the island nation Kiribati. With an maximum altitude of about 3 meters above sea level this could be the first nation which inhabitants have to be relocated in the next 50 years due to rising sea levels and pollution of drinking water.
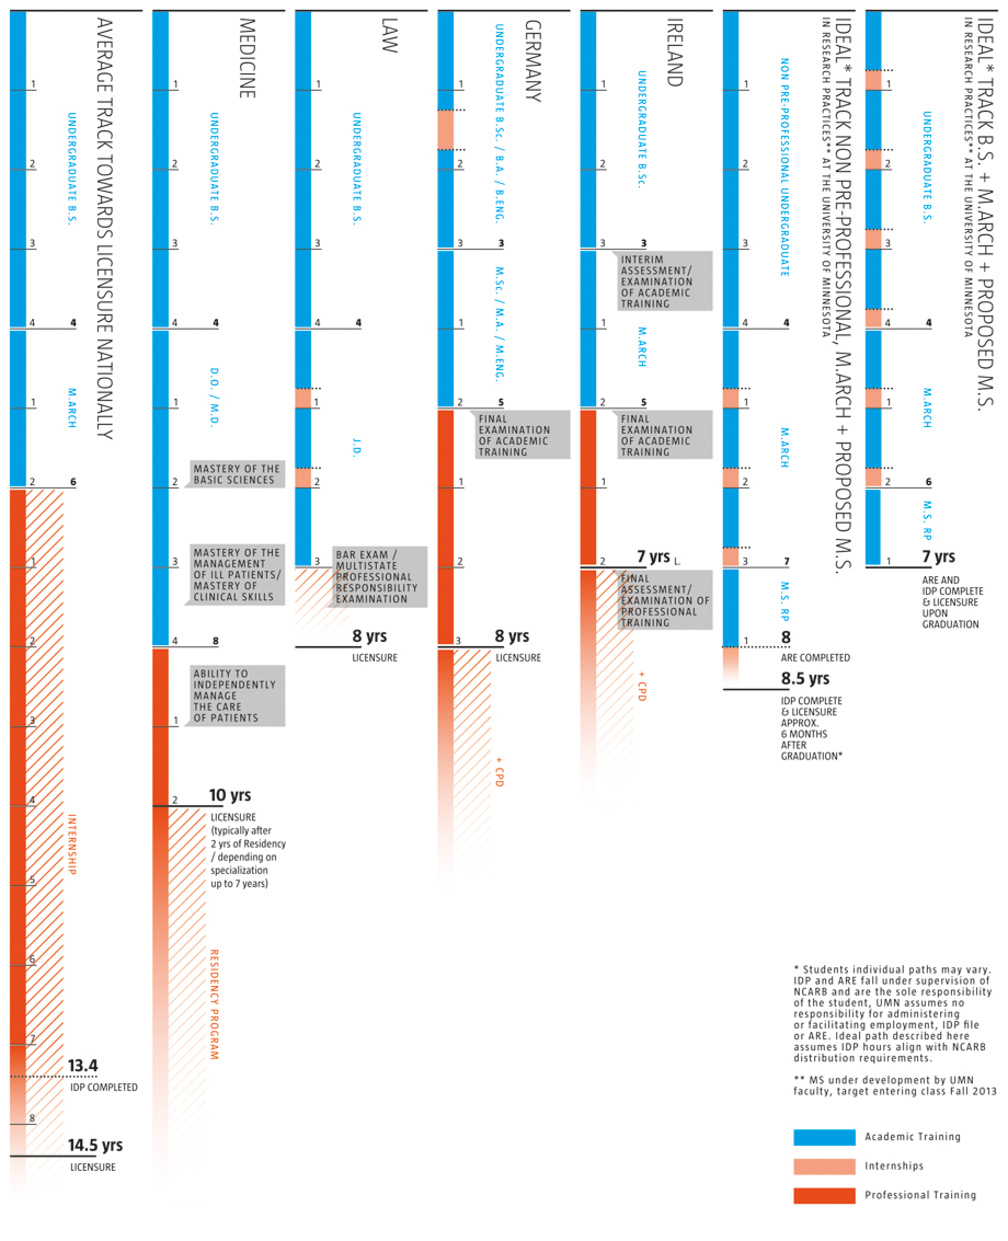
The Question of Licensure: Seven Years is Enough
January 2013 – Chart comparing study tracks for Architect Magazine, Washington D.C. (US).
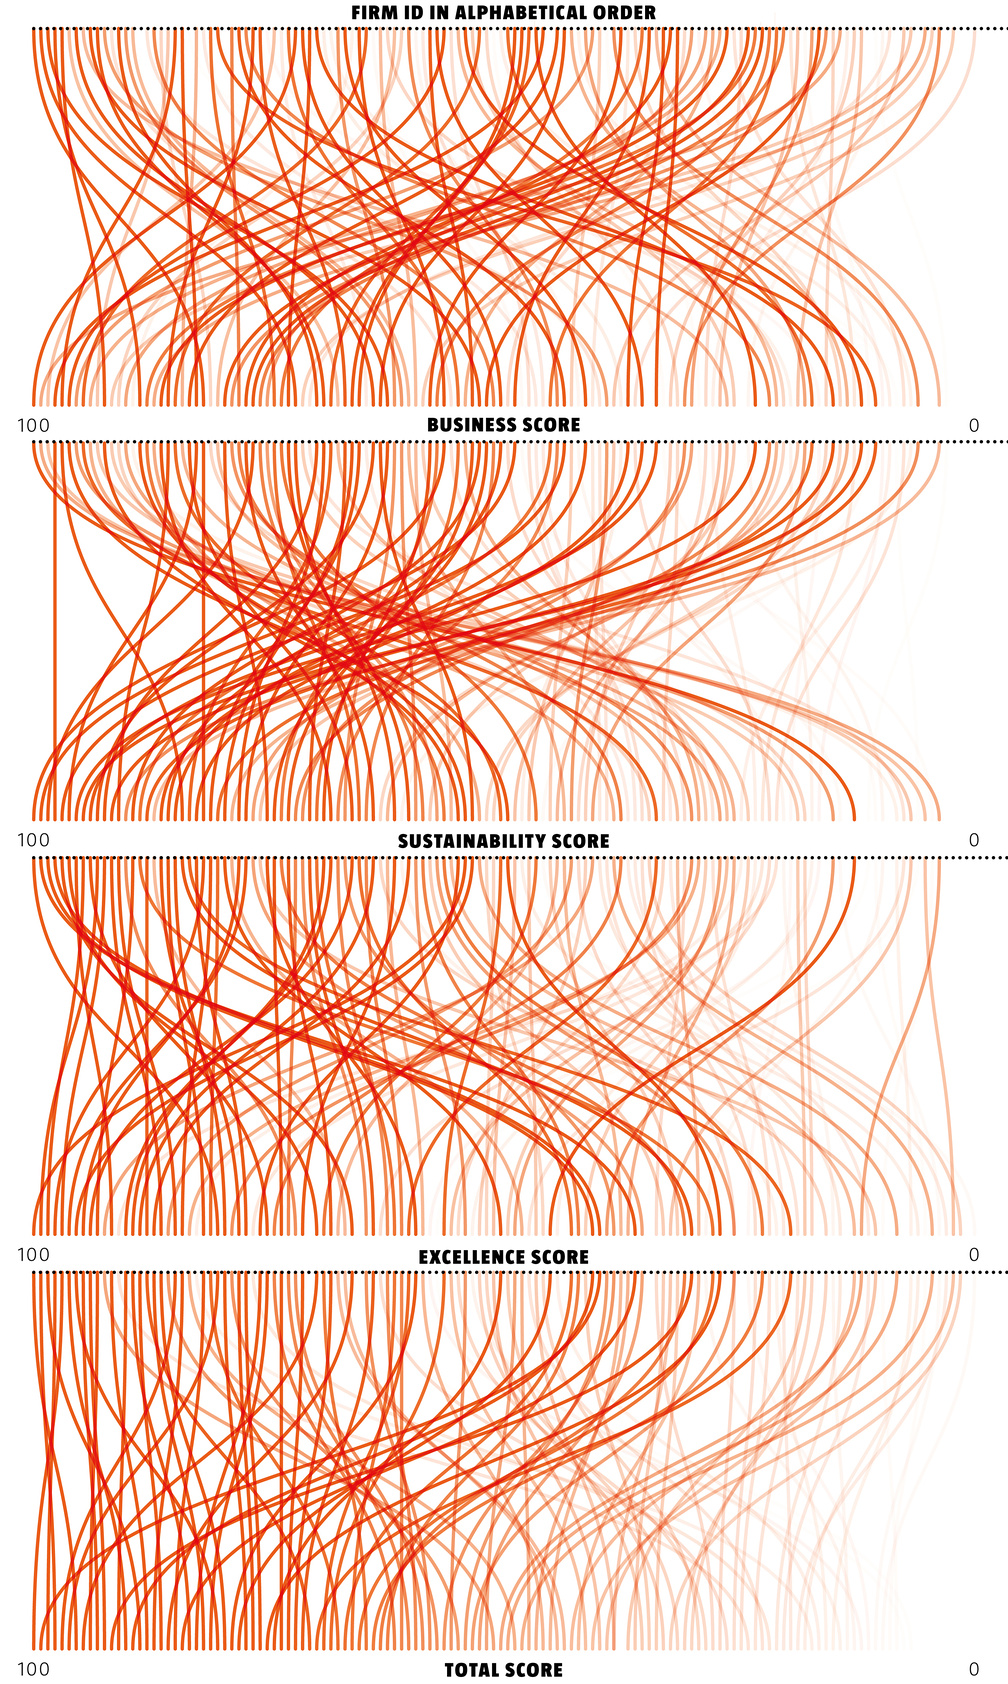
September 2012 – Data visualizations of the magazine's annual ranking of architecture firms for Architect Magazine, Washington D.C. (US).
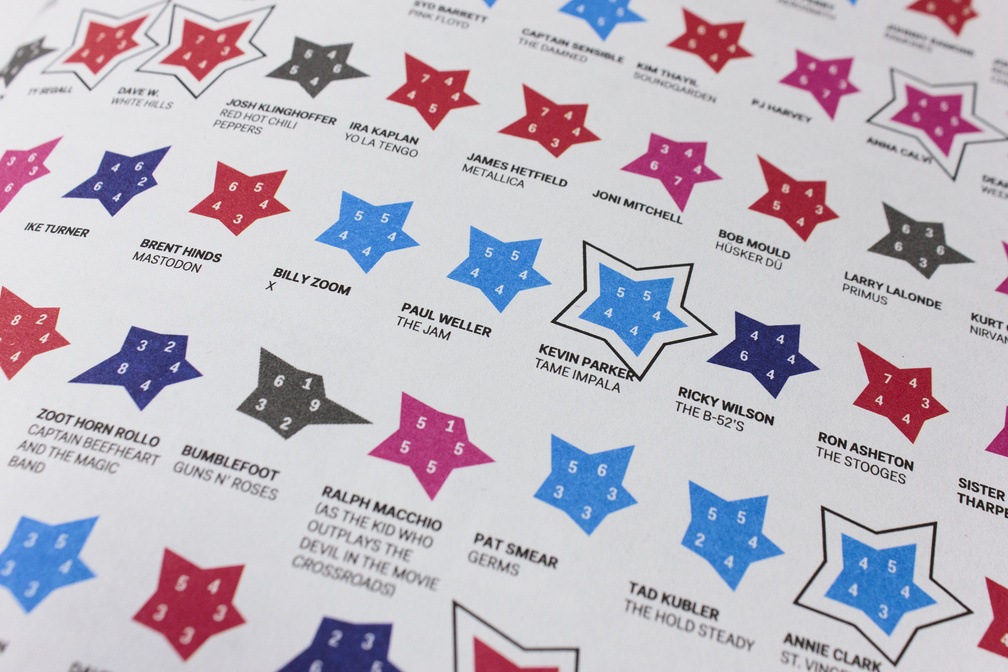
May 2012 – Infographic for music magazine SPIN. Visualization of a subjective classification of guitar players depending on their scores at the five categories: Volume, Shreditude, Technique, Emotion and Originality.
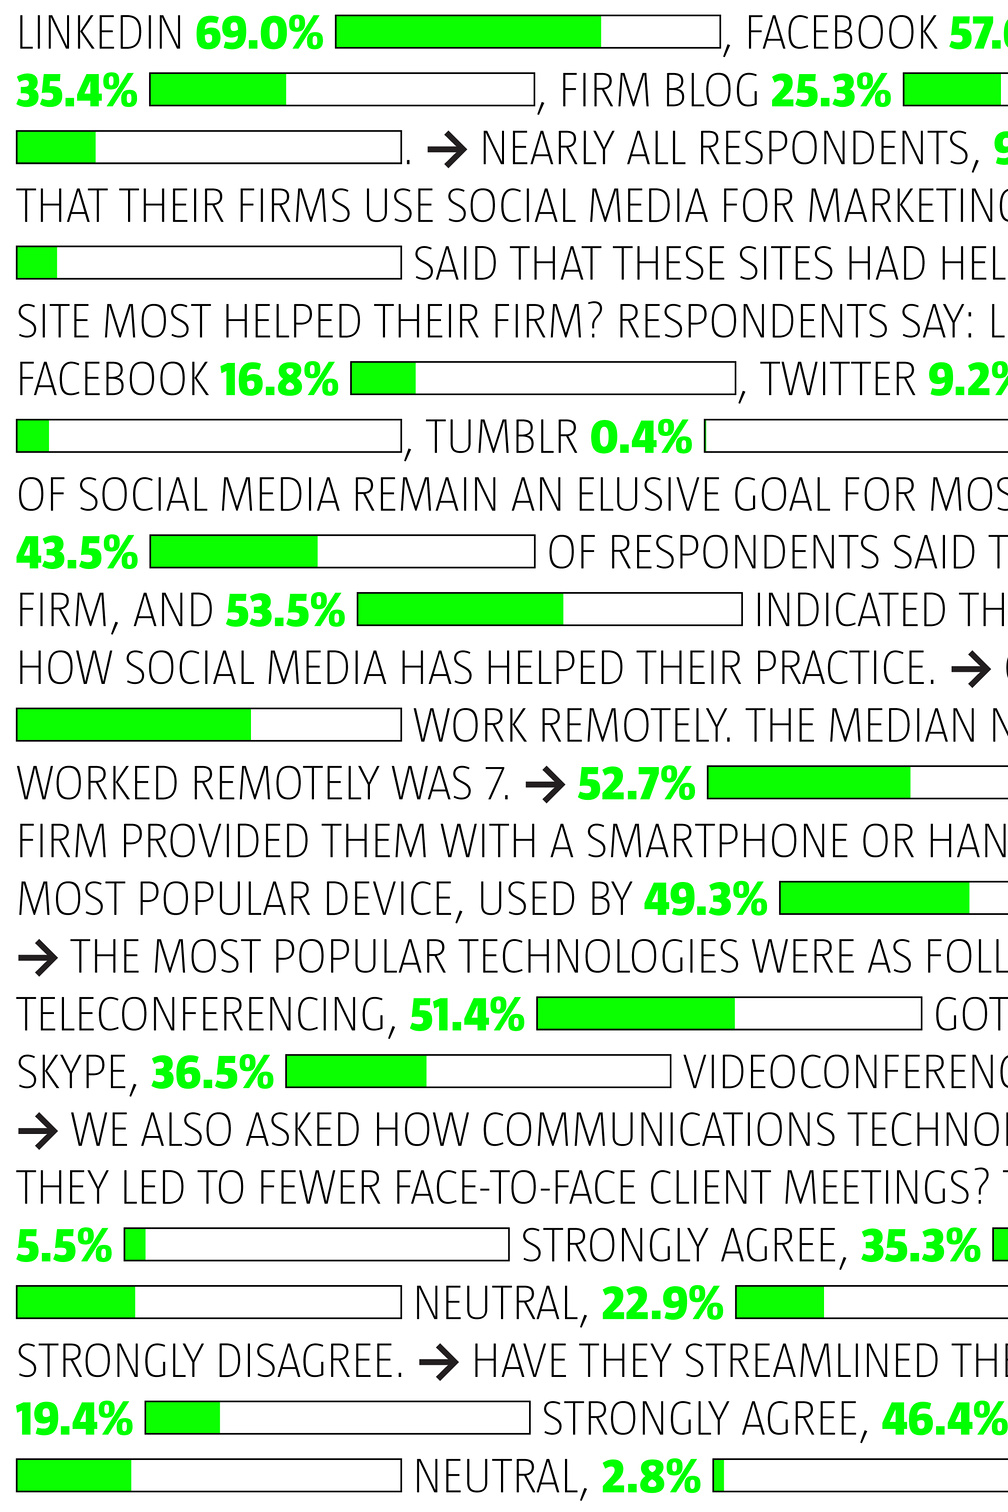
January 2012 – Typographical data visualizations on the benefits of social media for Architect Magazine, Washington D.C. (US).
The Rise of the Machines
November 2011 – Web based, interactive infographic that visualizes 'The Rise of the Machines' for Popular Science. In collaboration with Systemantics (HTML5 development) .
July 2011 – Data mining and visualization for SICA, Amsterdam (NL). Who are the most traveling dutch artists in 2010 and where did they go?
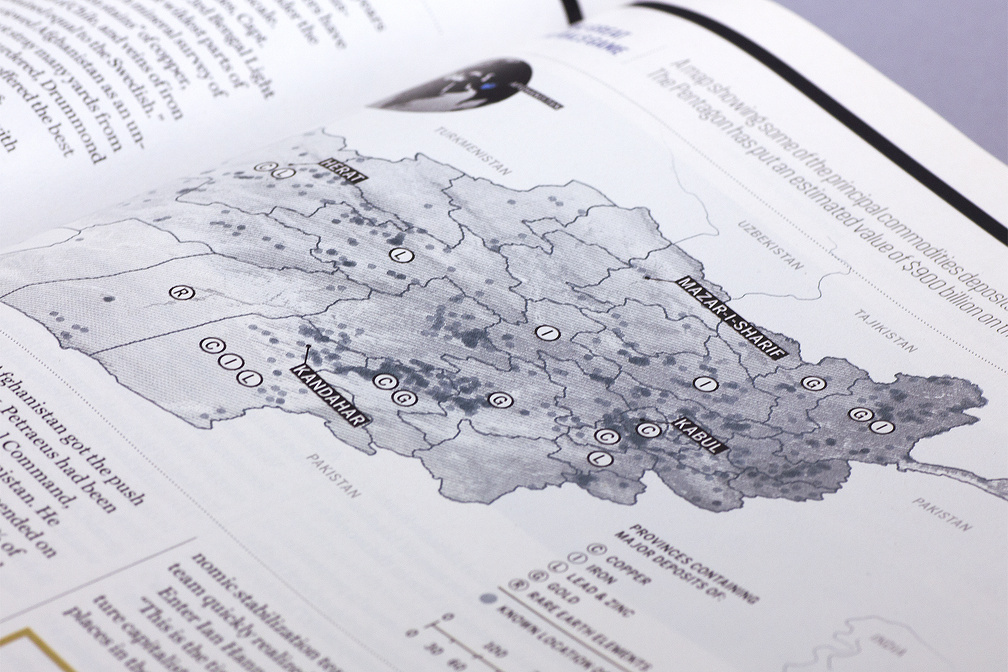
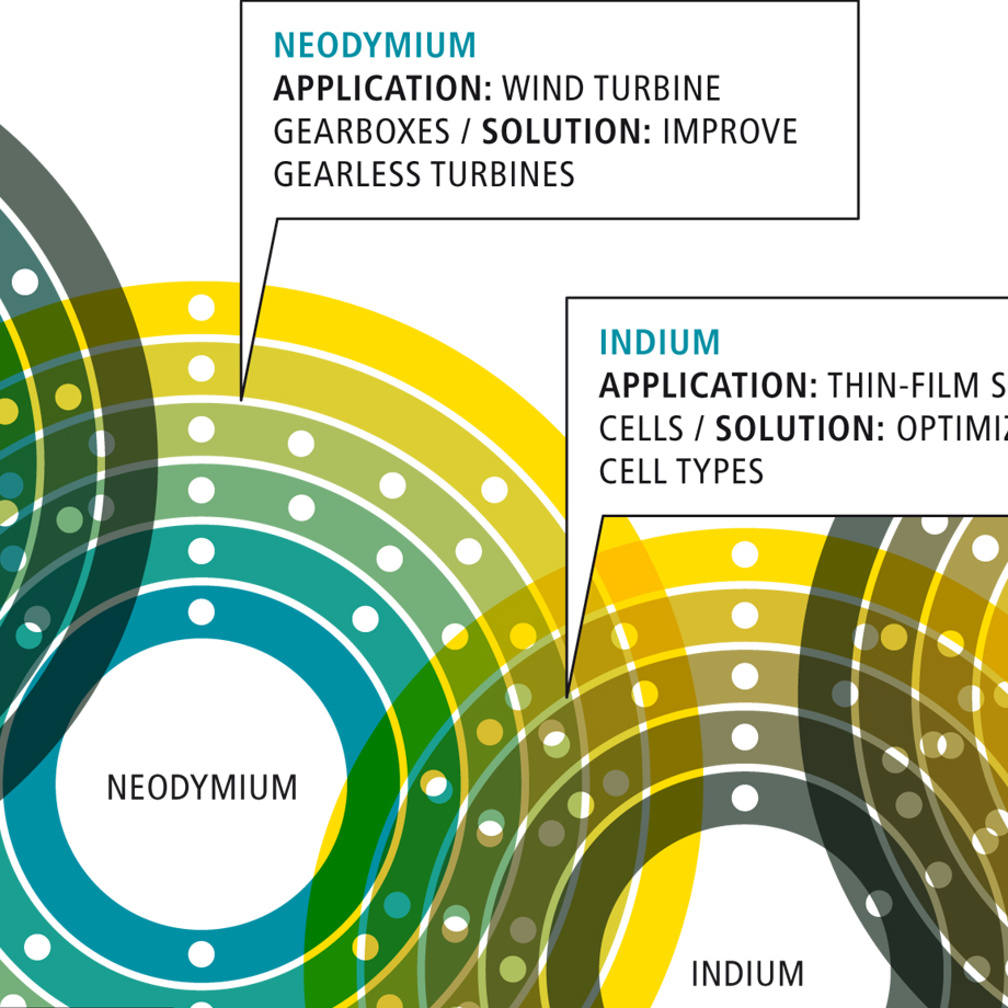
The Great Minerals Game
May 2011 – Map showing some of the principal commodities deposits in Afghanistan for Fortune Magazine, New York (US).
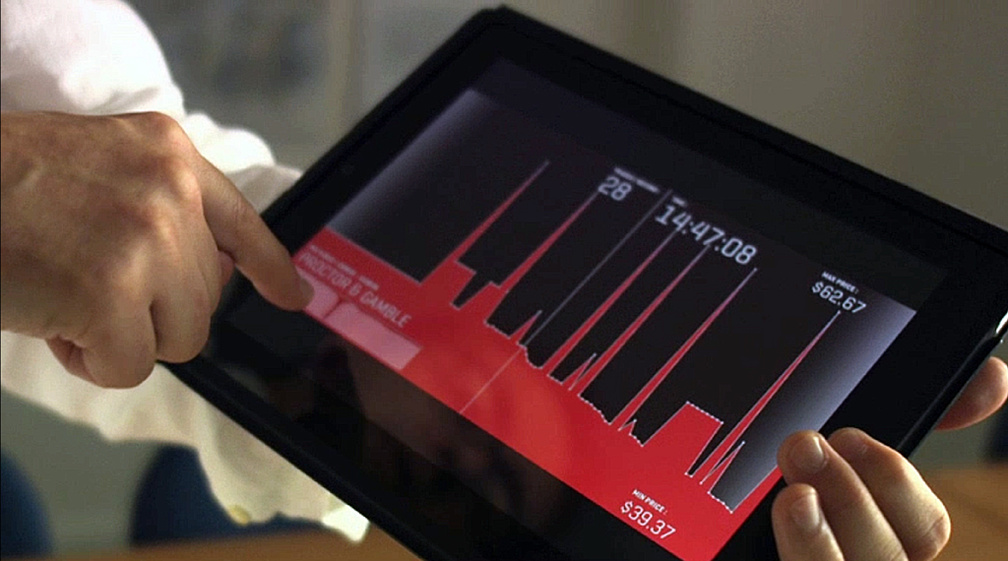
January 2011 – Together with Marije Meerman from VPRO Tegenlicht we developed a TouchDoc app for the iPad.

Immigrant Languages in the United Kingdom
October 2010 – Our contribution to the exhibition 'The Modern Art of Conversation' as a part of the Design Event in Newcastle upon Tyne. It shows the languages spoken in the northeast of England. In collaboration with Nina Bender (intern) .
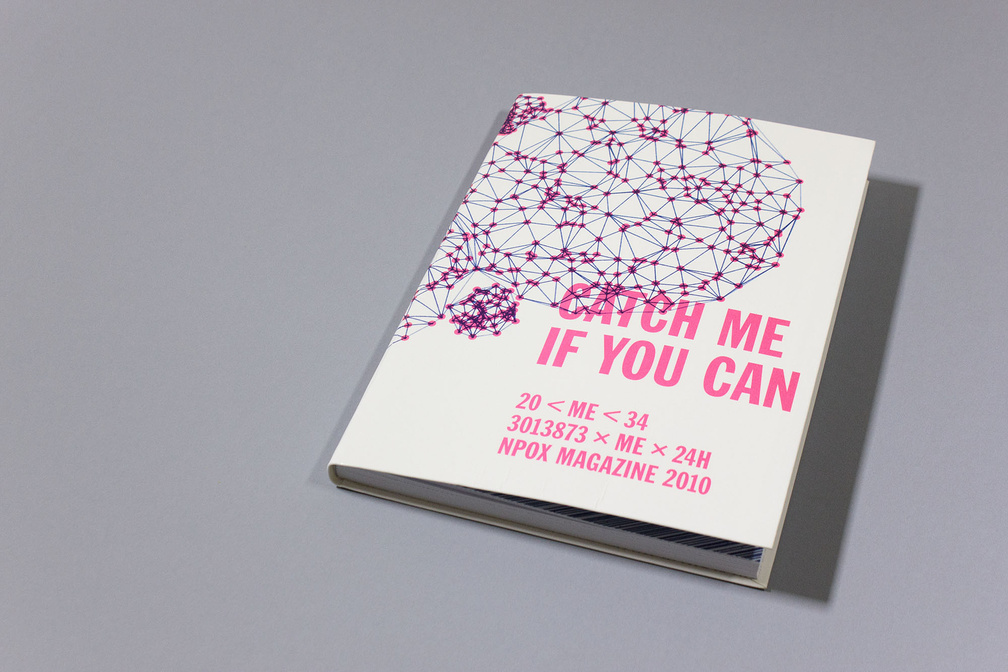
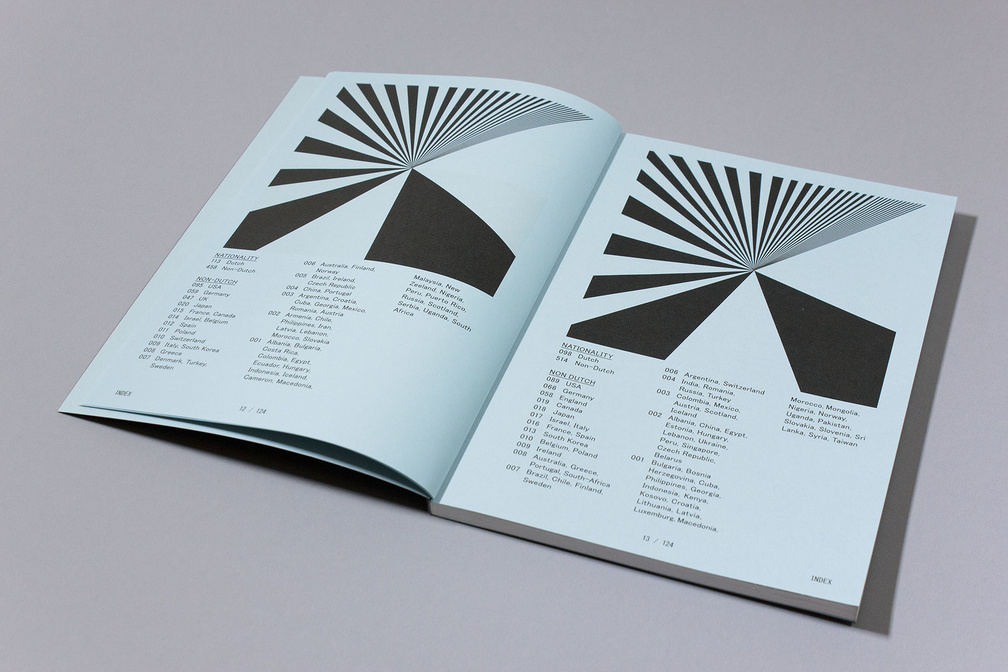
September 2010 – Magazine 'Catch me if you can' on the occasion of the NPOX10 FESTIVAL organised by NPO, Hilversum (NL).
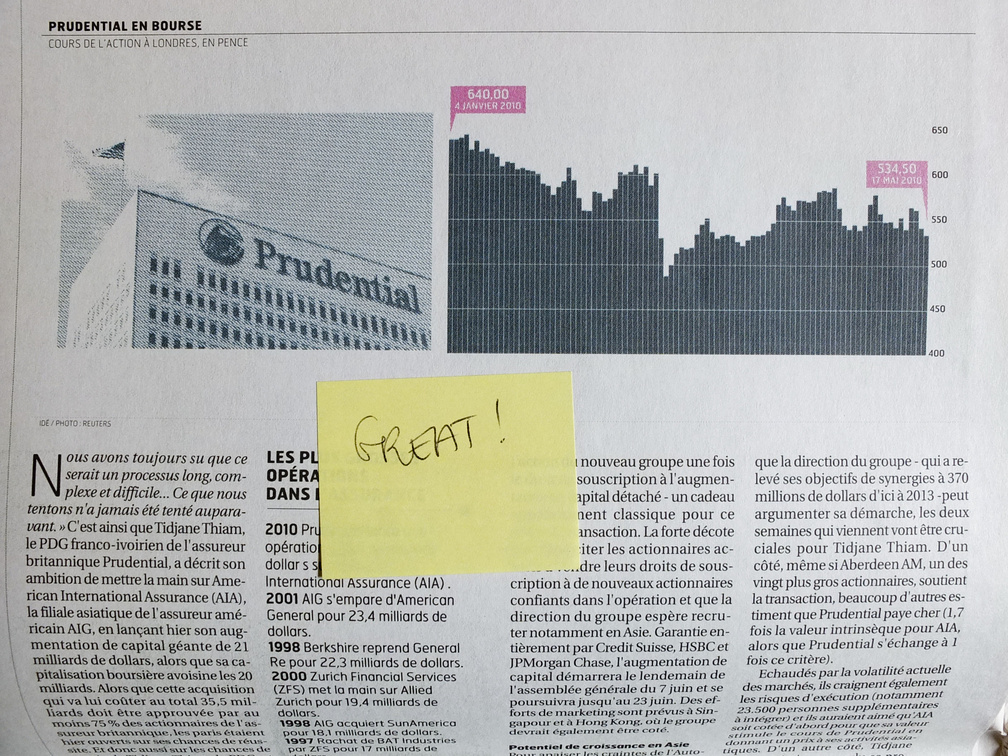
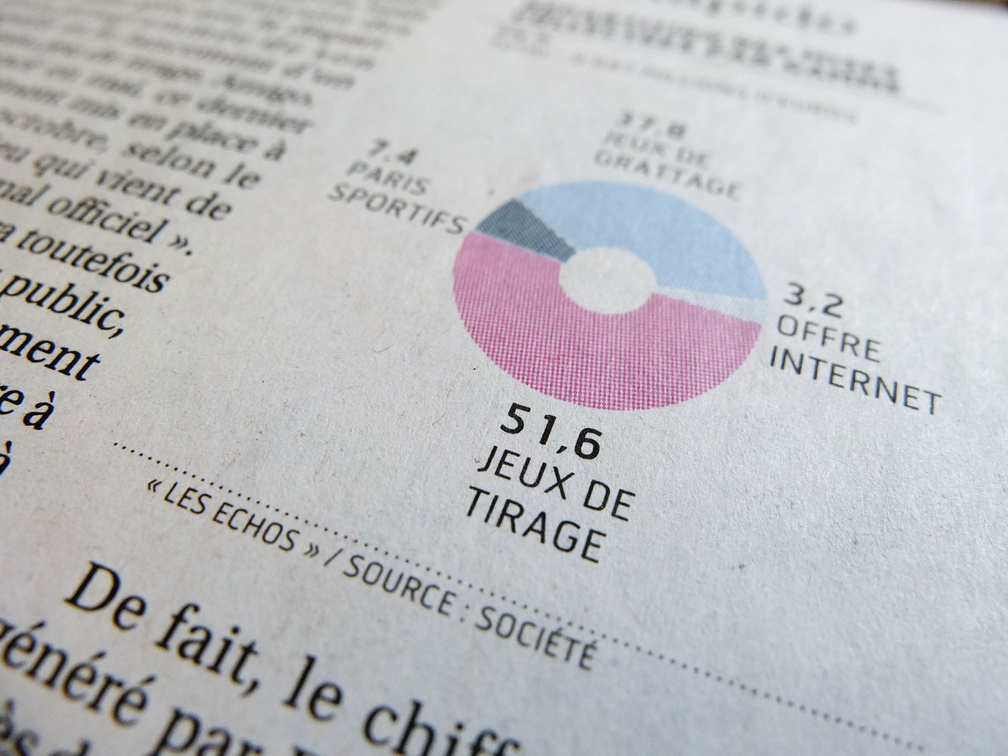
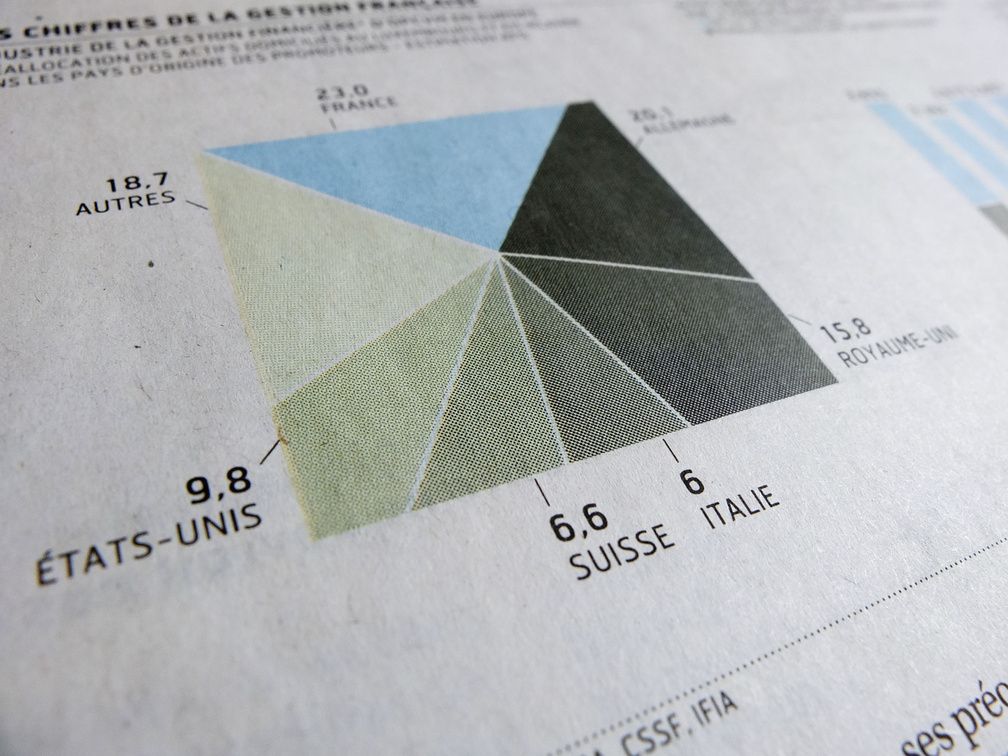
June 2010 – Redesign of all charts and data visualizations for the financial newspaper Les Echos, Paris (FR).
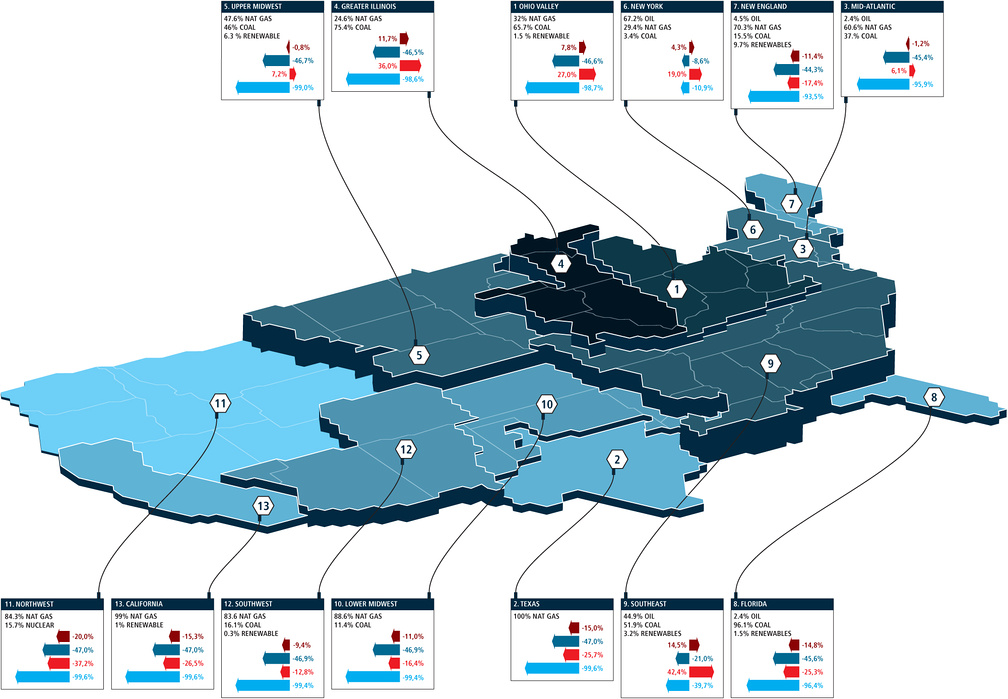
The Dirty Truth about Plug-In Hybrids
April 2010 – Map showing sustainable energy in the 13 electric power grid regions of the U.S. for Scientific American, New York (US).
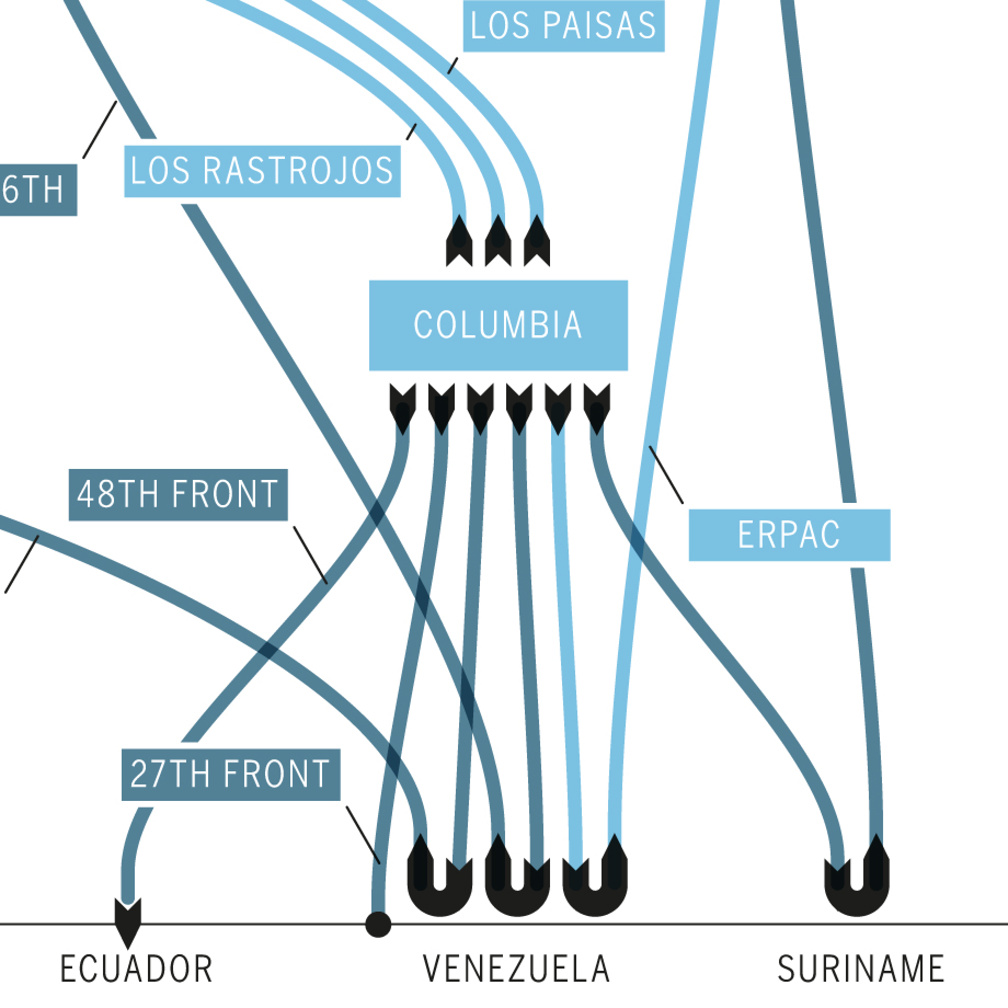
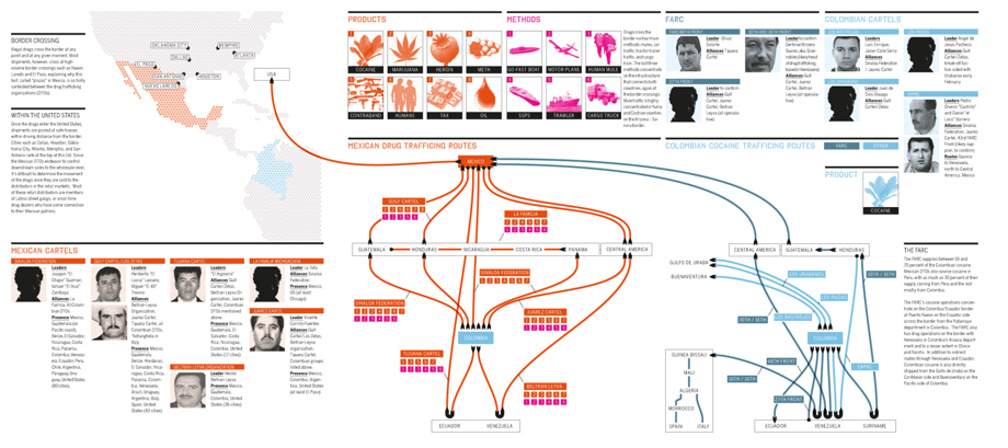
Narco-networks in The Americas
April 2010 – Map and charts on drug-trafficking routes in The Americas for Americas Quarterly, New York (US).

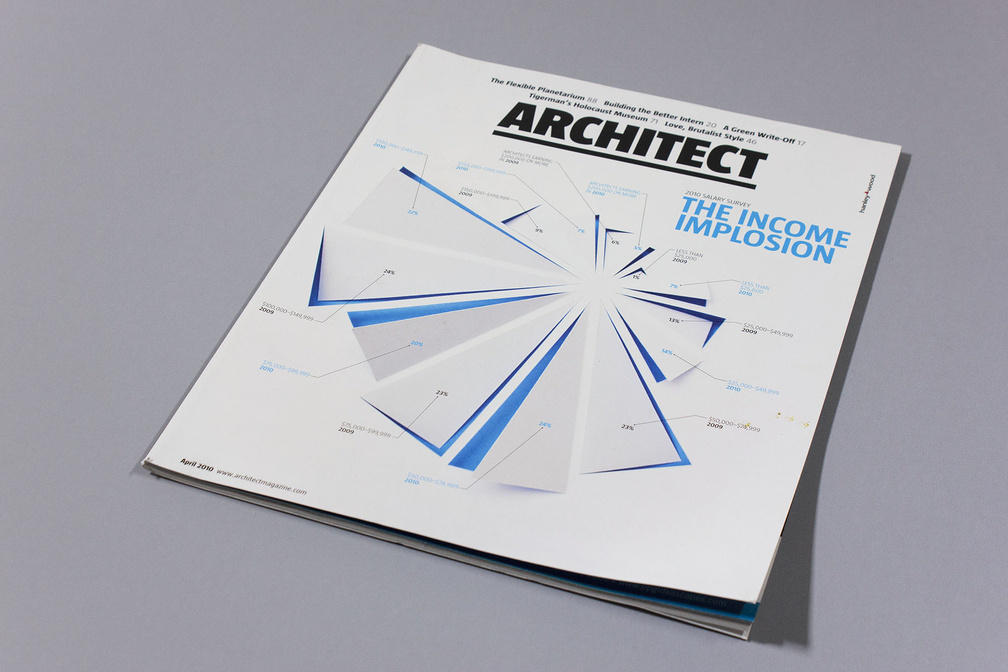
The Income Implosion: cover
March 2010 – Cover for Architect Magazine, Washington D.C. (US). In collaboration with Eva Thiessies (photography) .
A Path to Sustainable Energy by 2030
October 2009 – Diagrams (detail) for Scientific American, New York (US). In collaboration with Eva Thiessies (intern) .
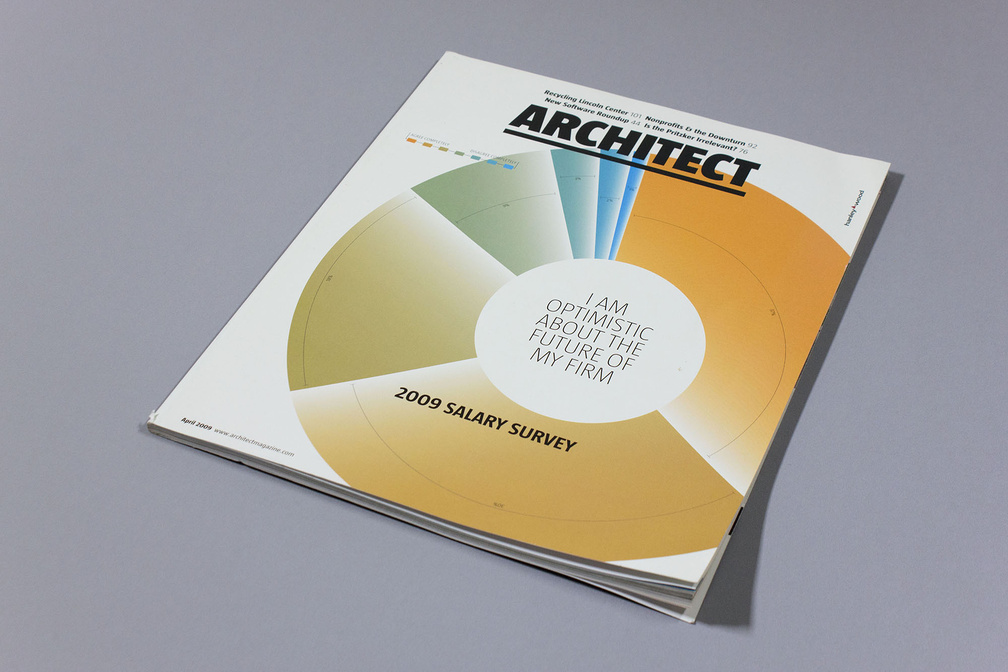
Do Architects Believe In Global Warming?
October 2009 – Diagrams (detail) for Architect Magazine, Washington D.C. (US). In collaboration with Eva Thiessies (intern) .
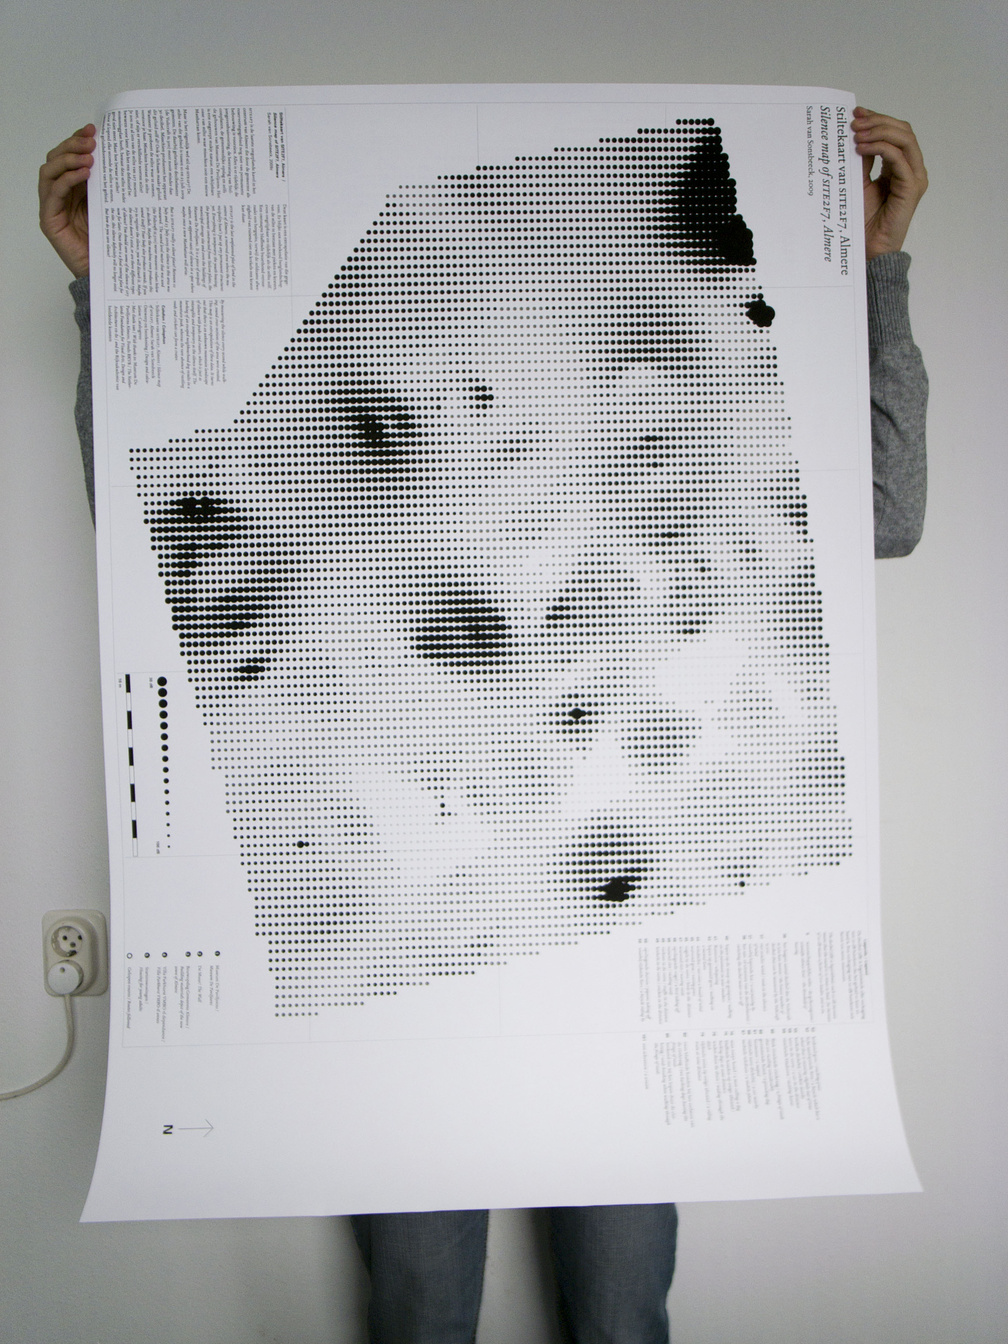
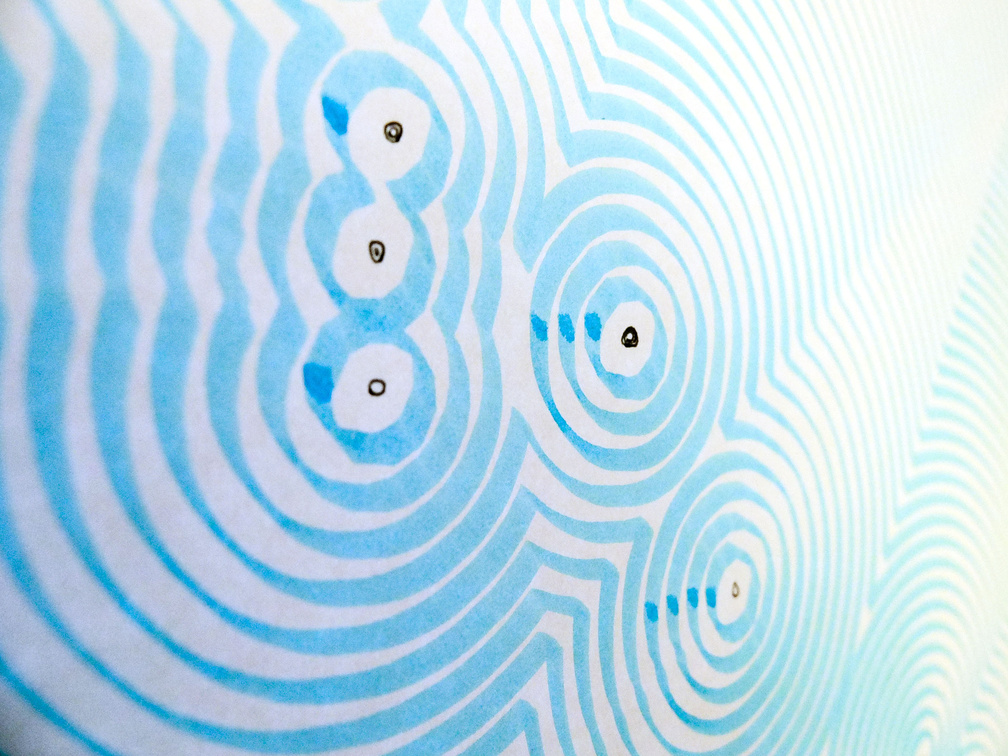
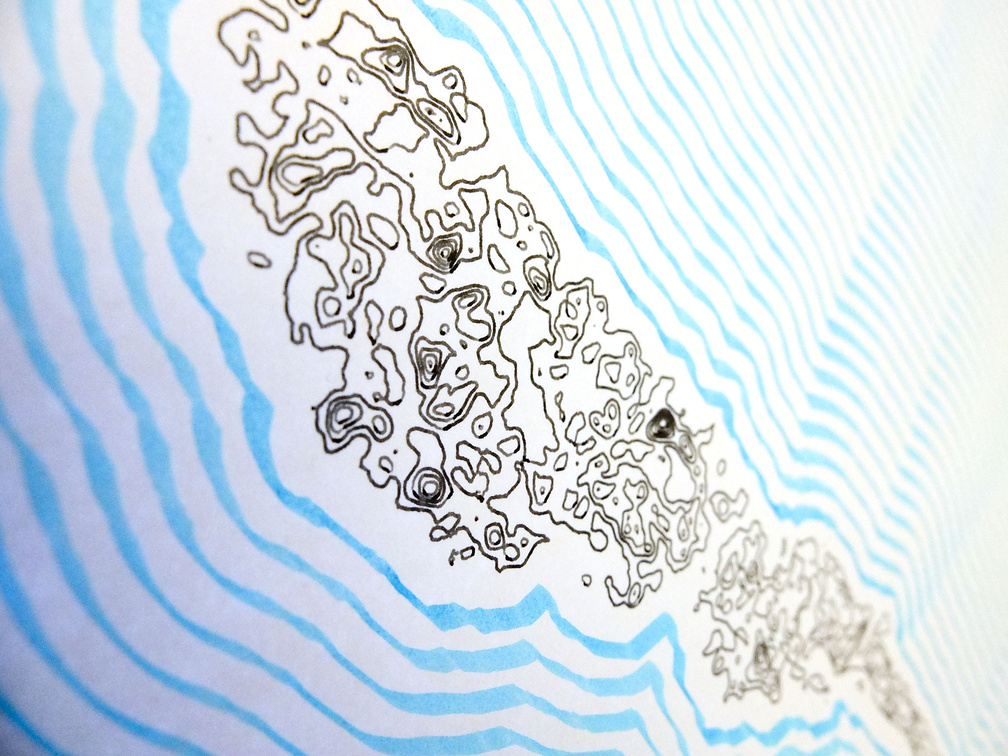
stiltekaart
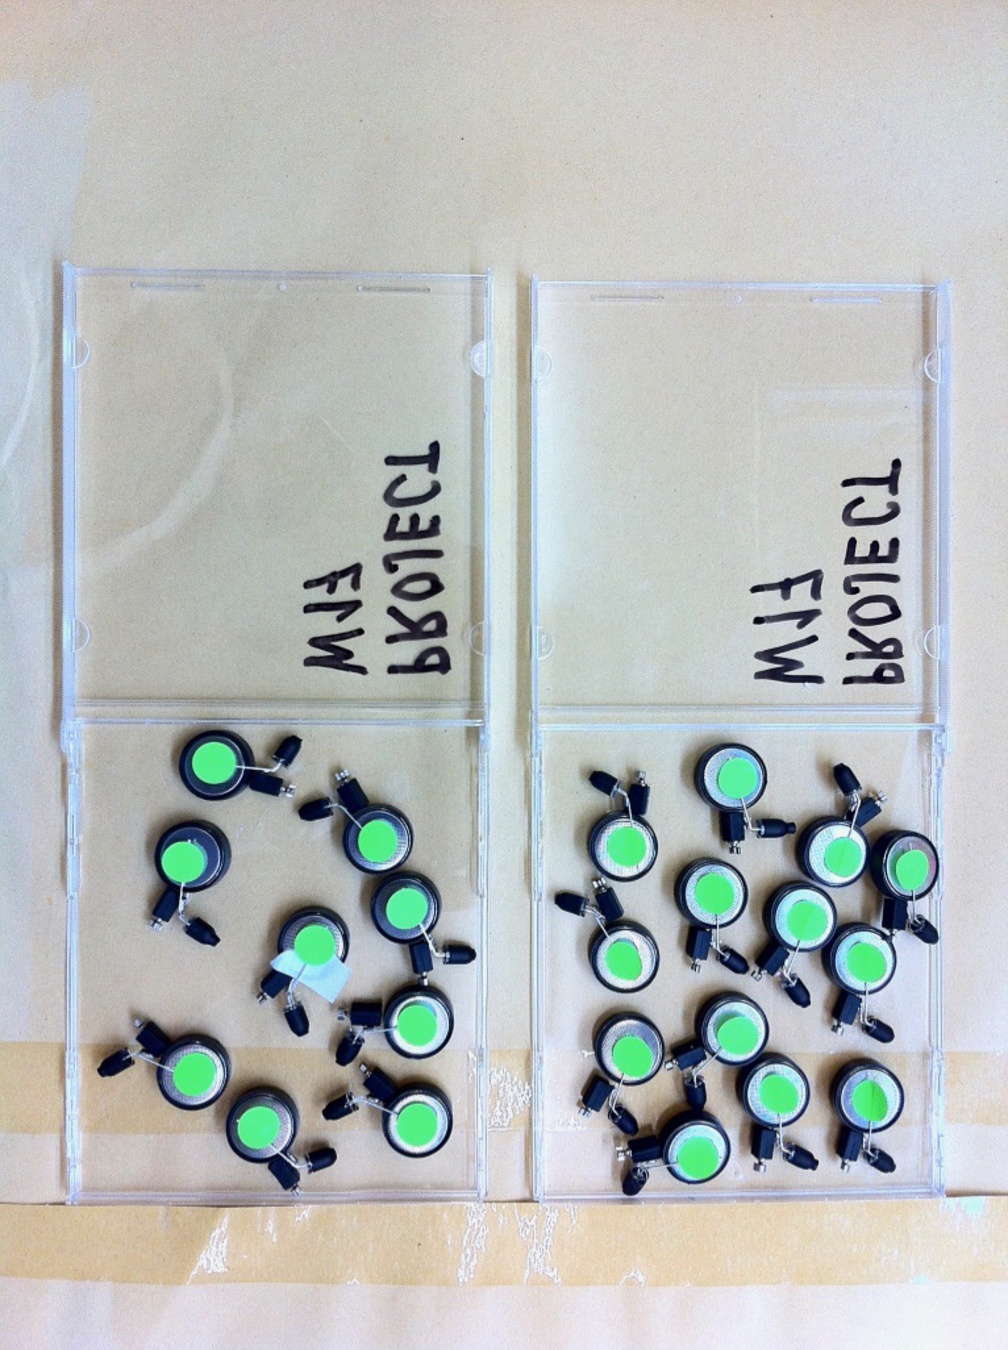
August 2009 – Visualisaton of sound levels for Sarah van Sonsbeeck. Big dots (darker areas) represent silence as measured by Sarah on site 2F7 in Almere. In collaboration with Sarah van Sonsbeeck (concept, project) , Eva van Diggelen (curator) .
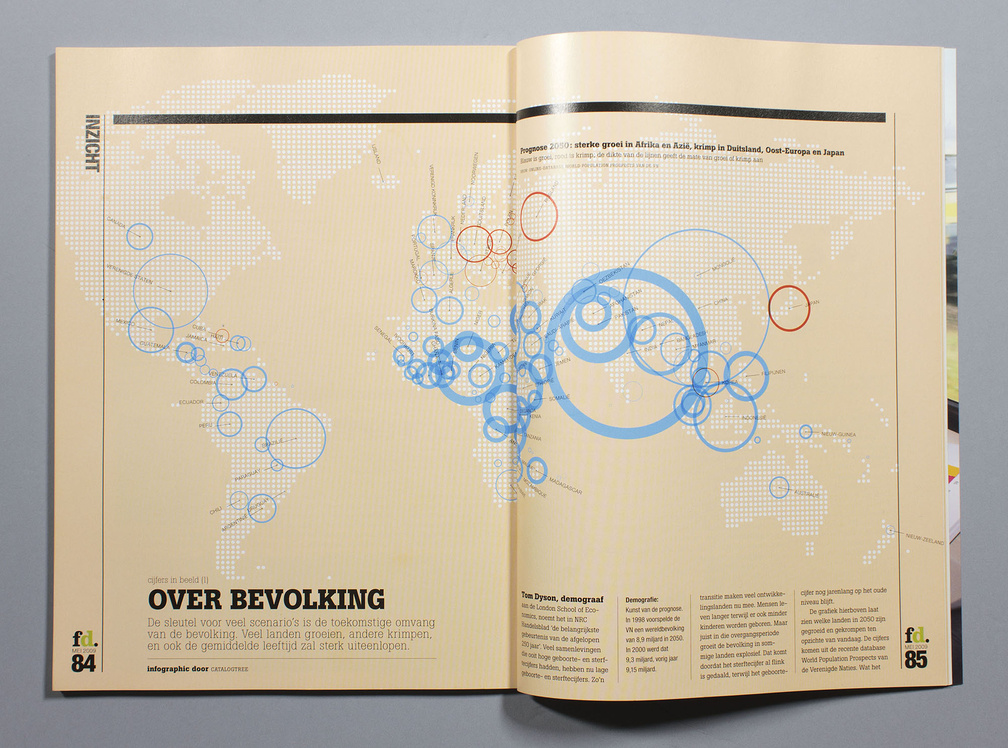
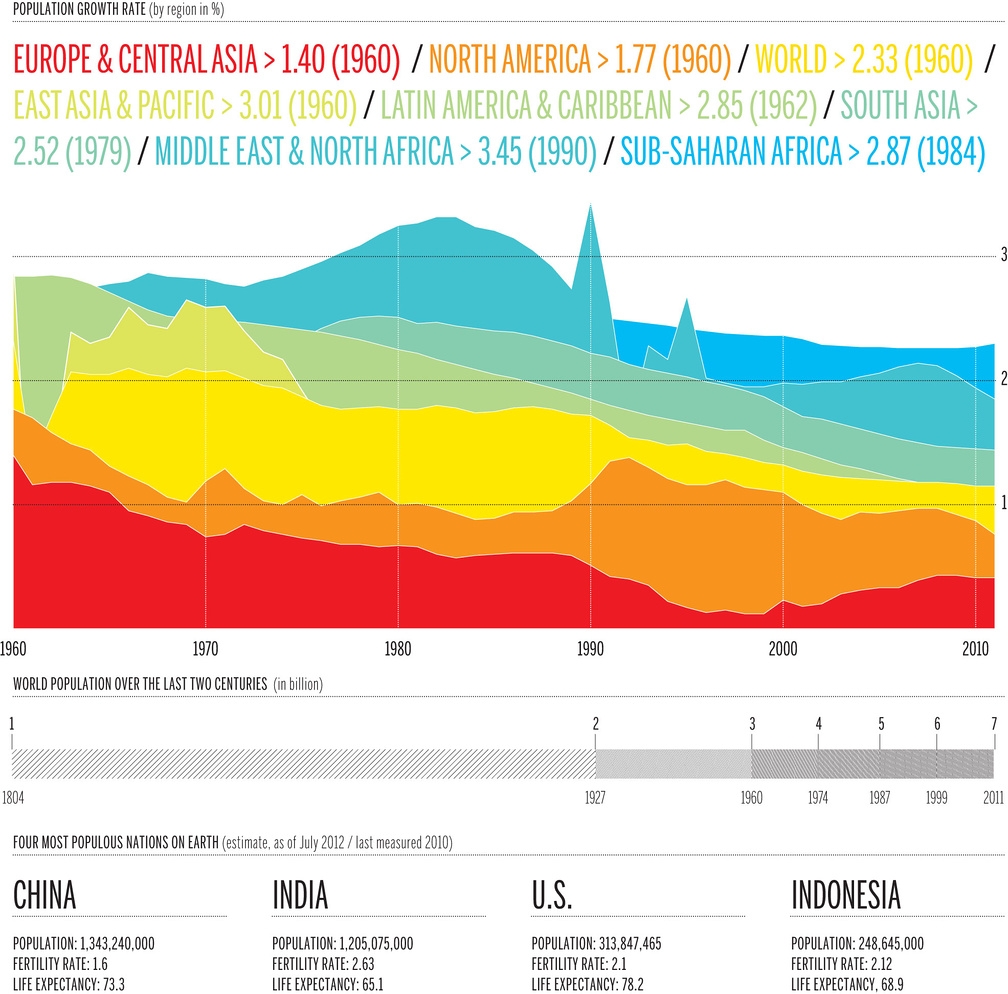
Over bevolking
May 2009 – Map on population growth by city until 2050 for fd Outlook, Amsterdam (NL).
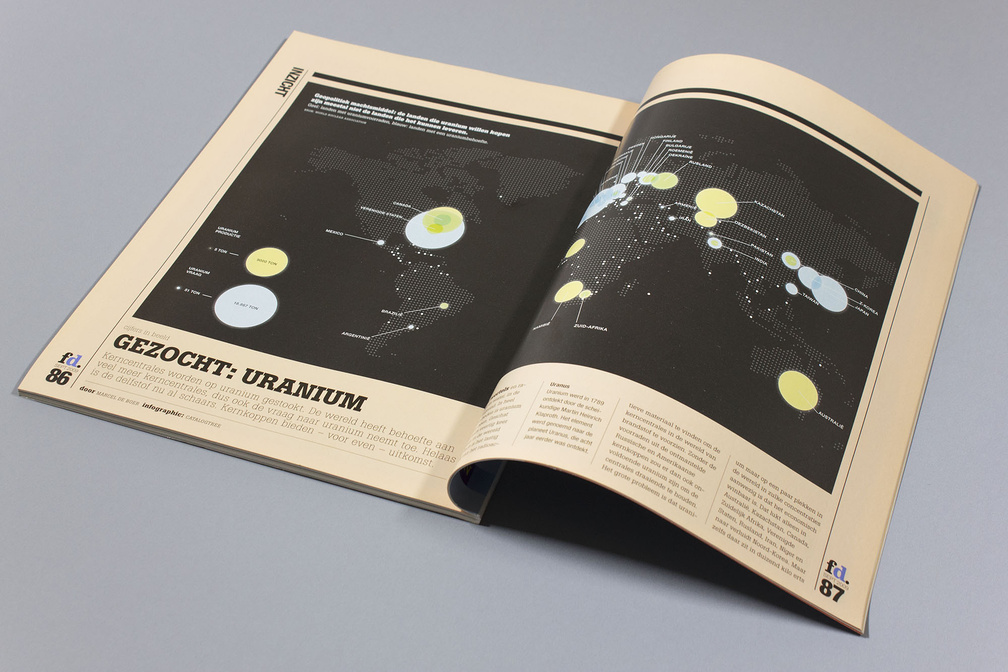
Gezocht: Uranium
March 2009 – Infographic for FD Outlook Magazine, Amsterdam (NL). In collaboration with Thijs Gadiot (freelance) .
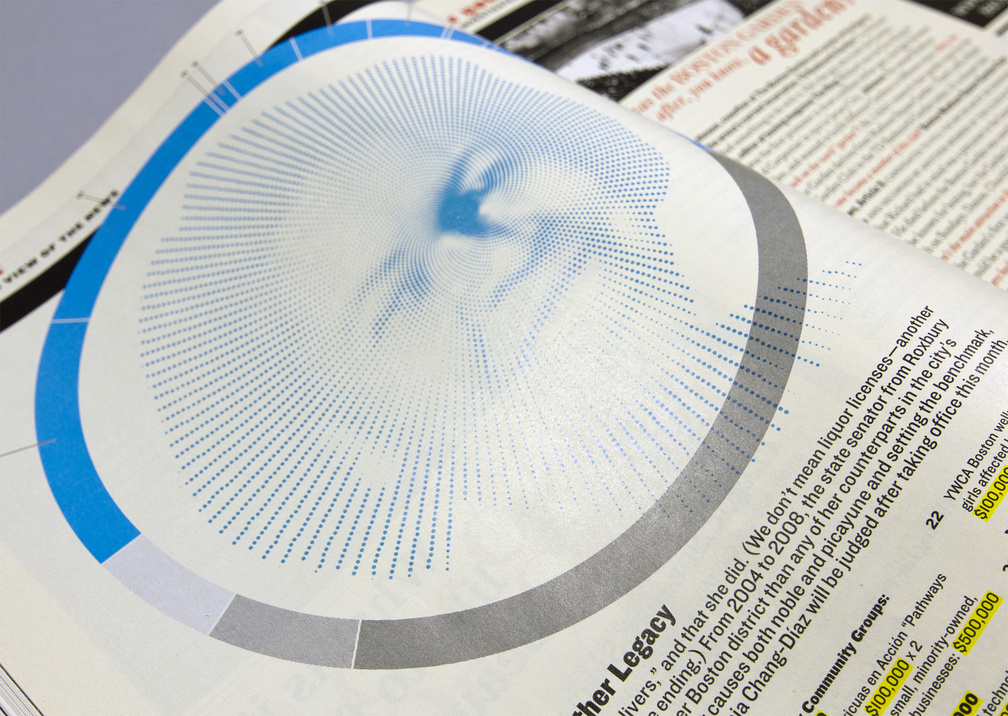
Dianne Wilkerson's Other Legacy
January 2009 – Chart and Illustration on the earmarks of state senator Dianne Wilkerson for Boston Magazine, Boston (US).
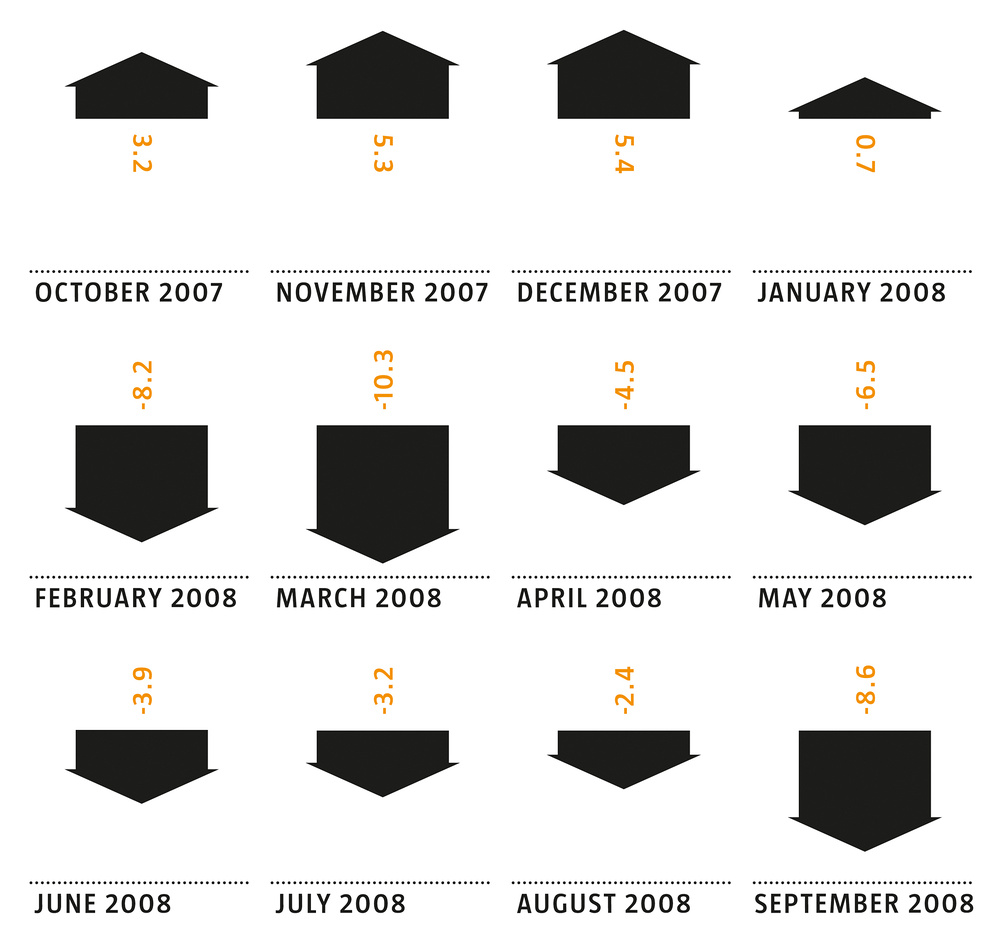
December 2008 – Infographics on six economic indicators for Architect Magazine, Washington D.C. (US).
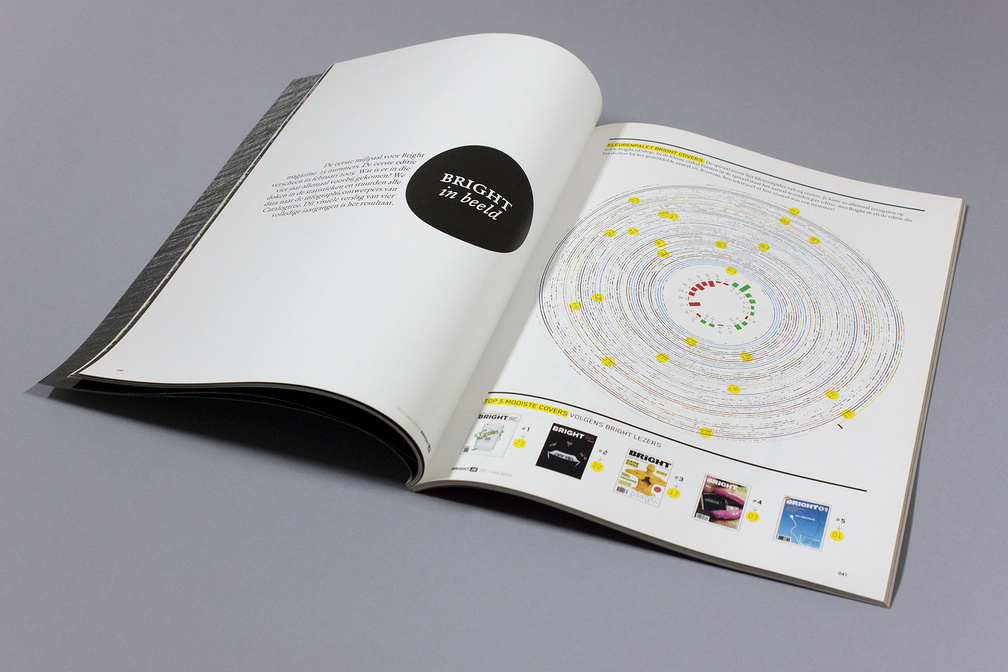
December 2008 – Series of infographics analysing all past 25 issues of BRIGHT magazine, Amsterdam (NL).
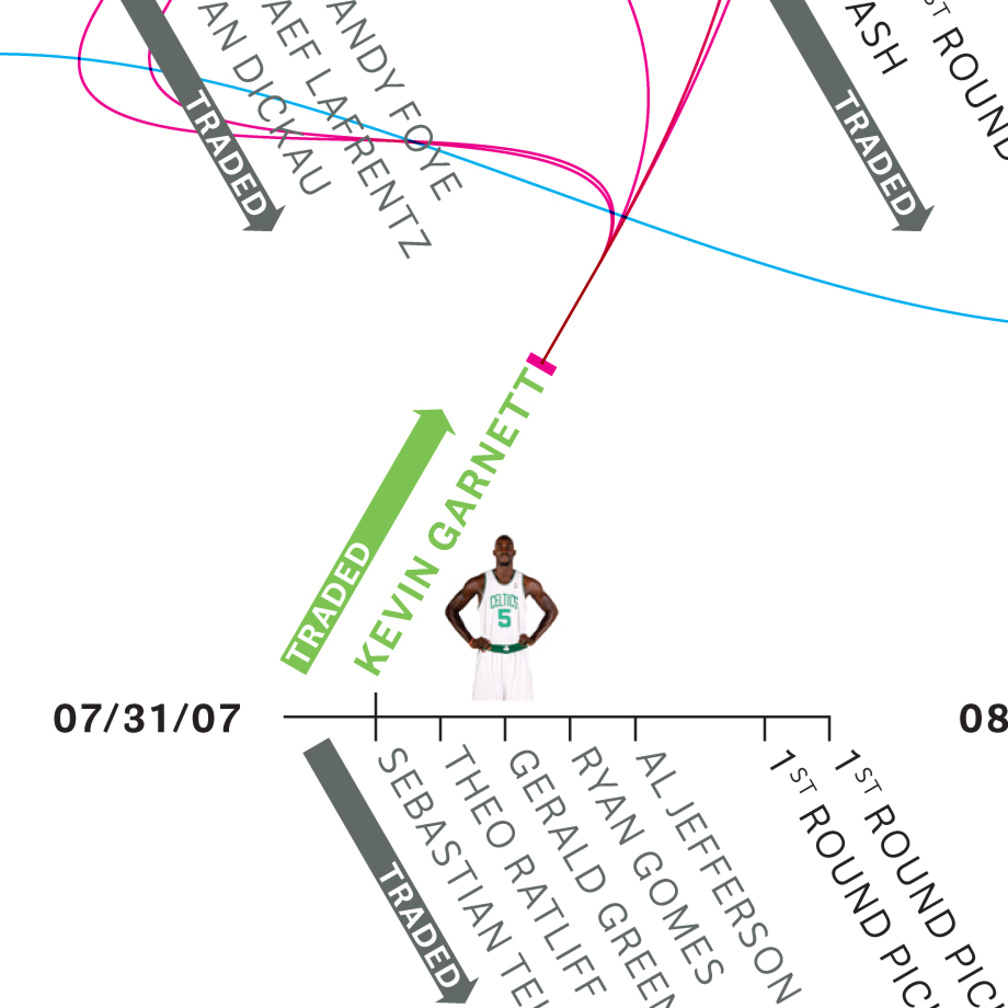
November 2008 – Infographics for Boston Magazine, Boston (US) on the effect of basketball player Kevin Garnett.
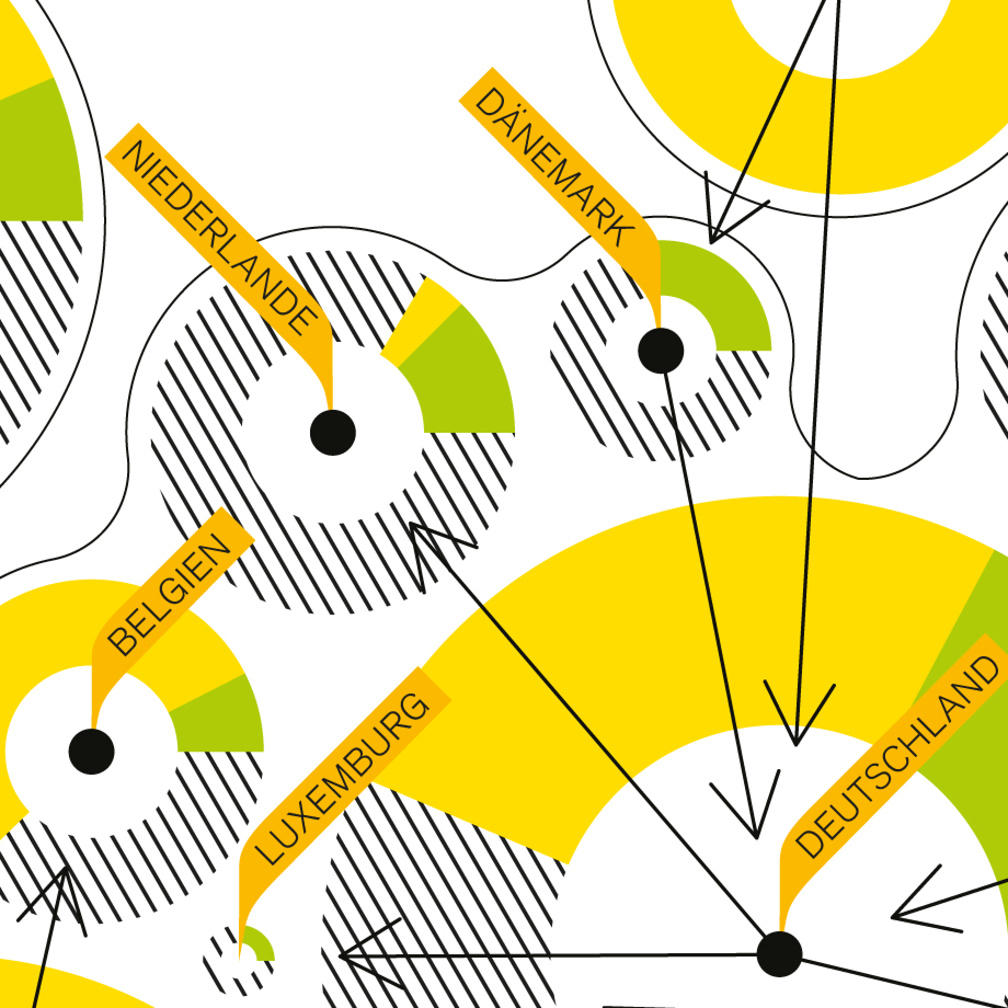
Energy Market Europe
June 2008 – Illustration of european energy flows for Matador magazine, Hamburg (DE).
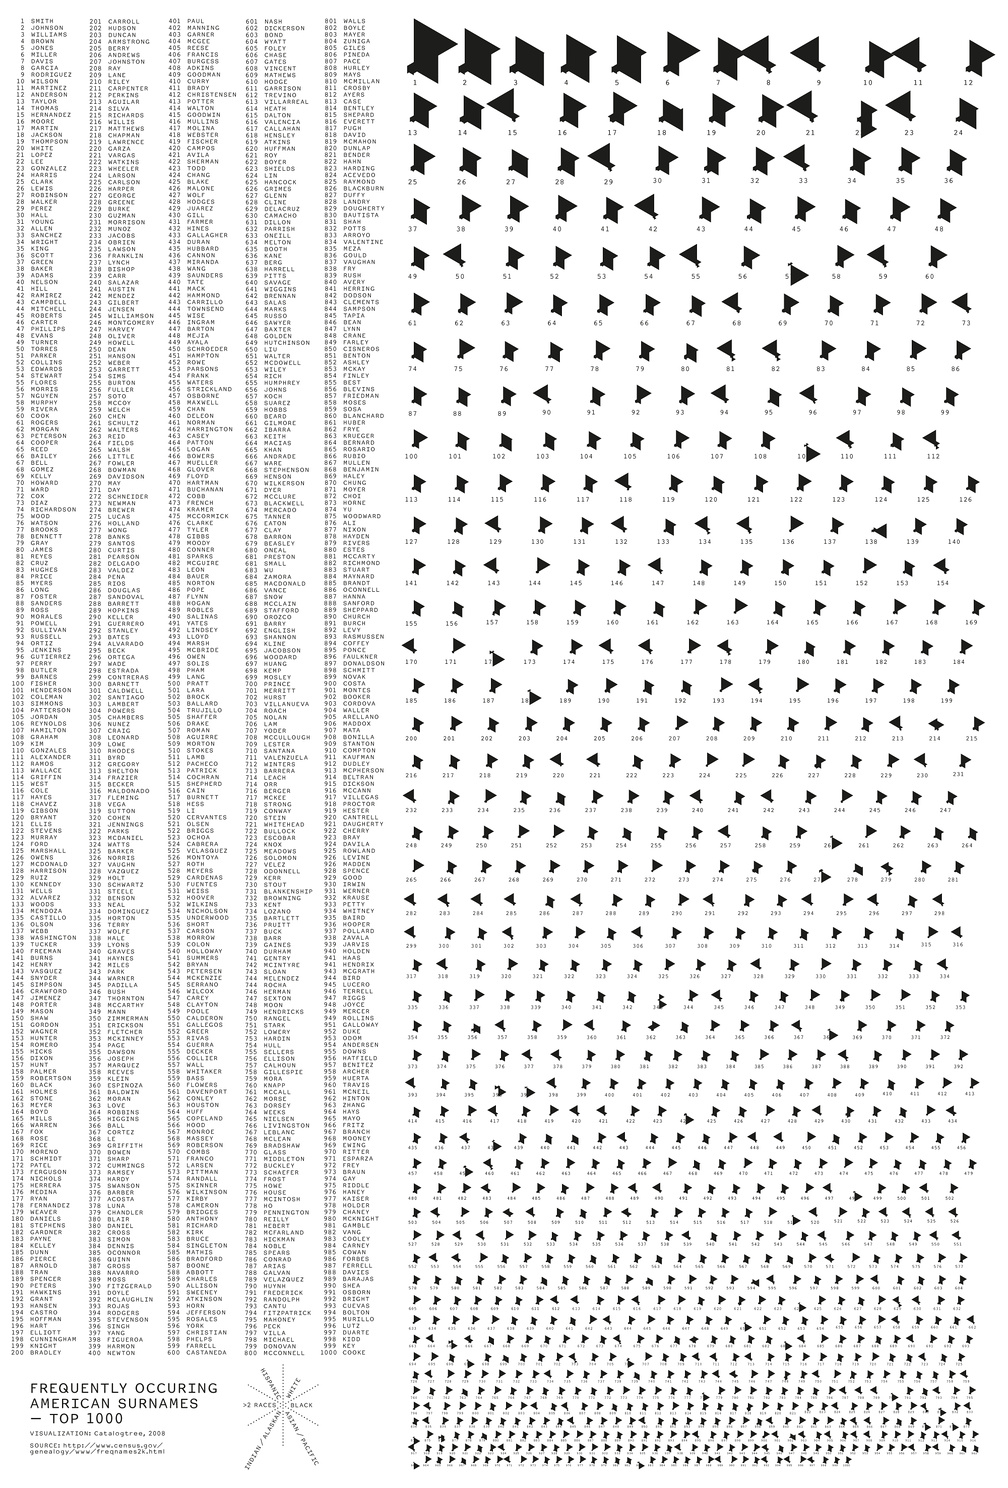
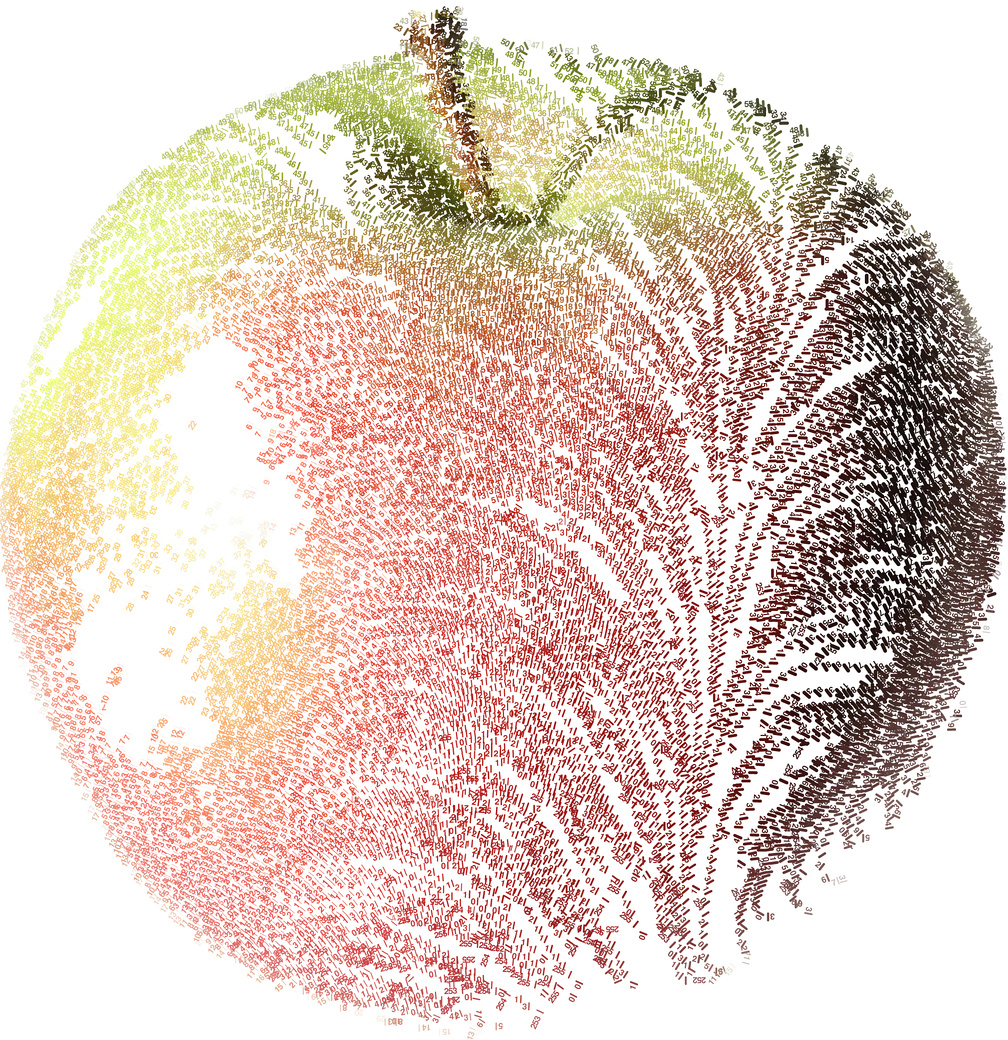
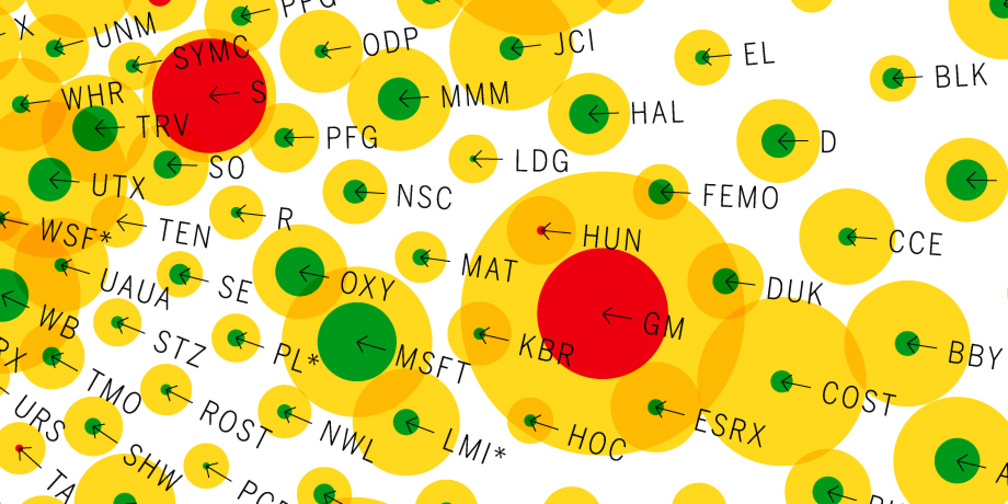
Frequently occuring american surnames
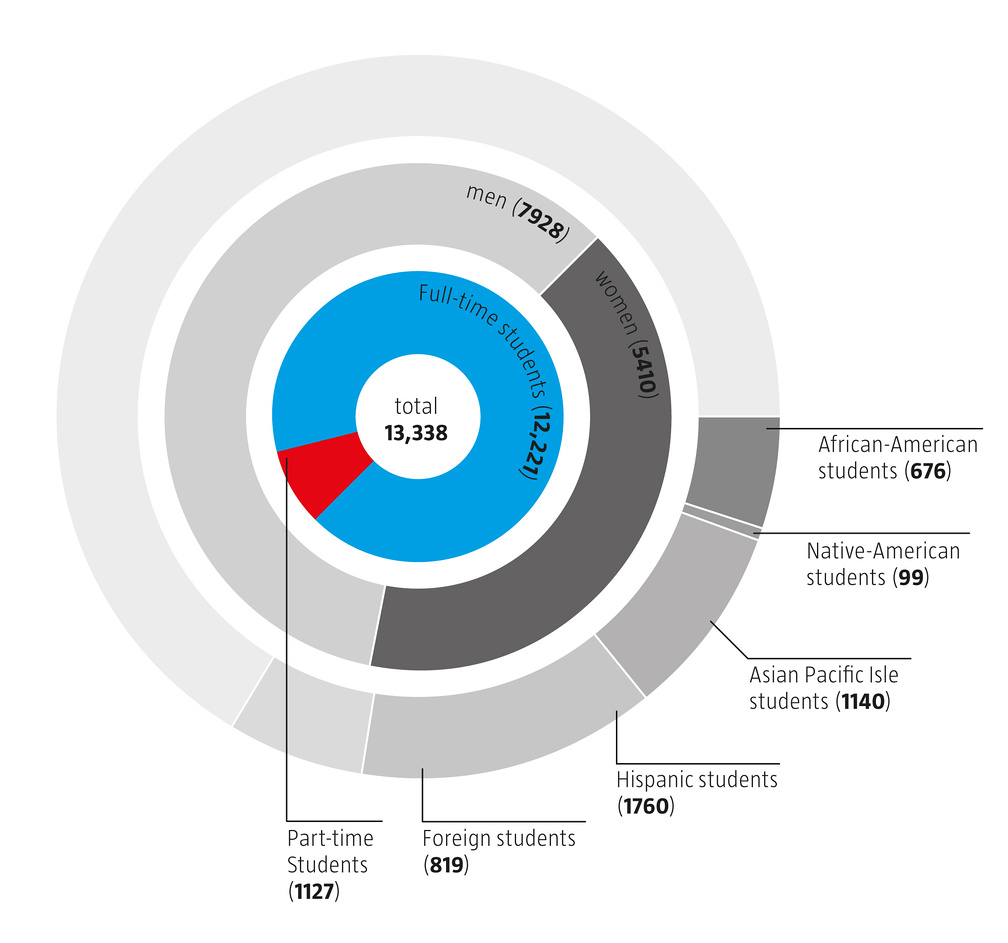
June 2008 – Graphic for the artist Reona Ueda, New York (US) showing the Top 1000 frequently occuring american surnames splitted in the six most common population groups. Published in NEWWORK Magazine issue #2.

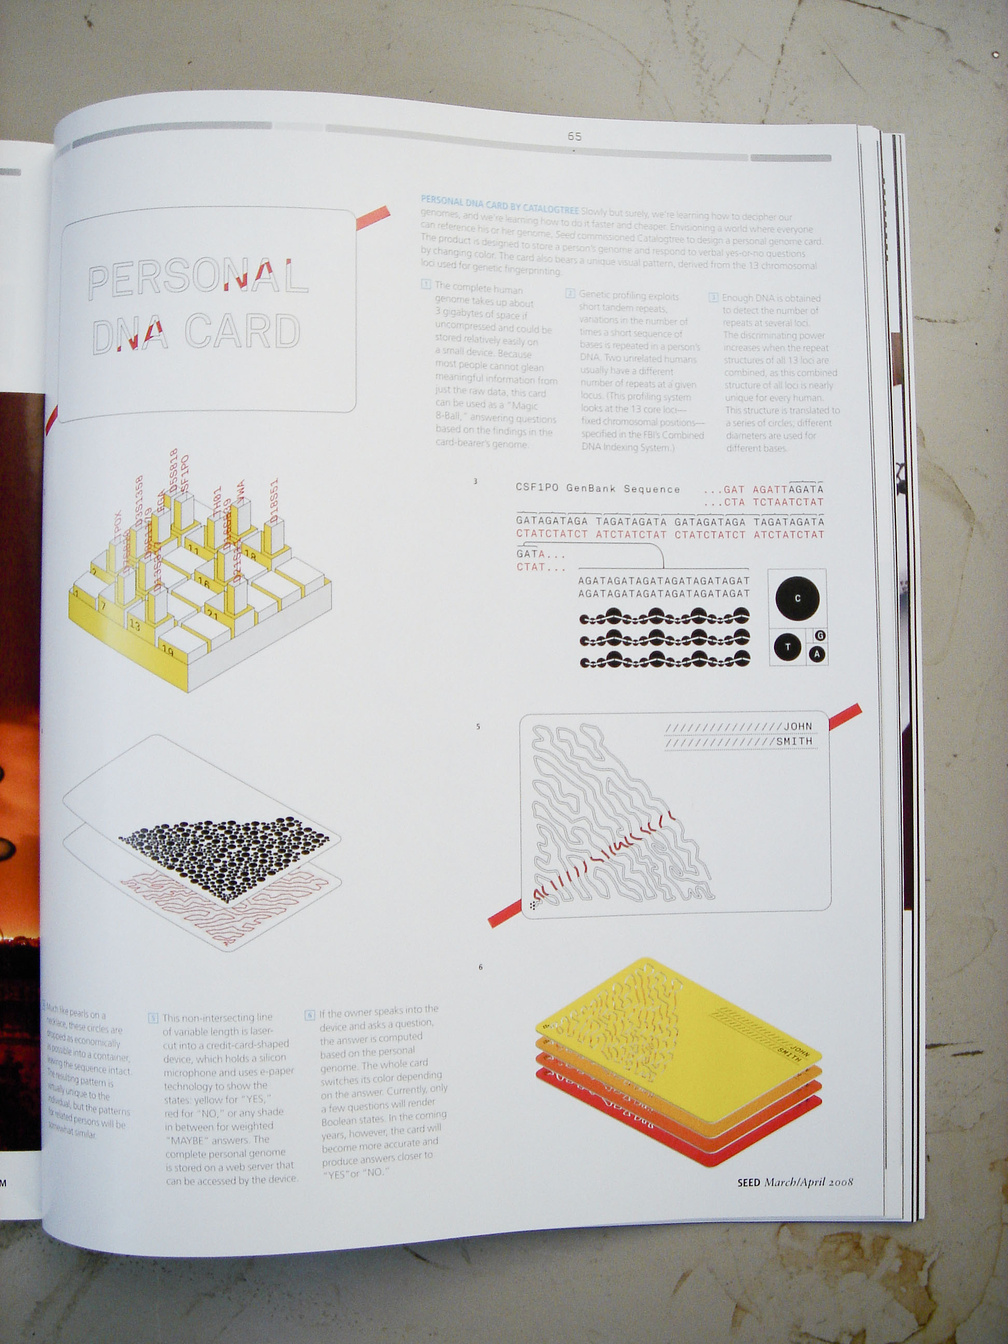
Personal DNA Card
March 2008 – Design for a personal DNA card, commissioned by SEED magazine, New York (US). A fingerprint is generated from the 13 core loci as used by the FBI for human identification. In collaboration with Lutz Issler (line script) .
January 2008 – Poster series on Parking Violations by Diplomats in New York City, 1997-2005. Thanks to Ray Fisman and Edward Miguel for kindly permitting us to use their data.
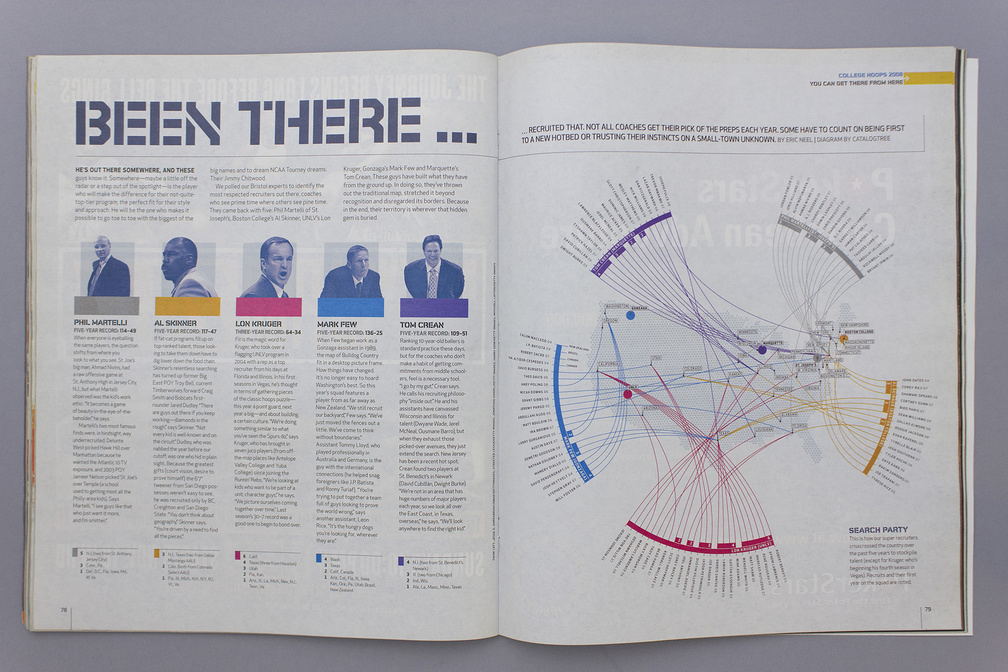
November 2007 – Infographic for ESPN the Magazine, Bristol (USA) showing origin of basketball talent. Recruits and their first year on the squad are noted.
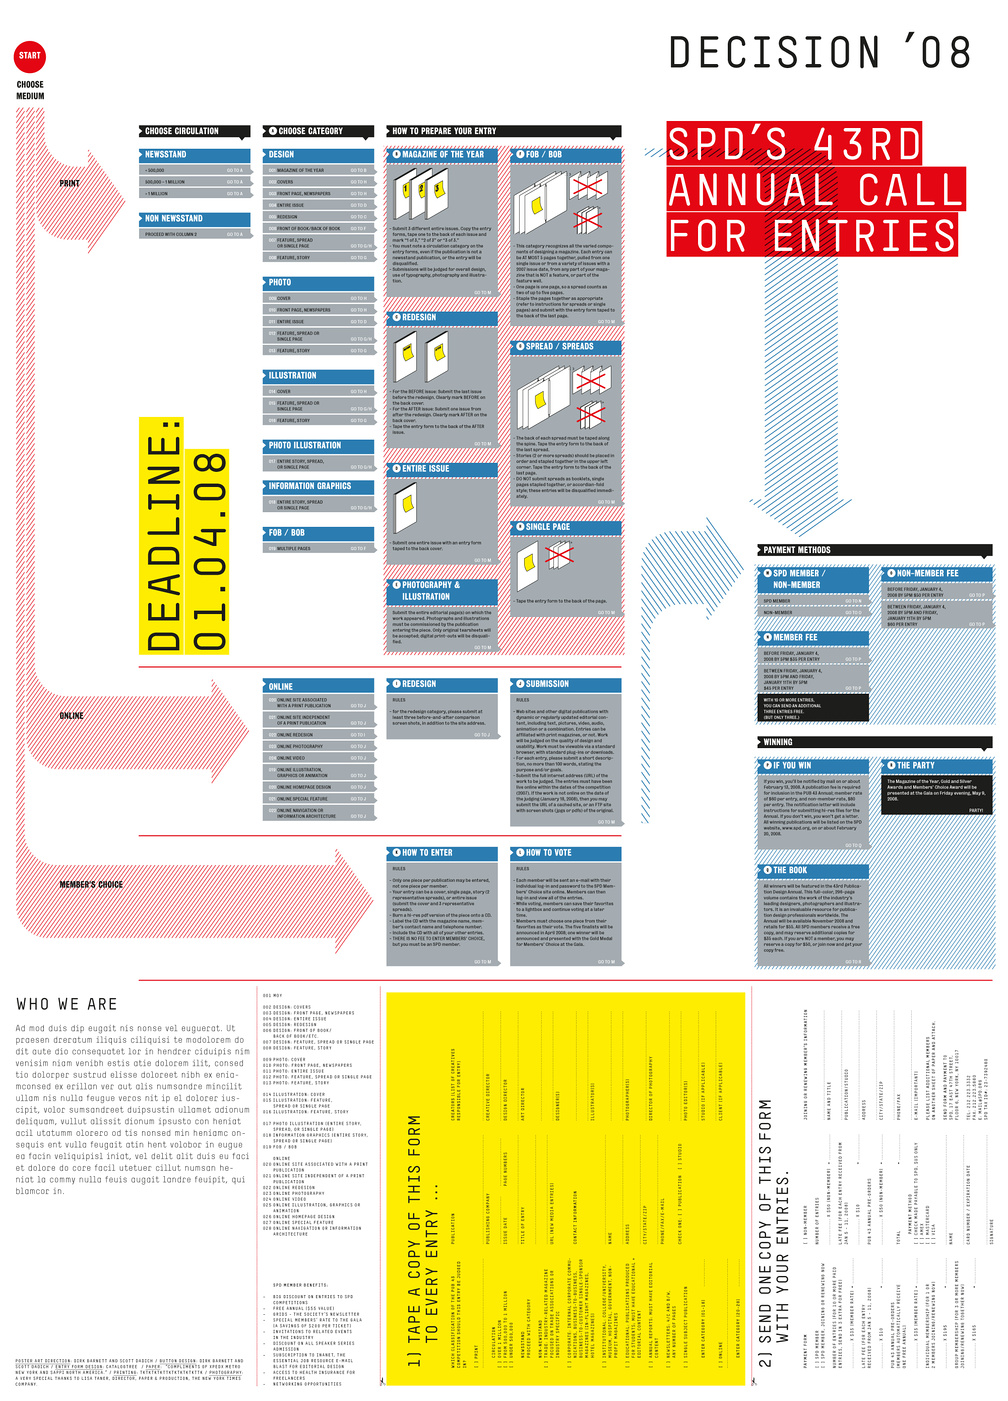
SPD's 43rd Annual Call for Entries
November 2007 – Entry form design for SPD's 43rd Annual Call for entries. Poster design by Dirk Barnett and Scott Daddich.
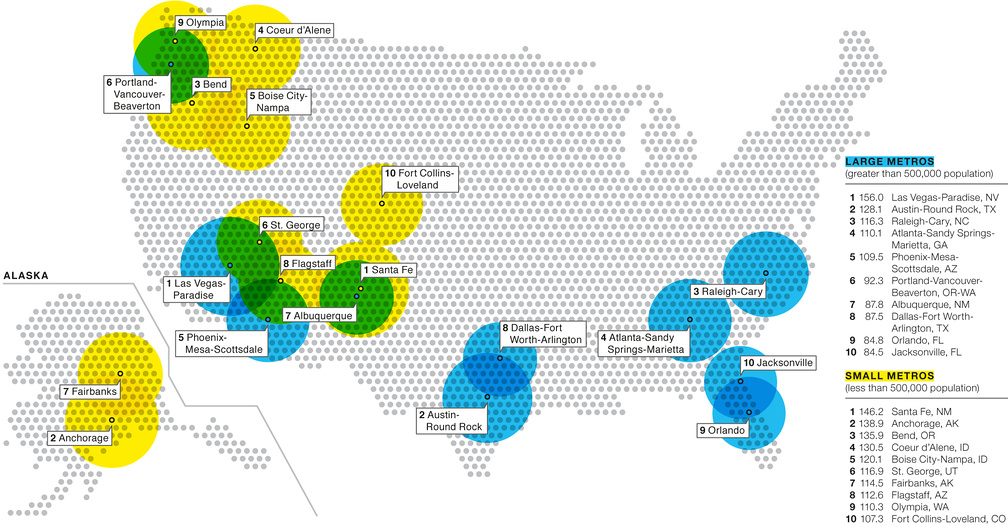
Where the retirees will be
October 2007 – Chart for Key, the New York Times Real Estate Magazine showing cities in the U.S. with a high percentage of retirees.
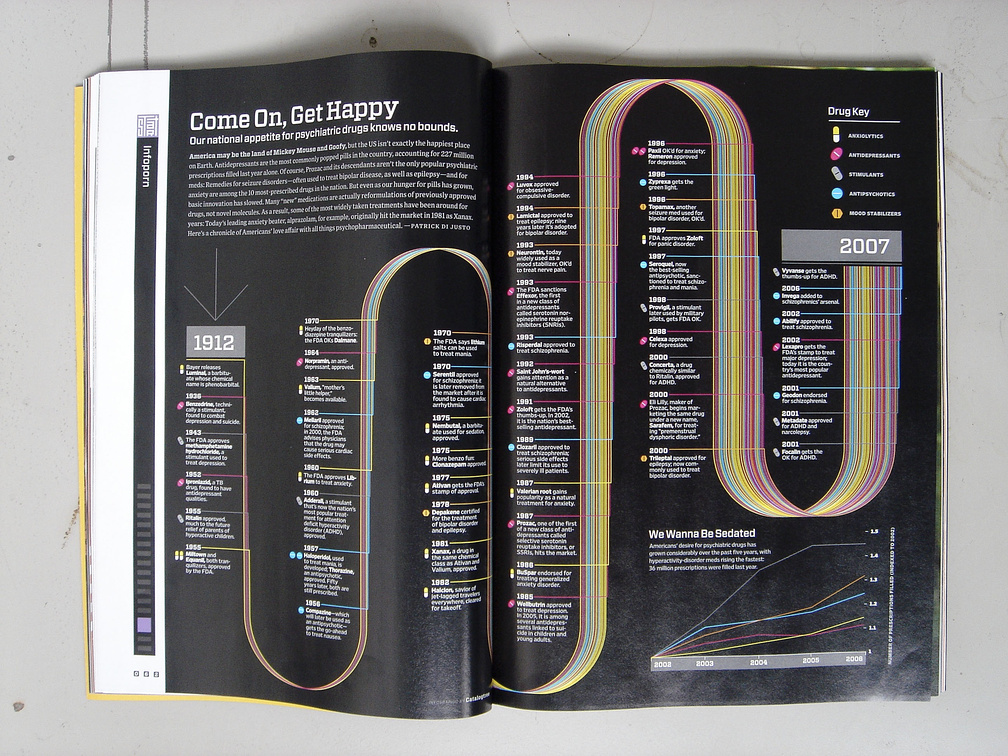
Come on, get happy
September 2007 – Infographic for the infoporn column of WIRED magazine showing the rise of psychiatric drugs over the last 95 years.
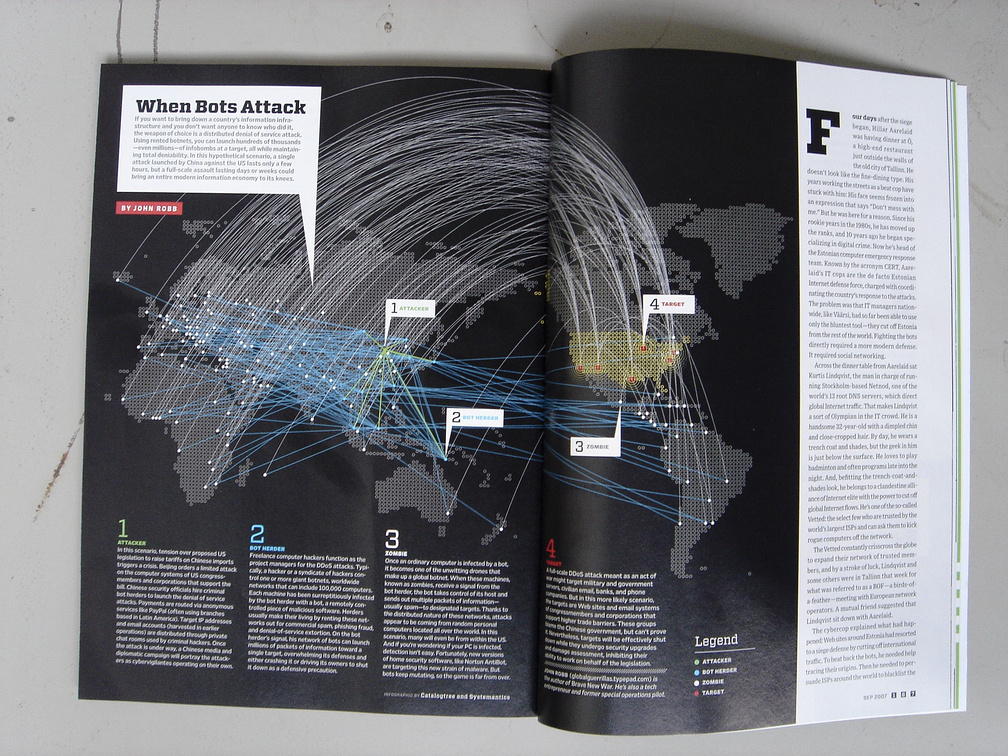
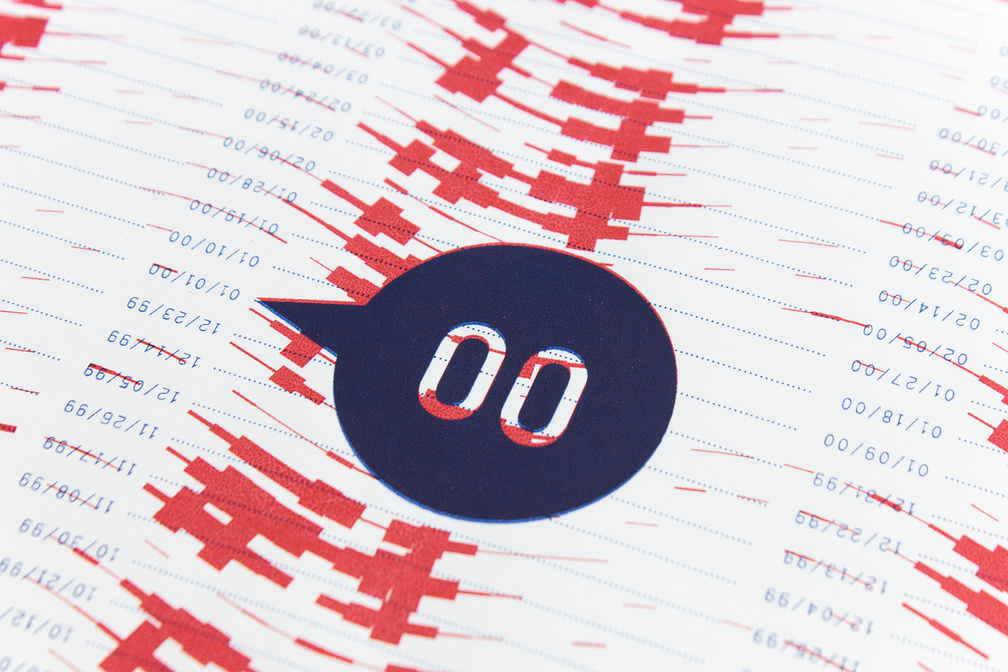
When bots attack
September 2007 – Illustration for WIRED magazine about a fictive DDoS (Distributed Denial of Service) attack on the US. In collaboration with Lutz Issler (postscripting) .
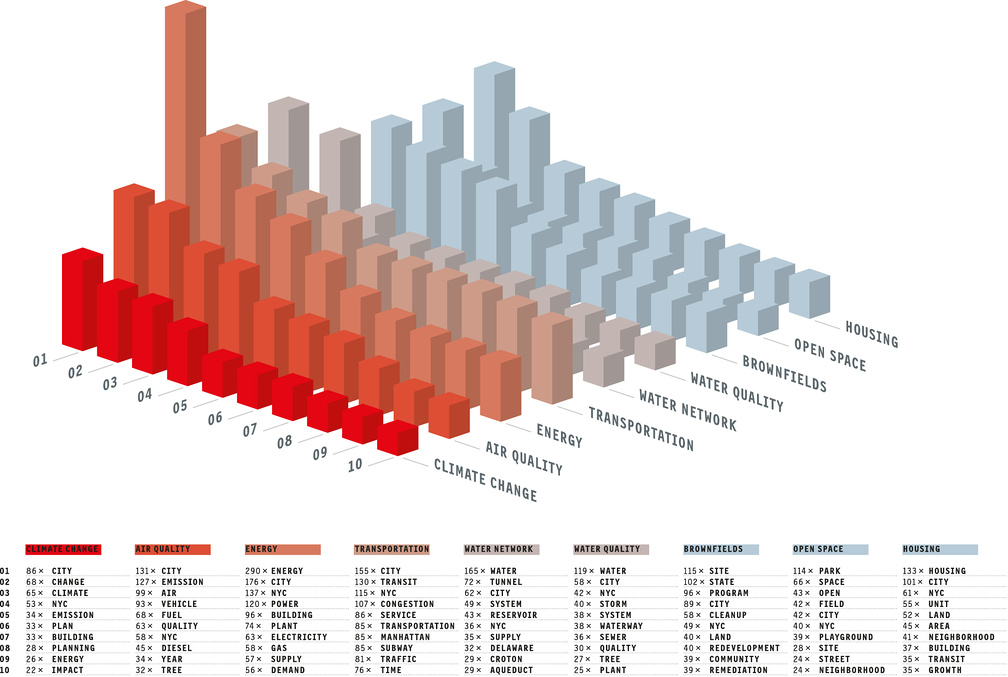
PLANYC
July 2007 – Illustration made for Metropolis magazine, New York (US). Based on an analysis of the number of occurences of each noun, one data set for every chapter of the whole PLANYC was visualized. In collaboration with Lutz Issler (text statistic) .
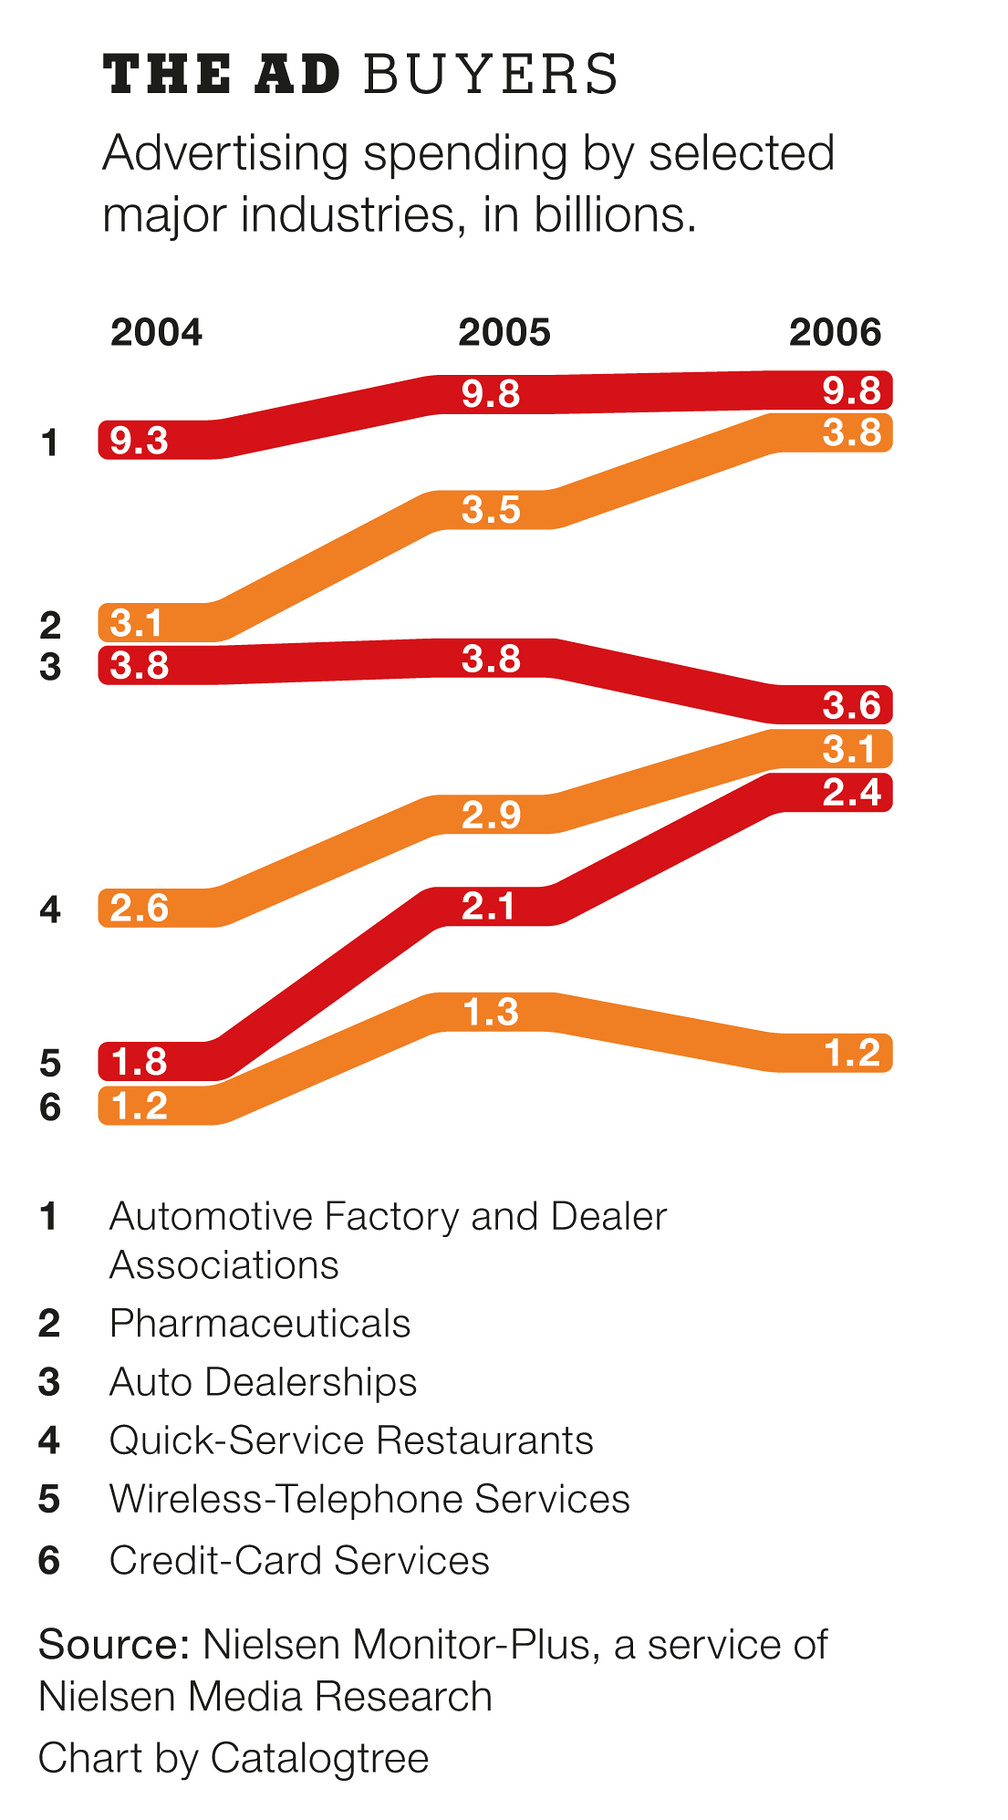
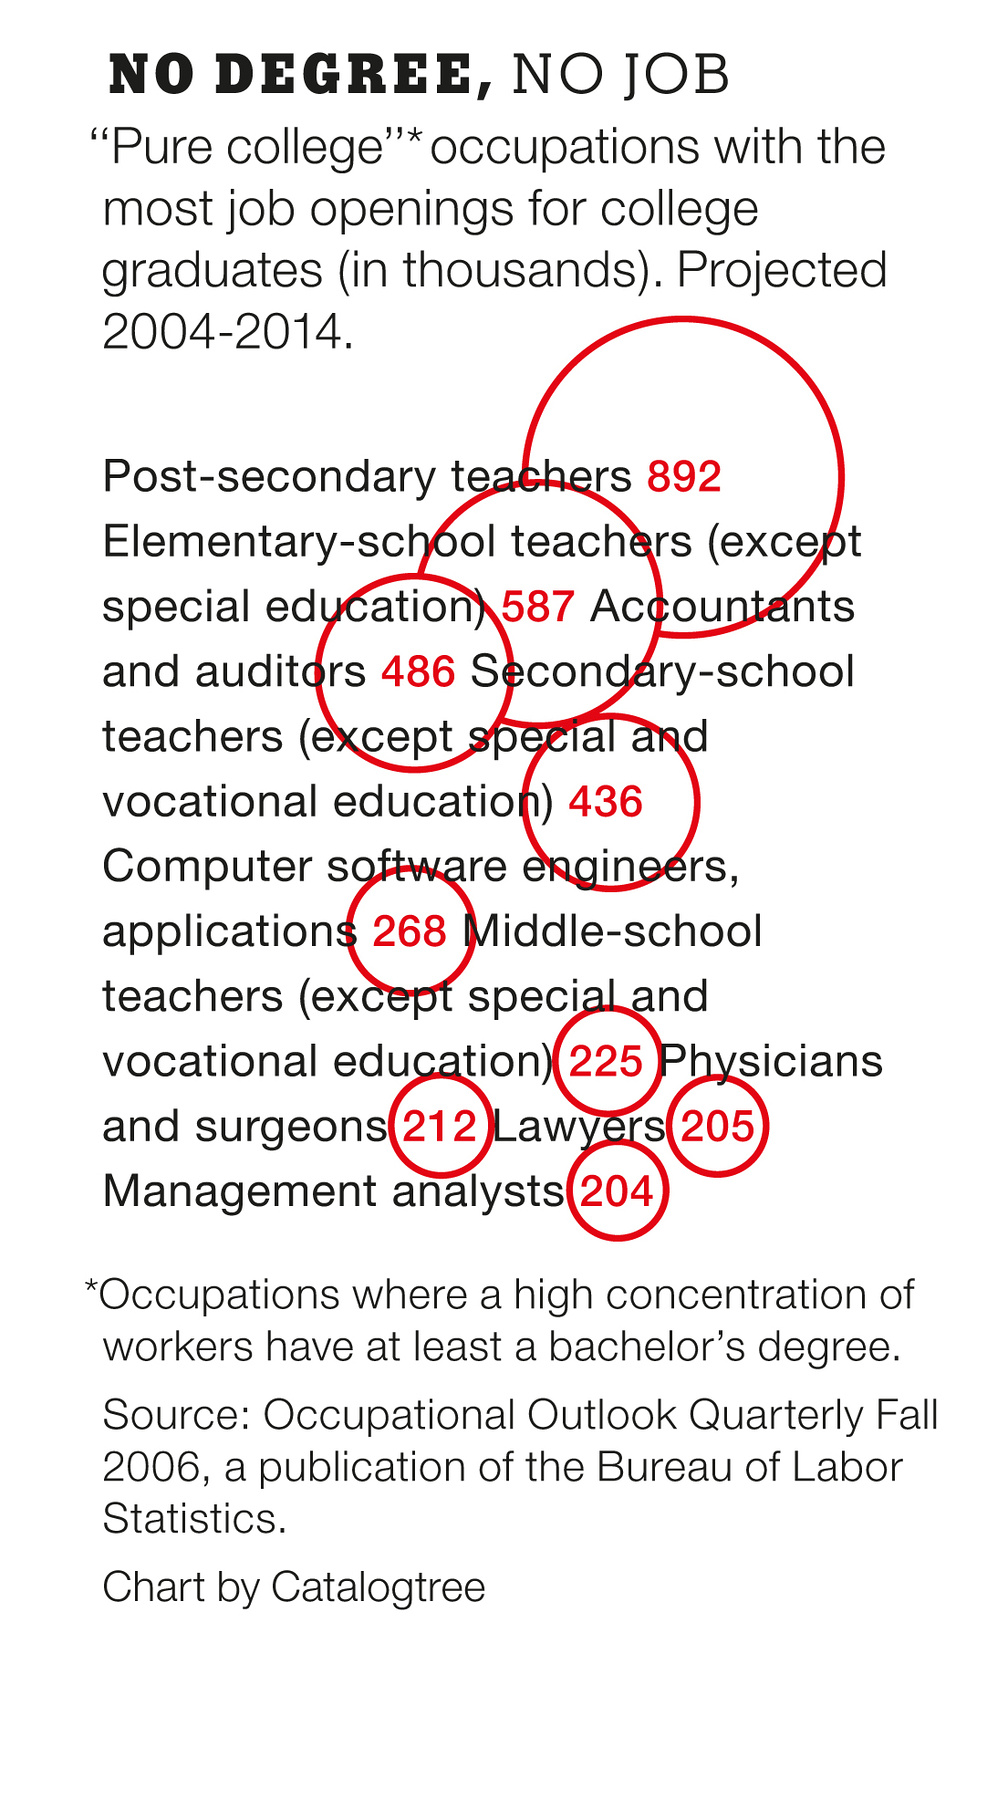
June 2007 – Series of Infographics for 'The Way We Live Now' column of New York Times Magazine, New York (US) from January to June 2007.
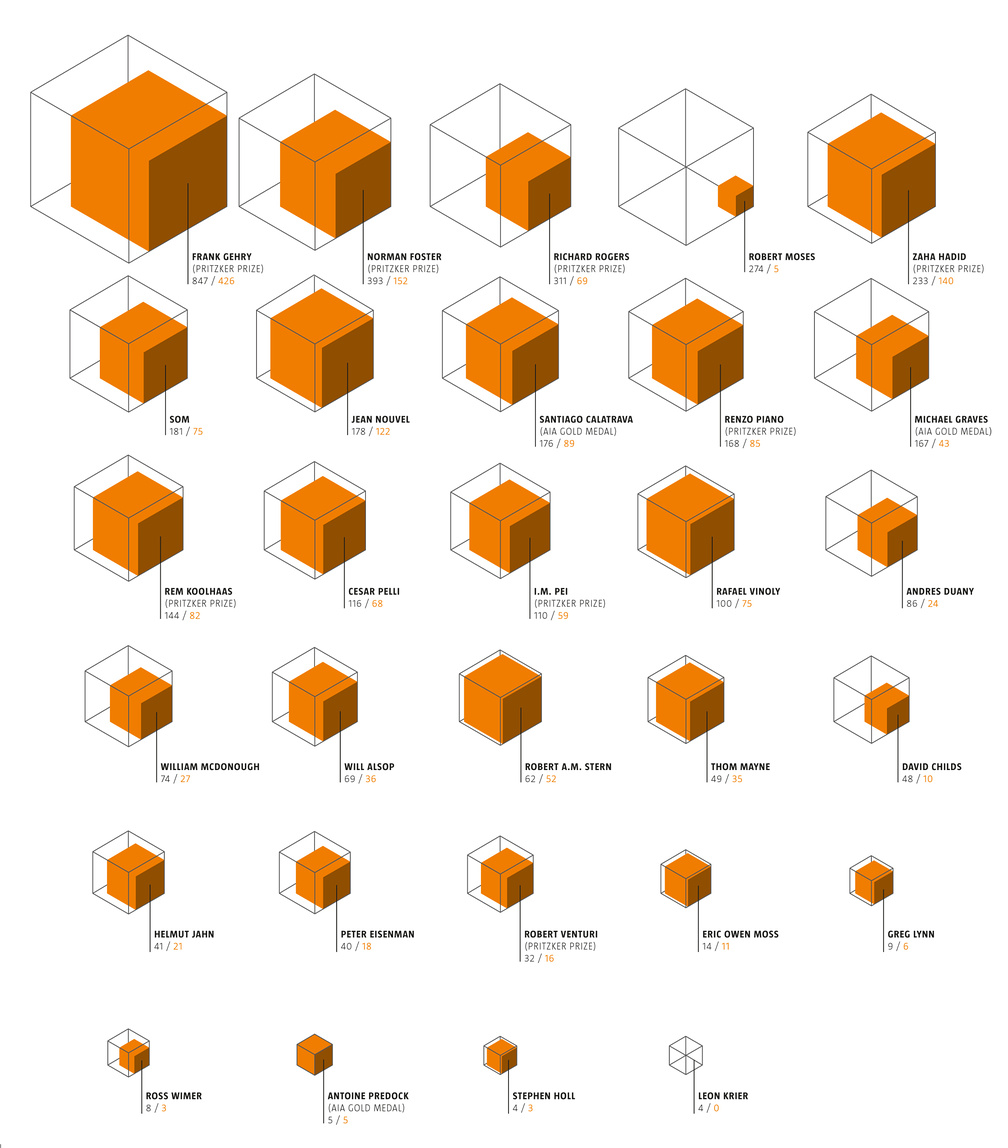
May 2007 – Charts for Architect Magazine, Washington D.C. (US) on how architectural power is measured and honored.
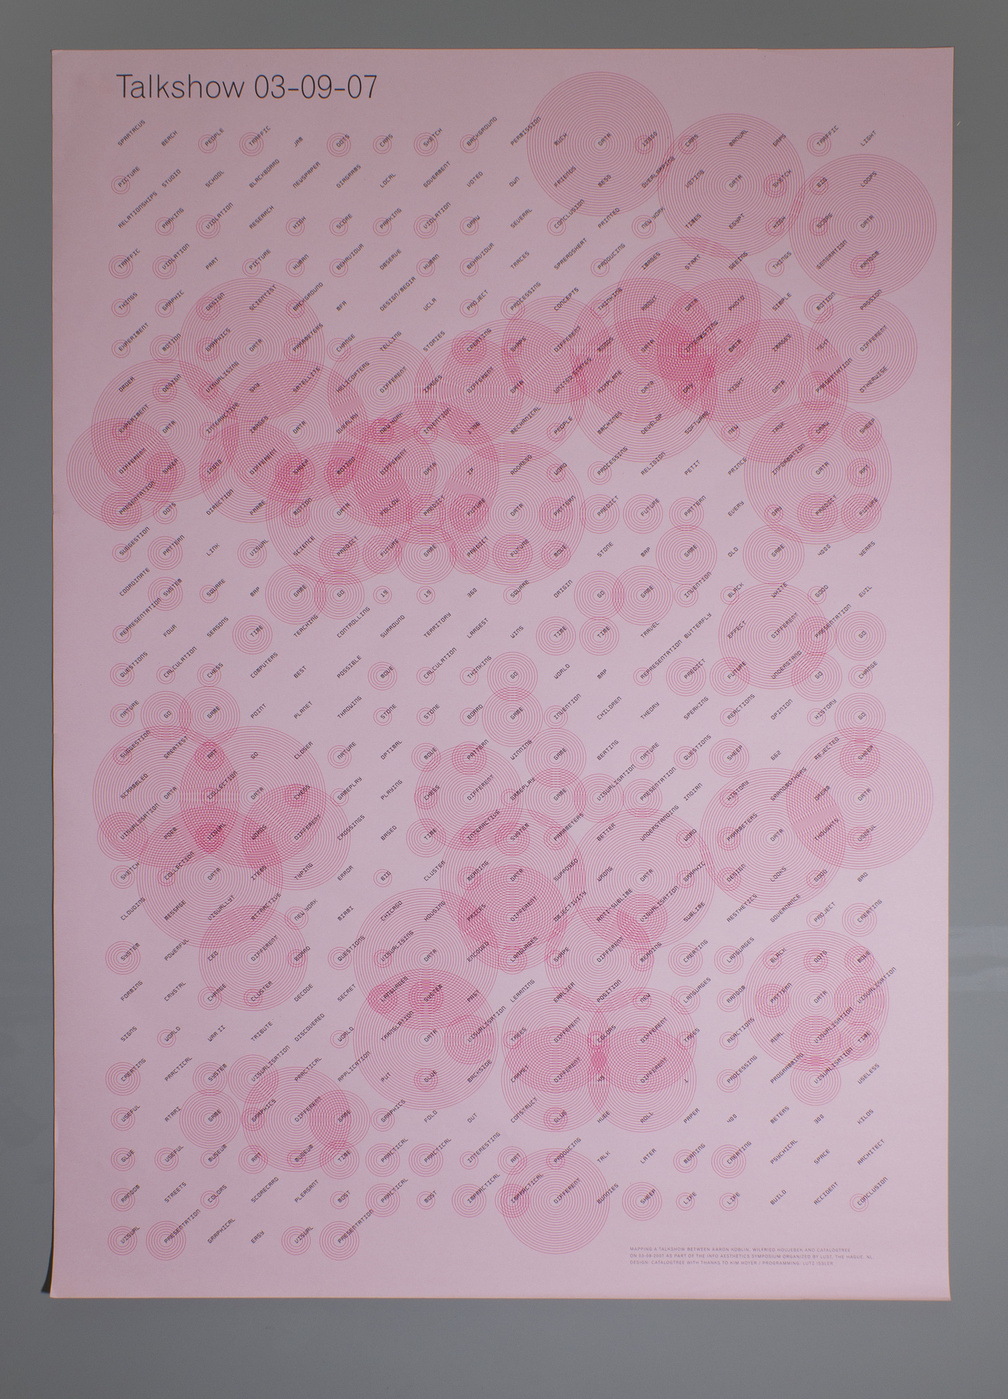
May 2007 – Mapping a talkshow with Aaron Koblin, Wilfried Houjebek and Catalogtree on 03-09-2007 as part of the Info Aesthetics Symposium organized by LUST, The Hague (NL).
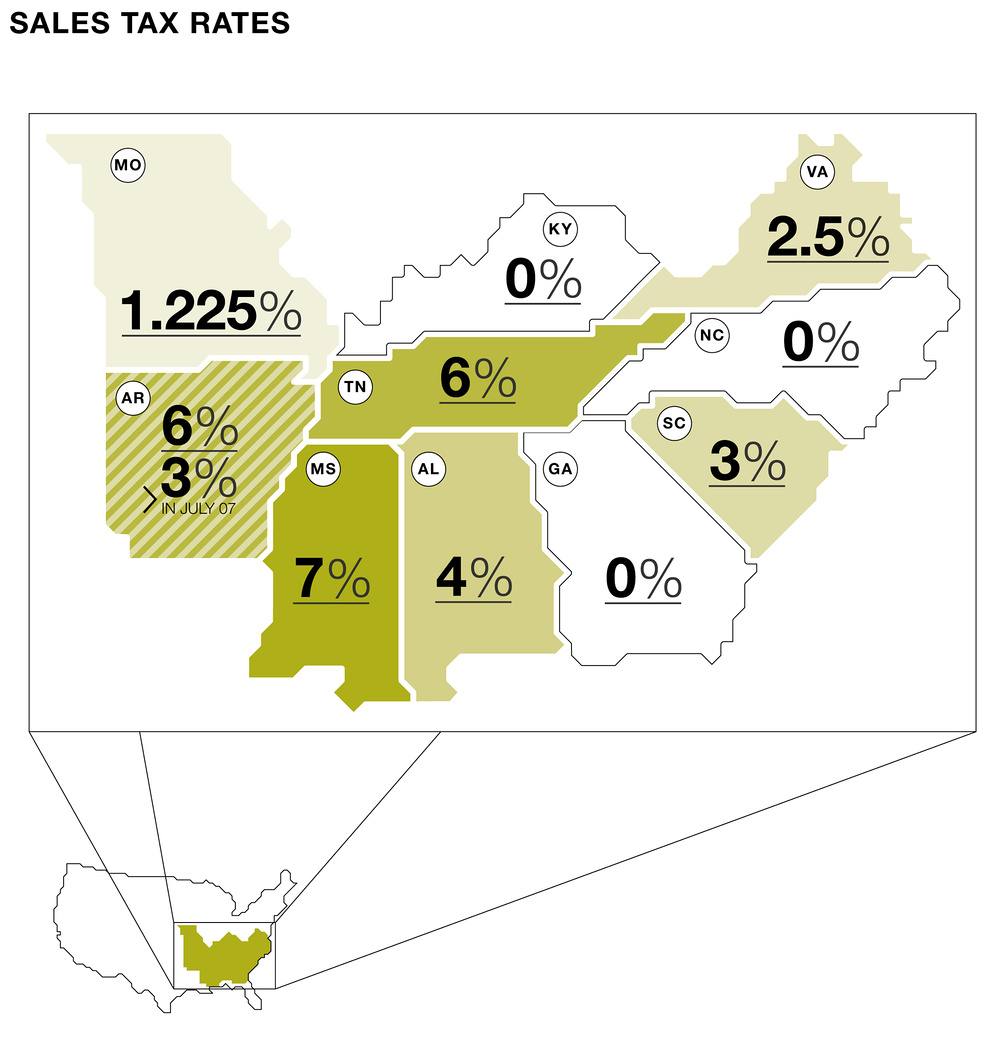
Sales Tax Rates
April 2007 – Chart for the alternative newspaper Knoxville Voice, showing tax on bread-prices per state.
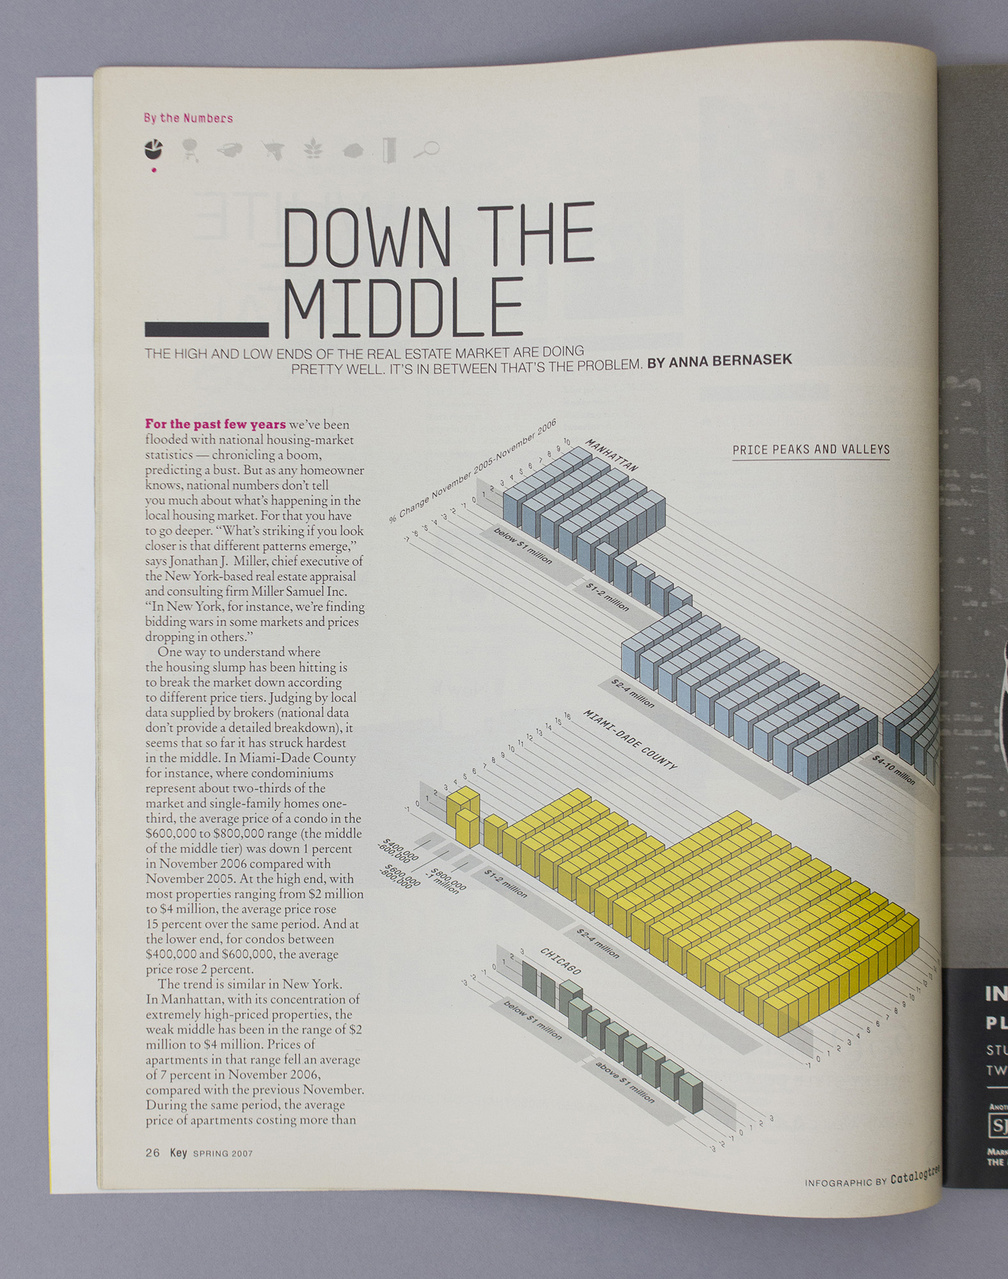
Down the Middle
March 2007 – Chart for Key, the New York Times Real Estate Magazine about local housing markets in the U.S.
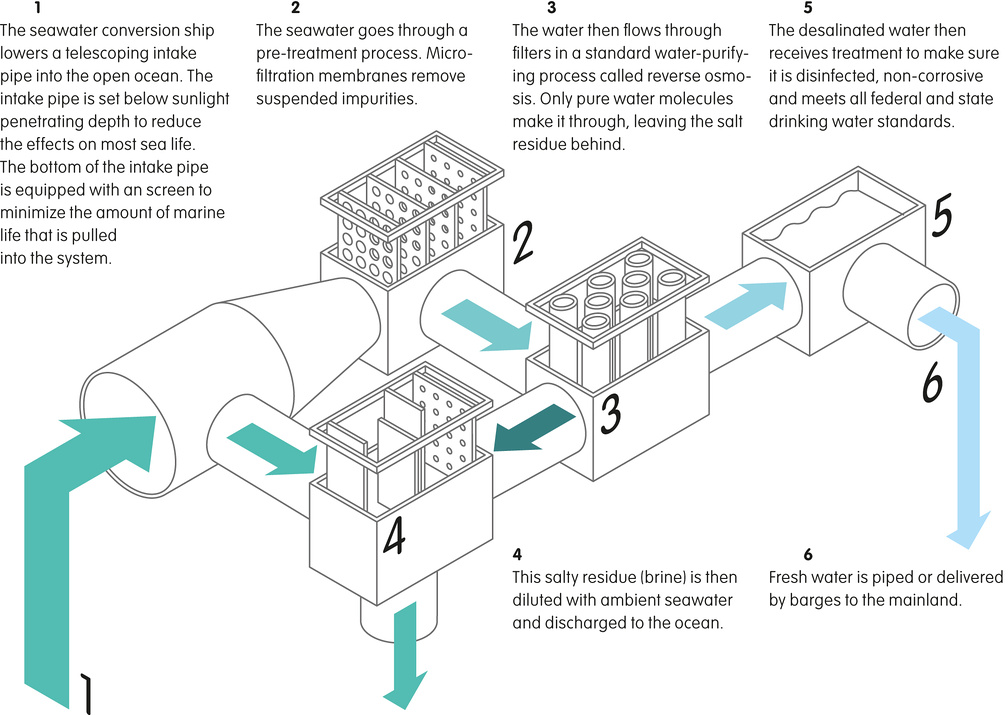
Desalination
March 2007 – Diagram showing the process of desalinating seawater for Condé Nast Portfolio magazine, New York (US).
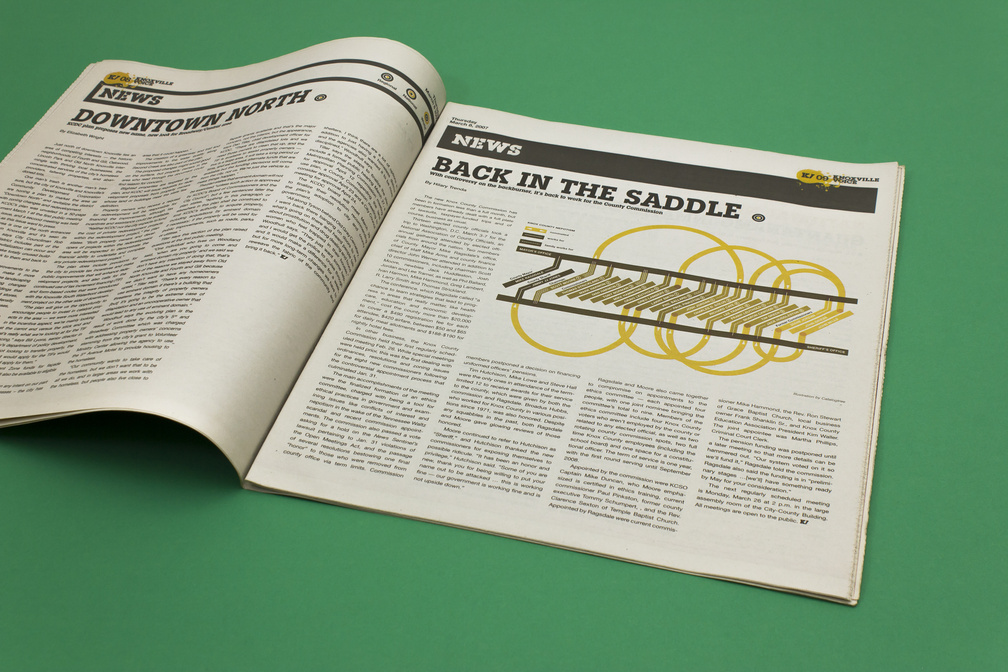
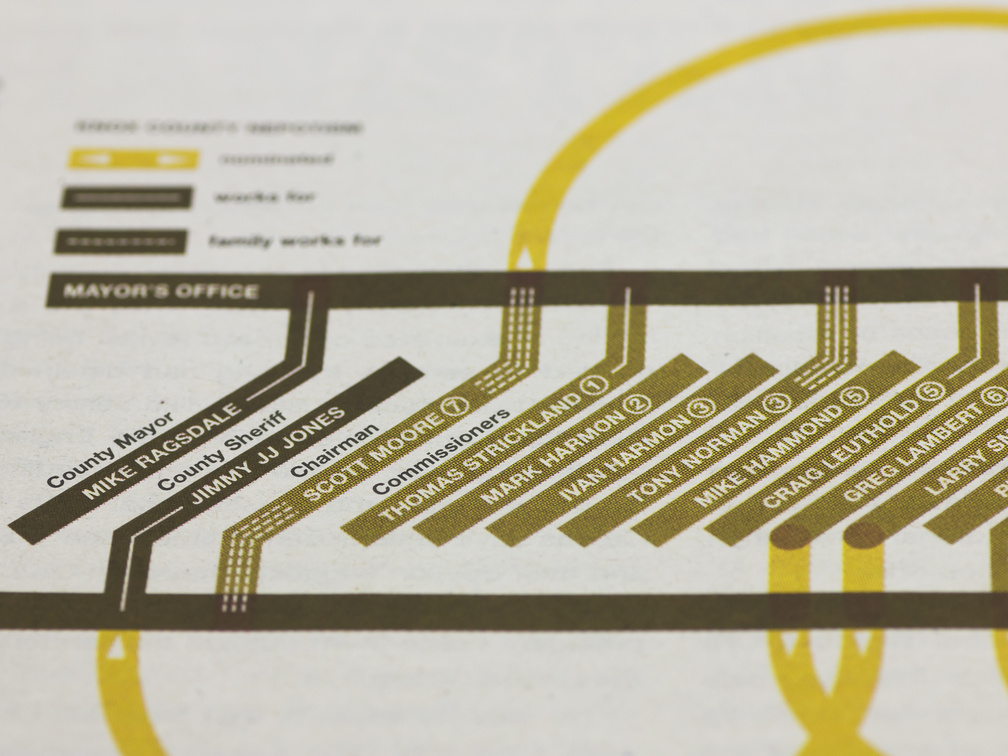
Knoxcounty Nepotism
February 2007 – Chart for the alternative newspaper Knoxville Voice, showing family ties between Knoxcounty employees.
December 2006 – Infographics for 'The 6th Annual in Ideas' in The New York Times Magazine, New York (US).
November 2006 – 'Werken aan de naoorlogse stad' by Endry van Velzen and Willemijn Lofvers, a book about a research fellowship between 2002 and 2006.
transurban poster
September 2006 – Poster for the book 'Werken aan de naoorlogse stad' by Endry van Velzen and Willemijn Lofvers about a research fellowship between 2002 and 2006.
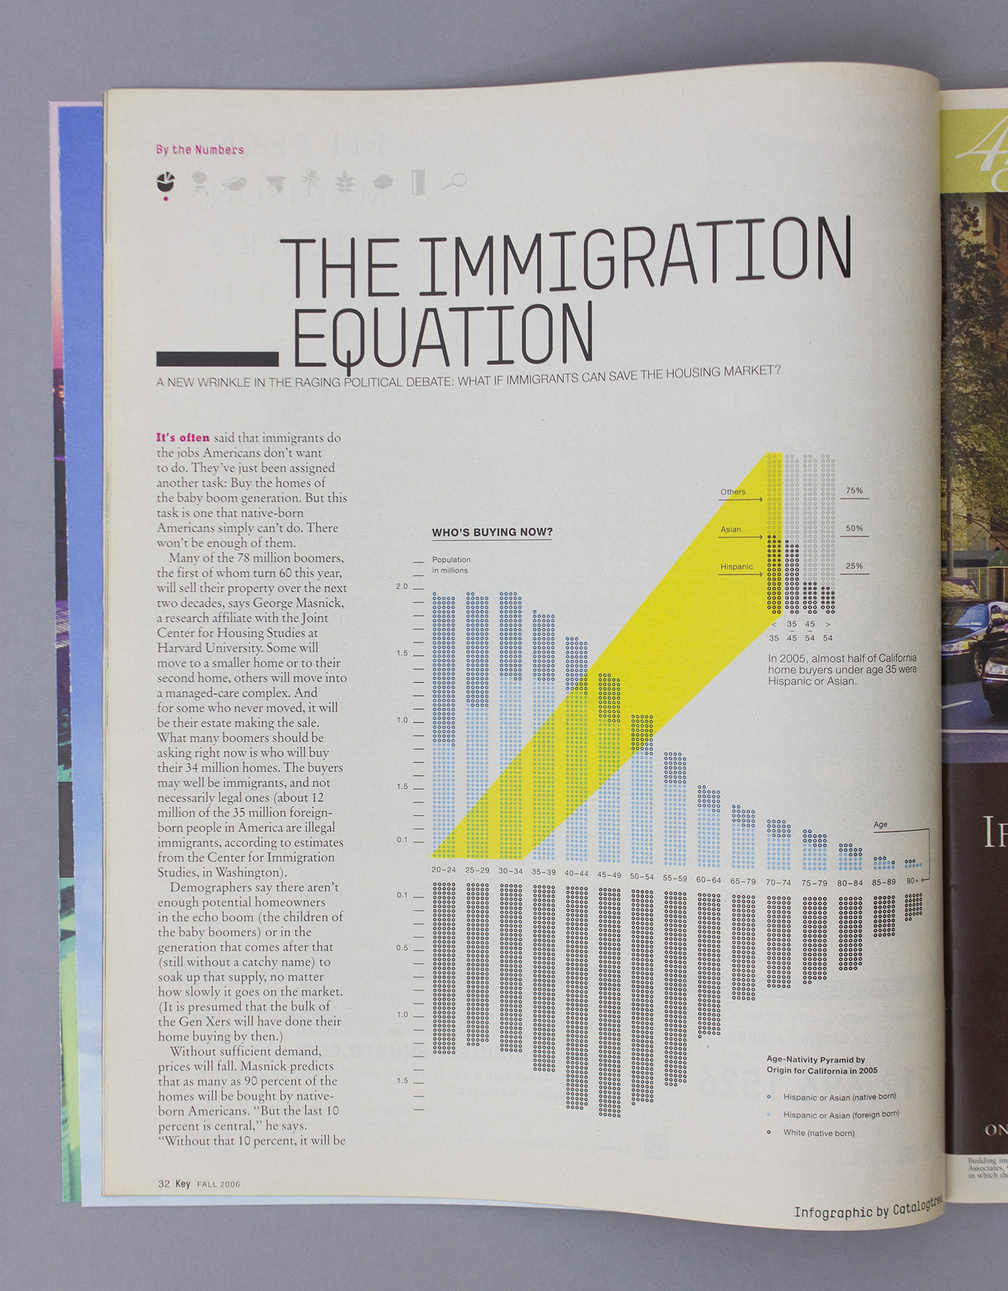
The Immigration Equation
August 2006 – Chart for the first issue of Key, the New York Times Real Estate Magazine about the influence of immigrants on the american housing market.