statistics
berlin temperature
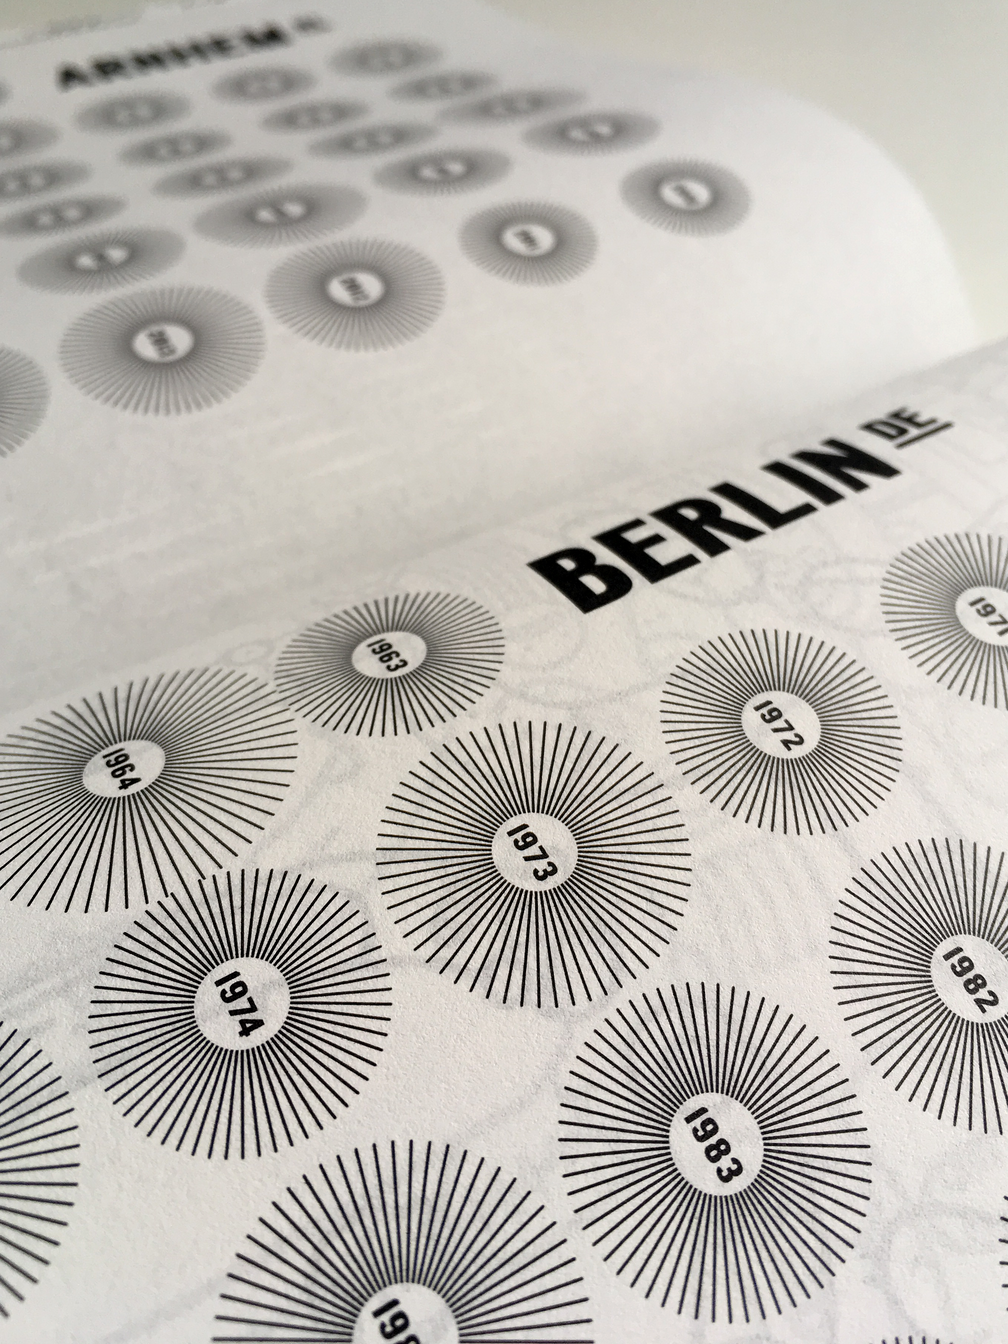
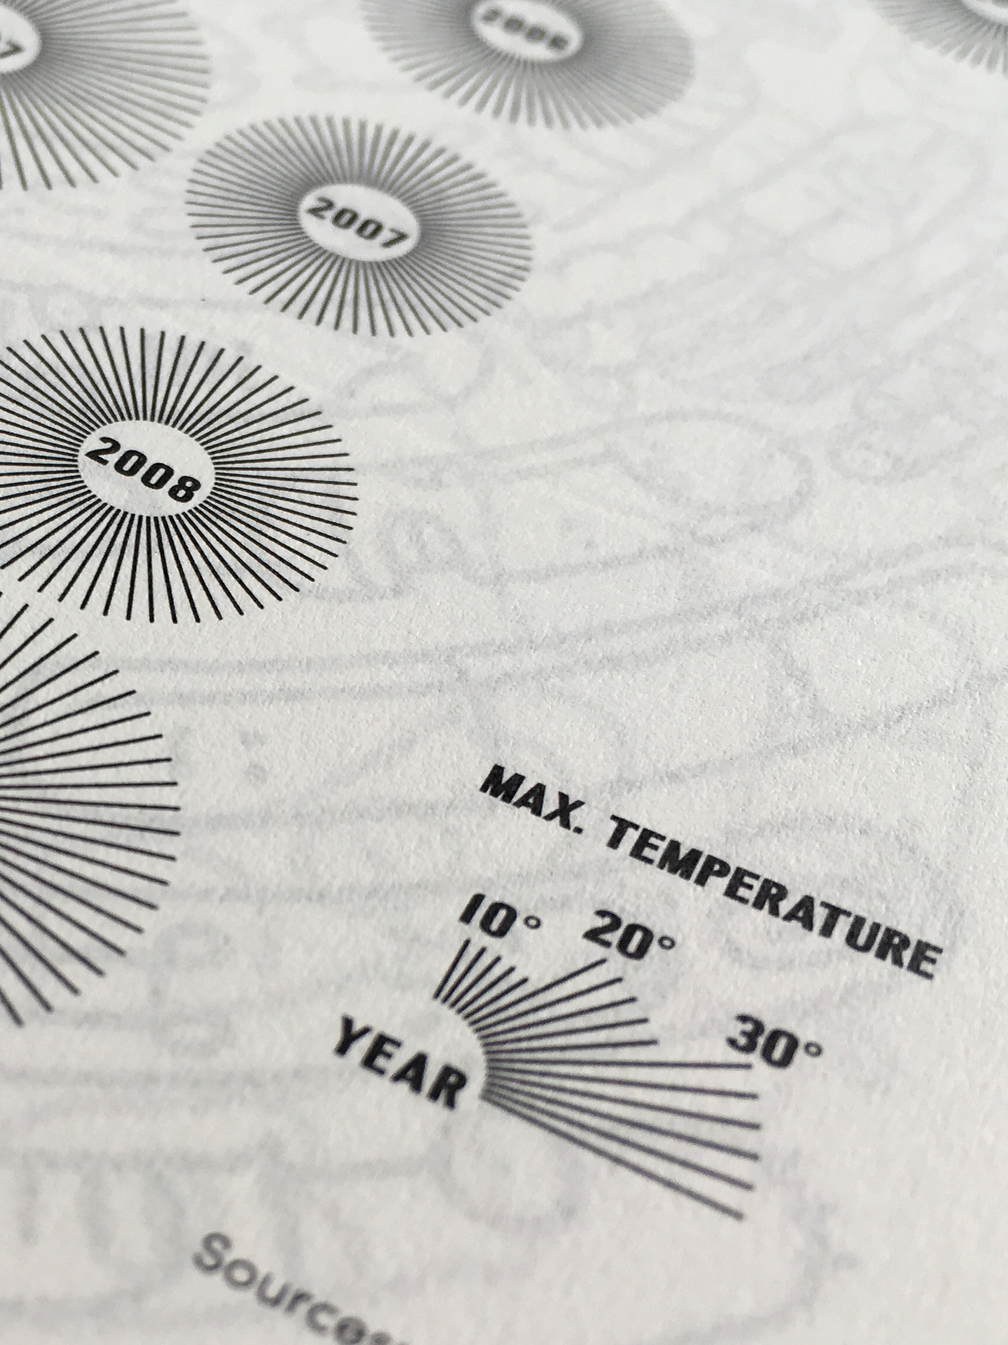
August 2017 – Visualization of the average temperature in Berlin / Arnhem on 28. August from 1963 to 2014.

July 2014 – Book Design of 'Landscape and Energy' for HNS landscape architects – a book about the effects of the transition from fossil fuels to renewable energy on our environment.
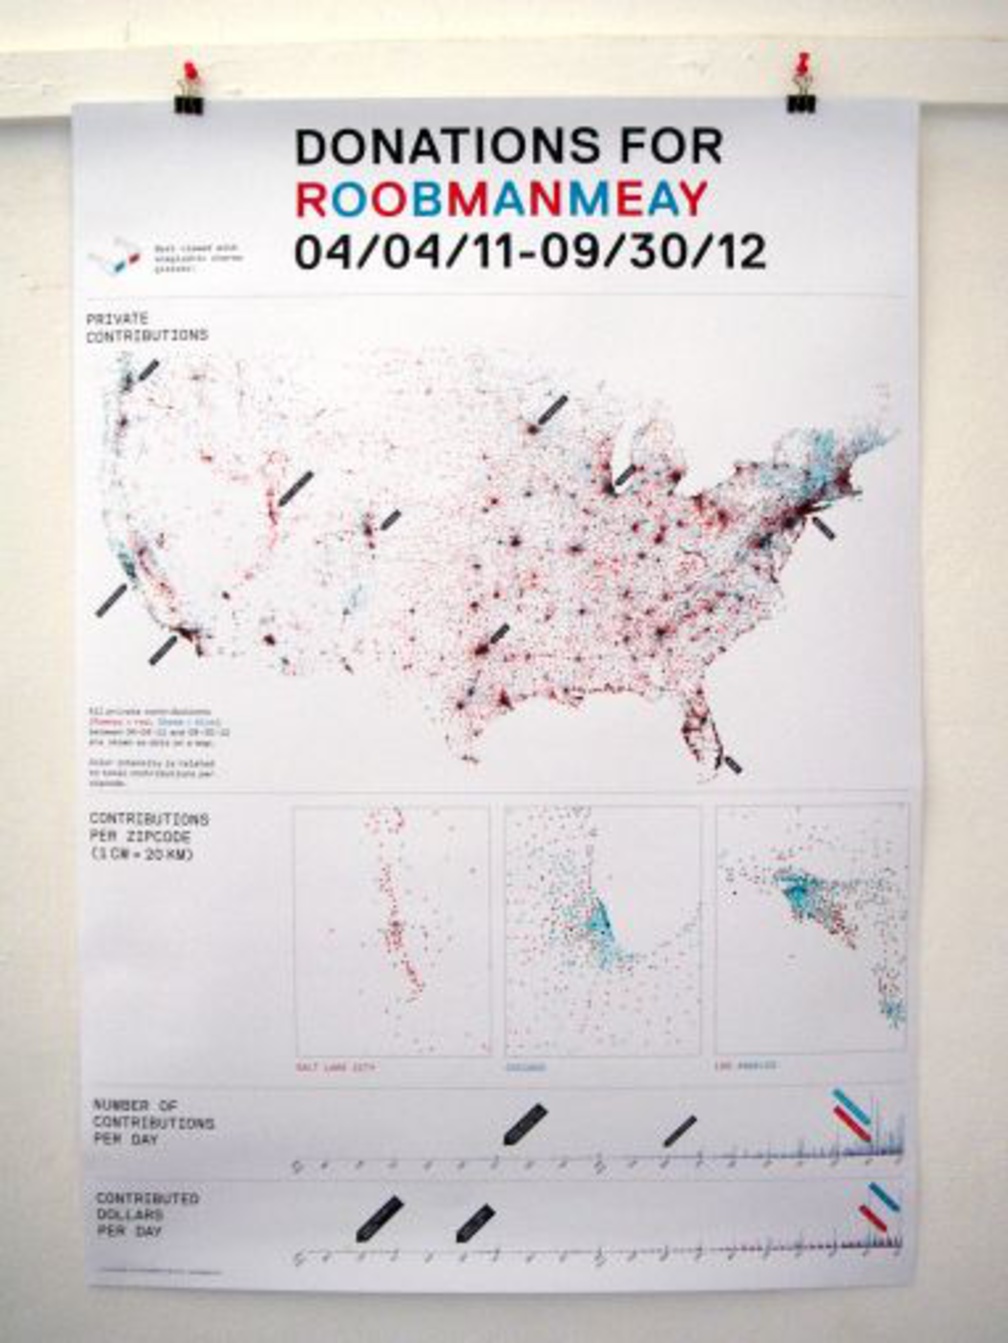
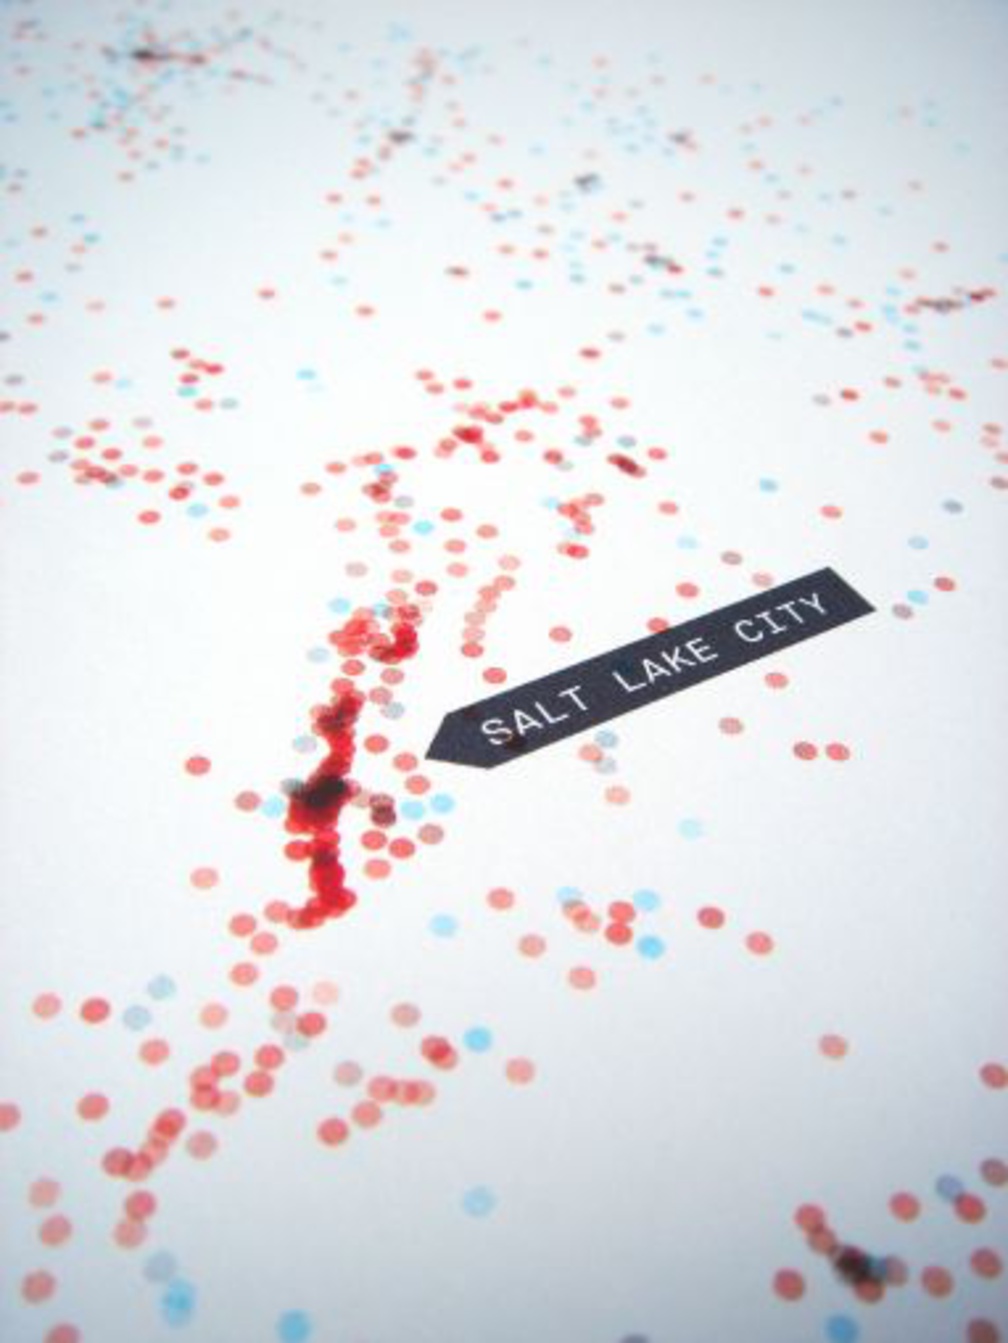
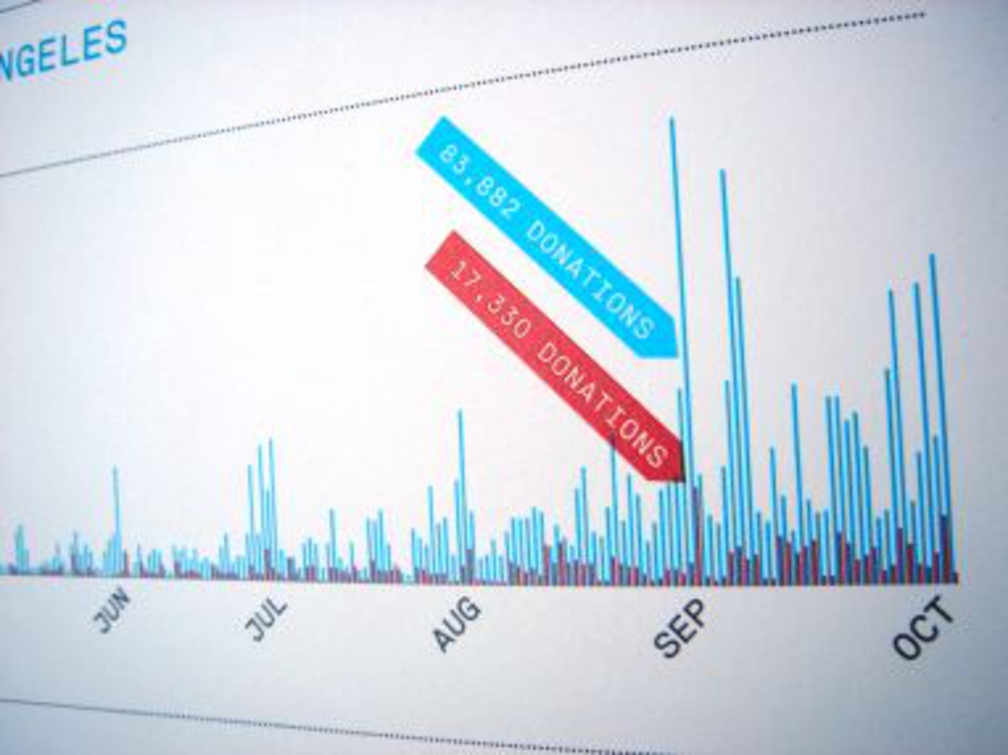
ROOBMANMEAY
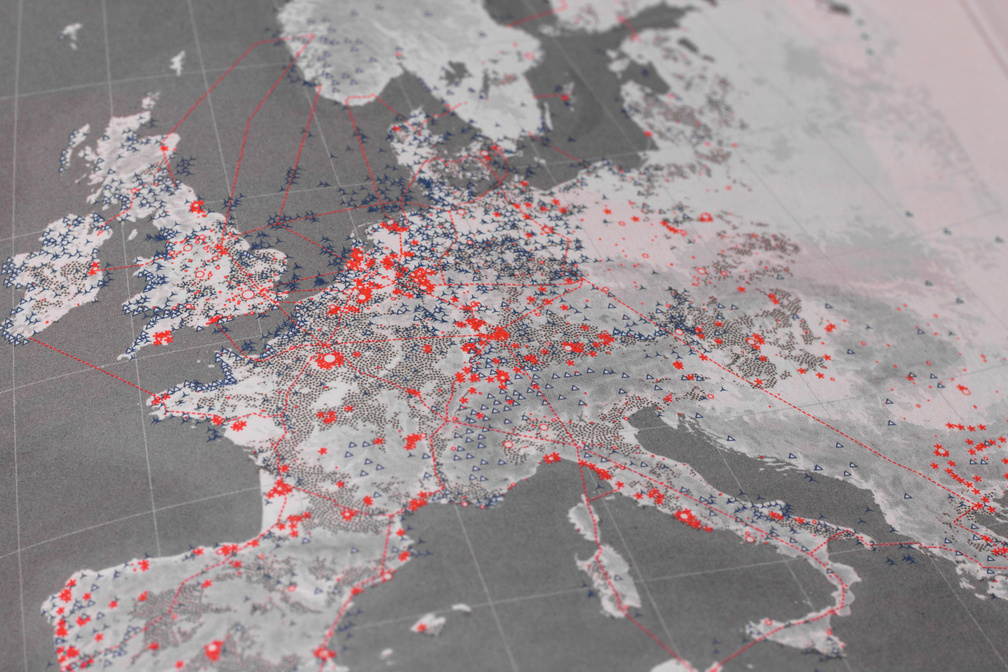
November 2012 – Poster showing about 3 million unique donations for either Barack Obama (blue) or Mitt Romney (red) between 04-04-2011 and 09-30-2012. Best viewed with anaglyphic stereo glasses. In collaboration with Systemantics (geocoding) .
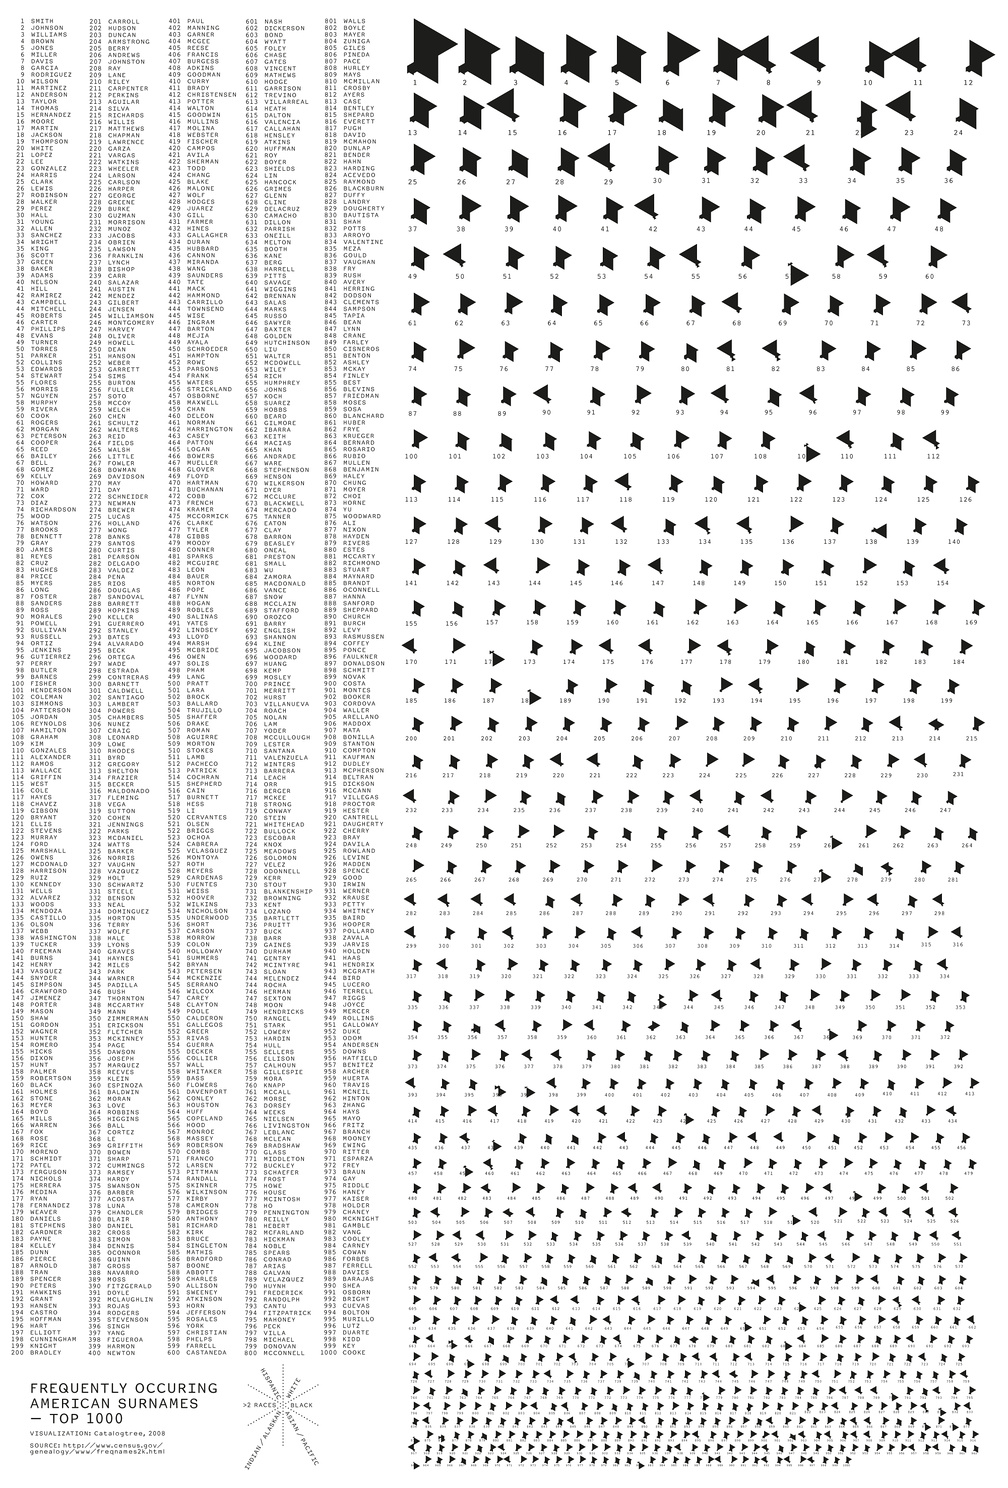
Frequently occuring american surnames
June 2008 – Graphic for the artist Reona Ueda, New York (US) showing the Top 1000 frequently occuring american surnames splitted in the six most common population groups. Published in NEWWORK Magazine issue #2.
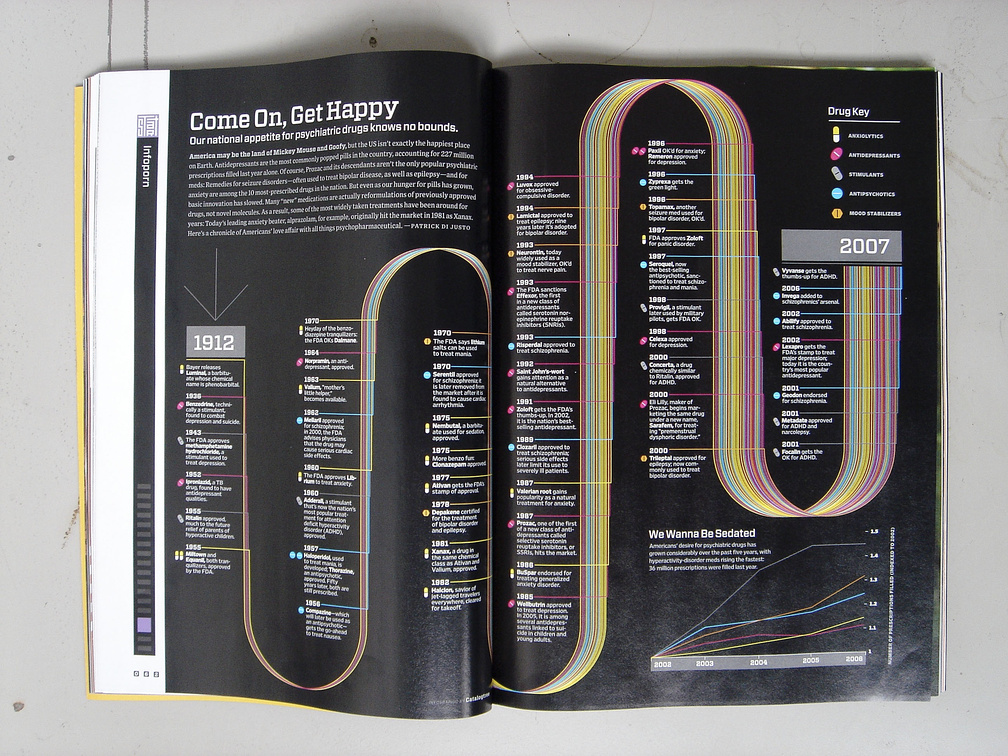
Come on, get happy
September 2007 – Infographic for the infoporn column of WIRED magazine showing the rise of psychiatric drugs over the last 95 years.