map
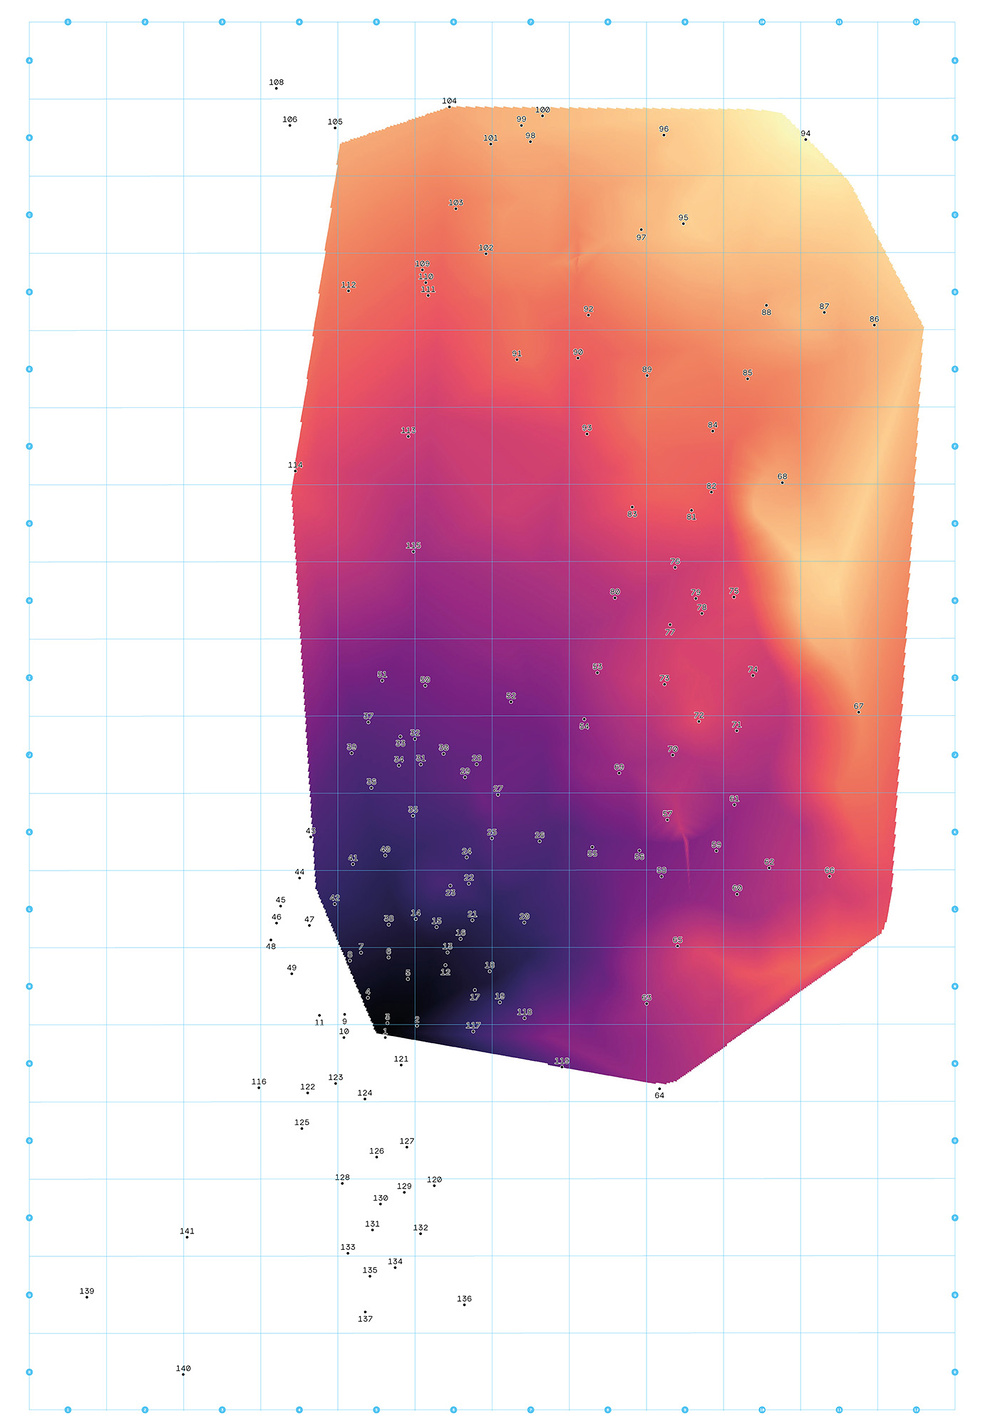
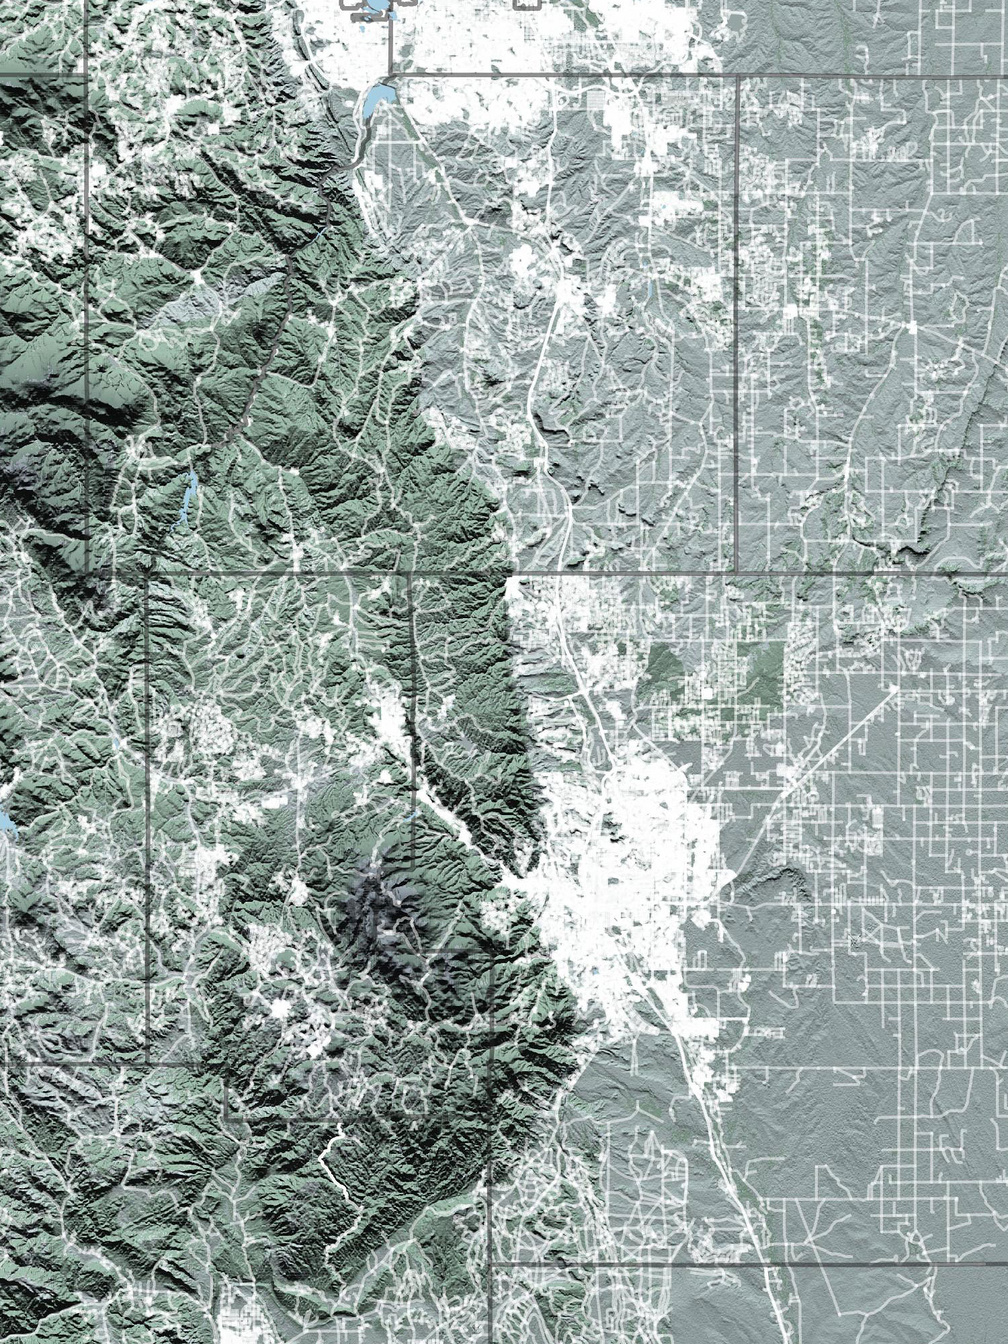
Kröller Müller Heatmap
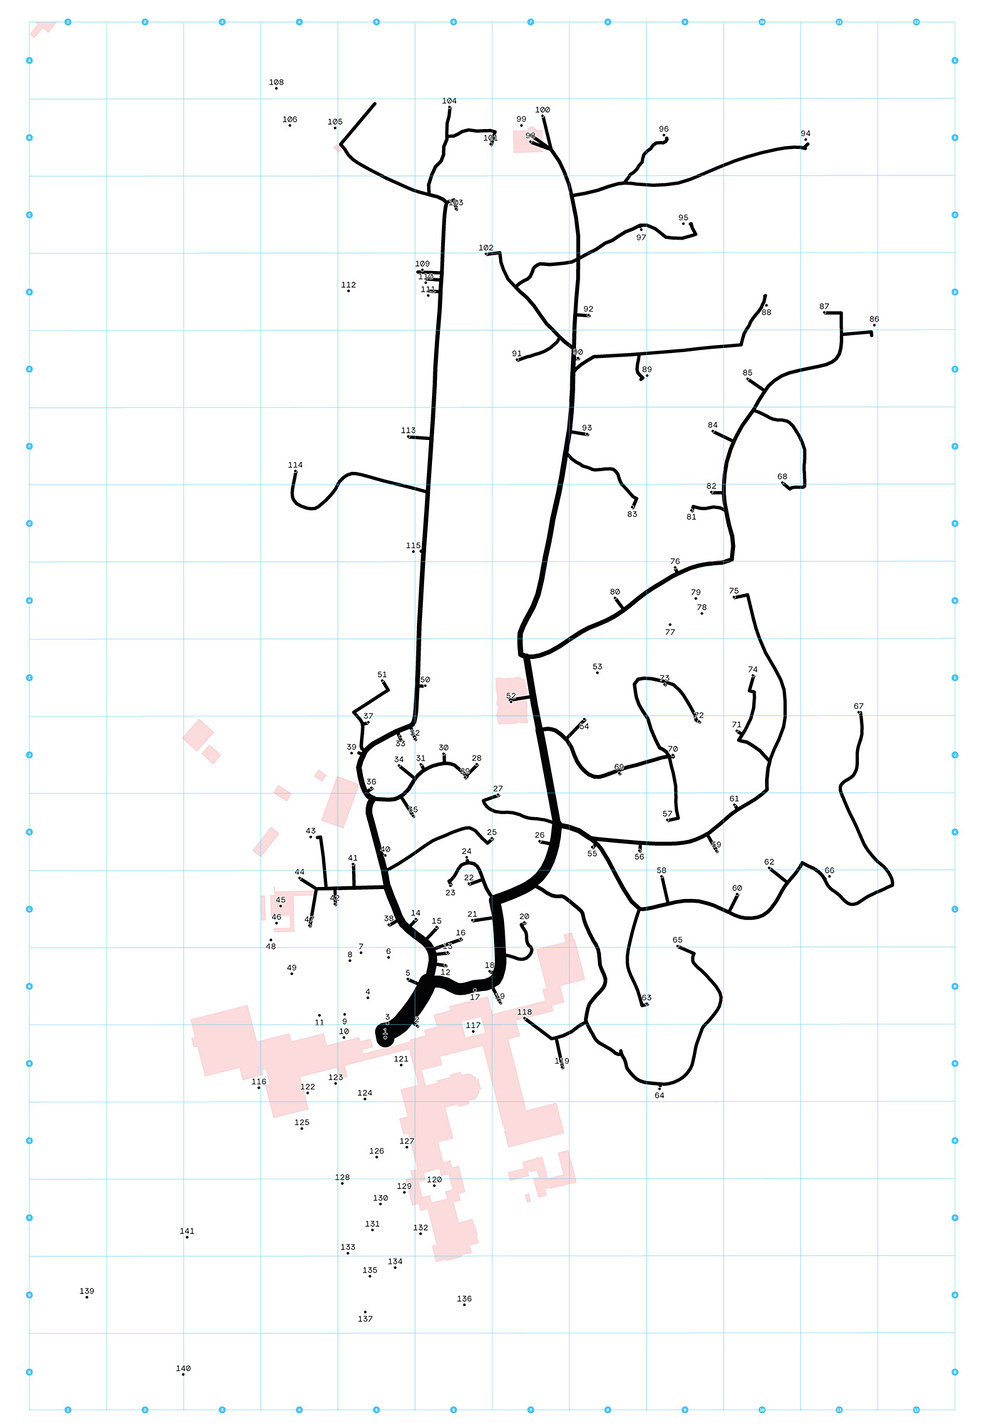
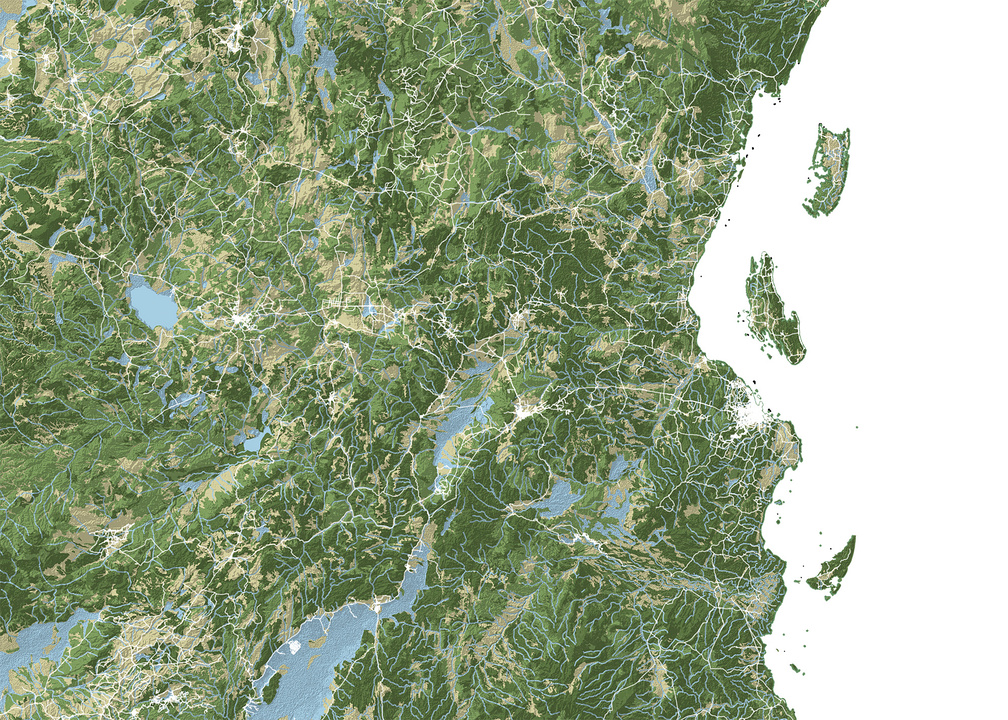
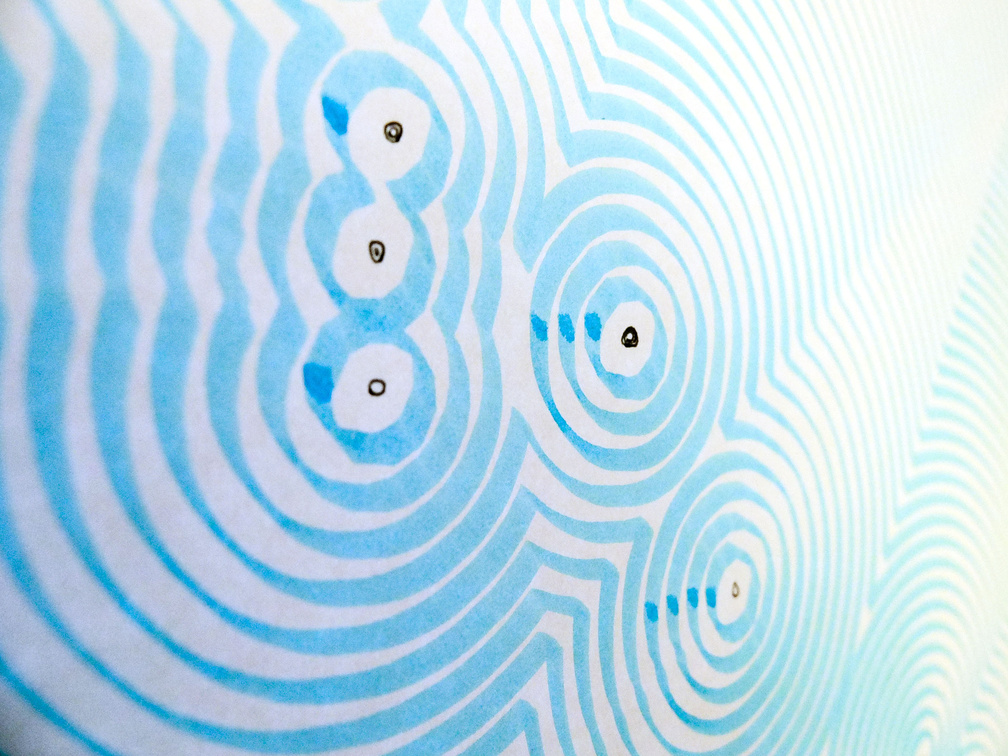
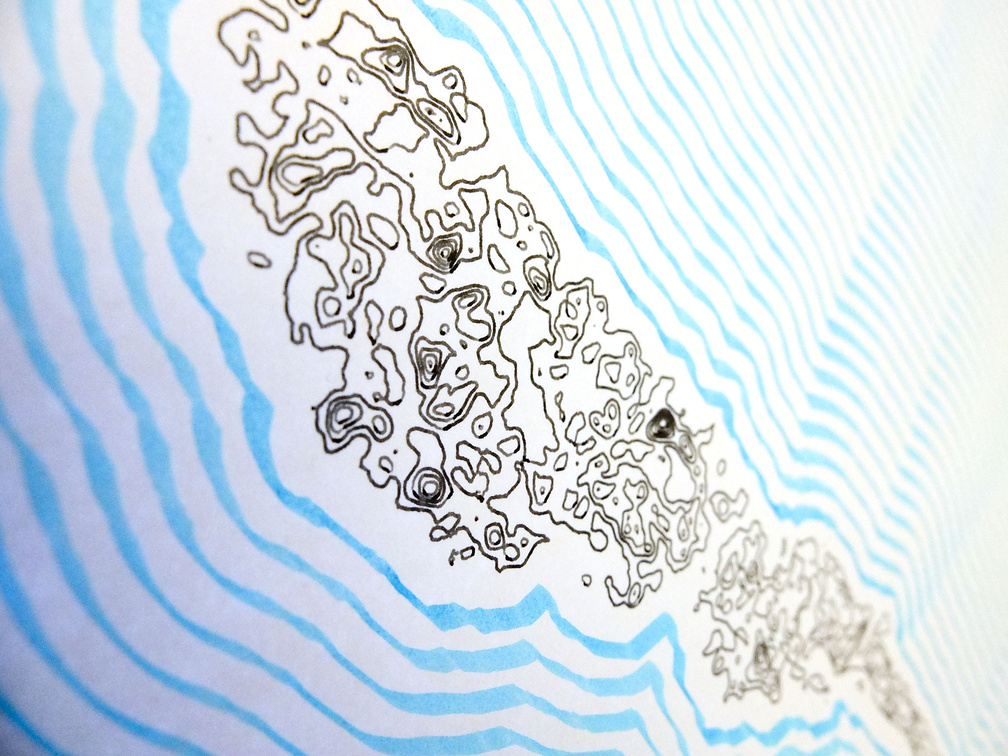
June 2026 – Reachability map (isochrones) and shortest routes for the Kröller-Müller Museum sculpture garden. The analysis takes into account different types of pavement, differences in elevation, and stairs.
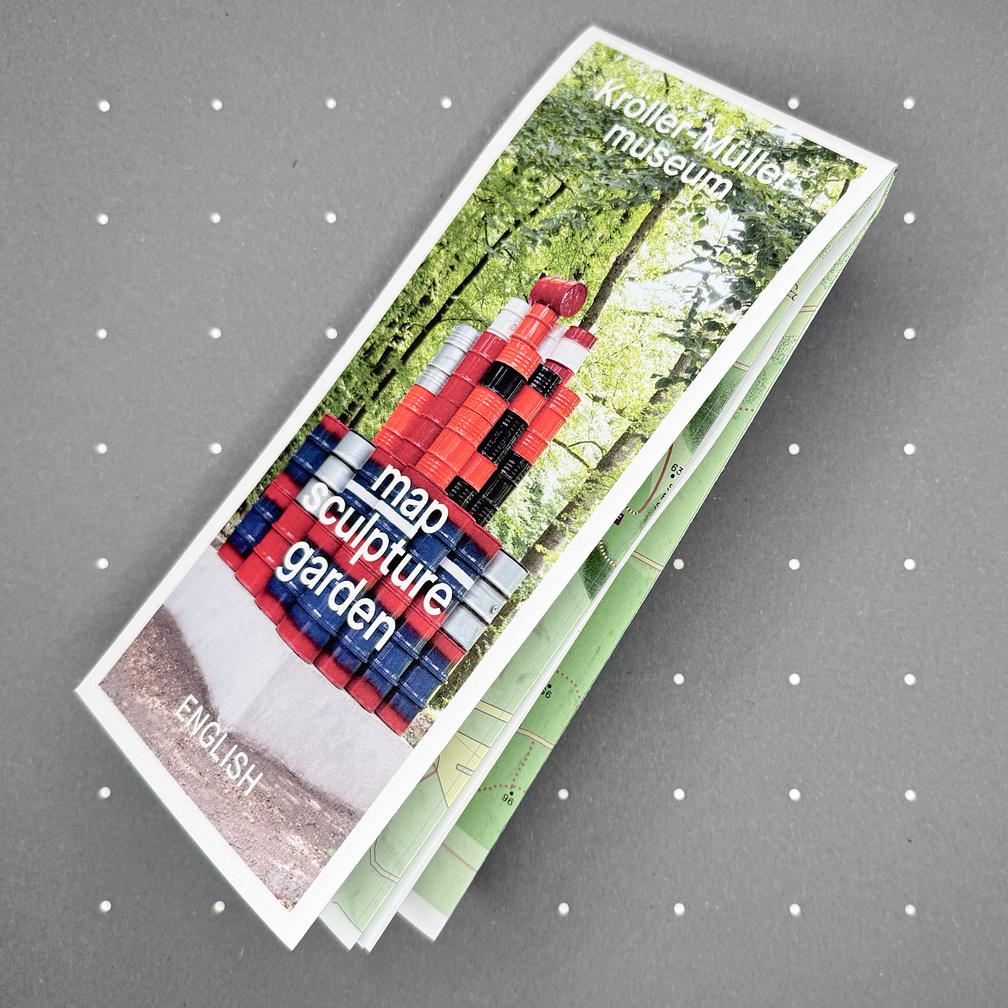
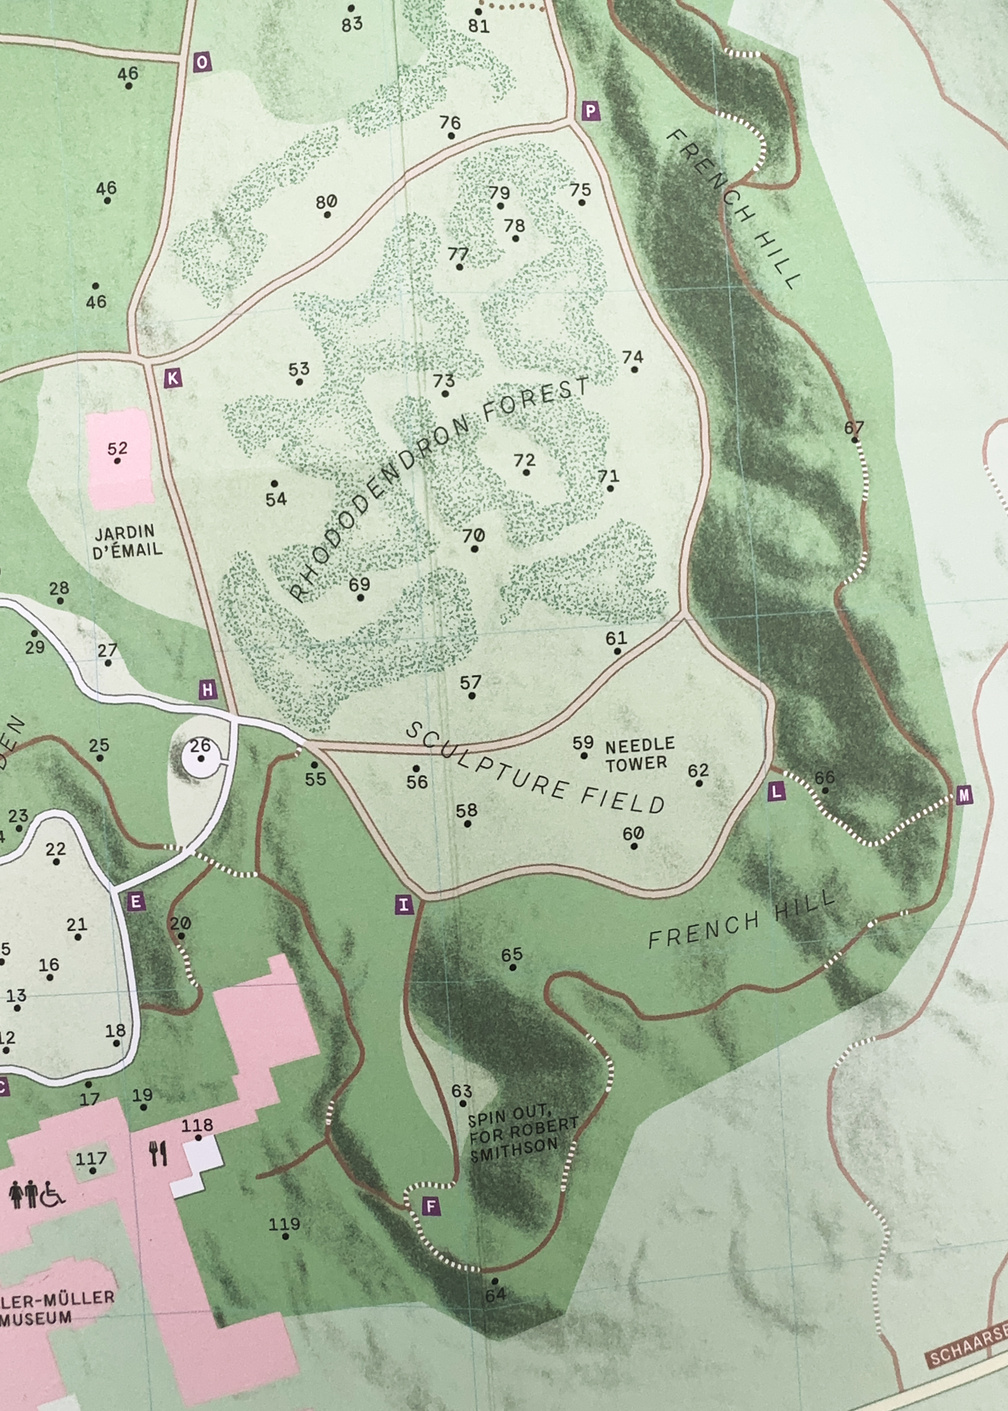
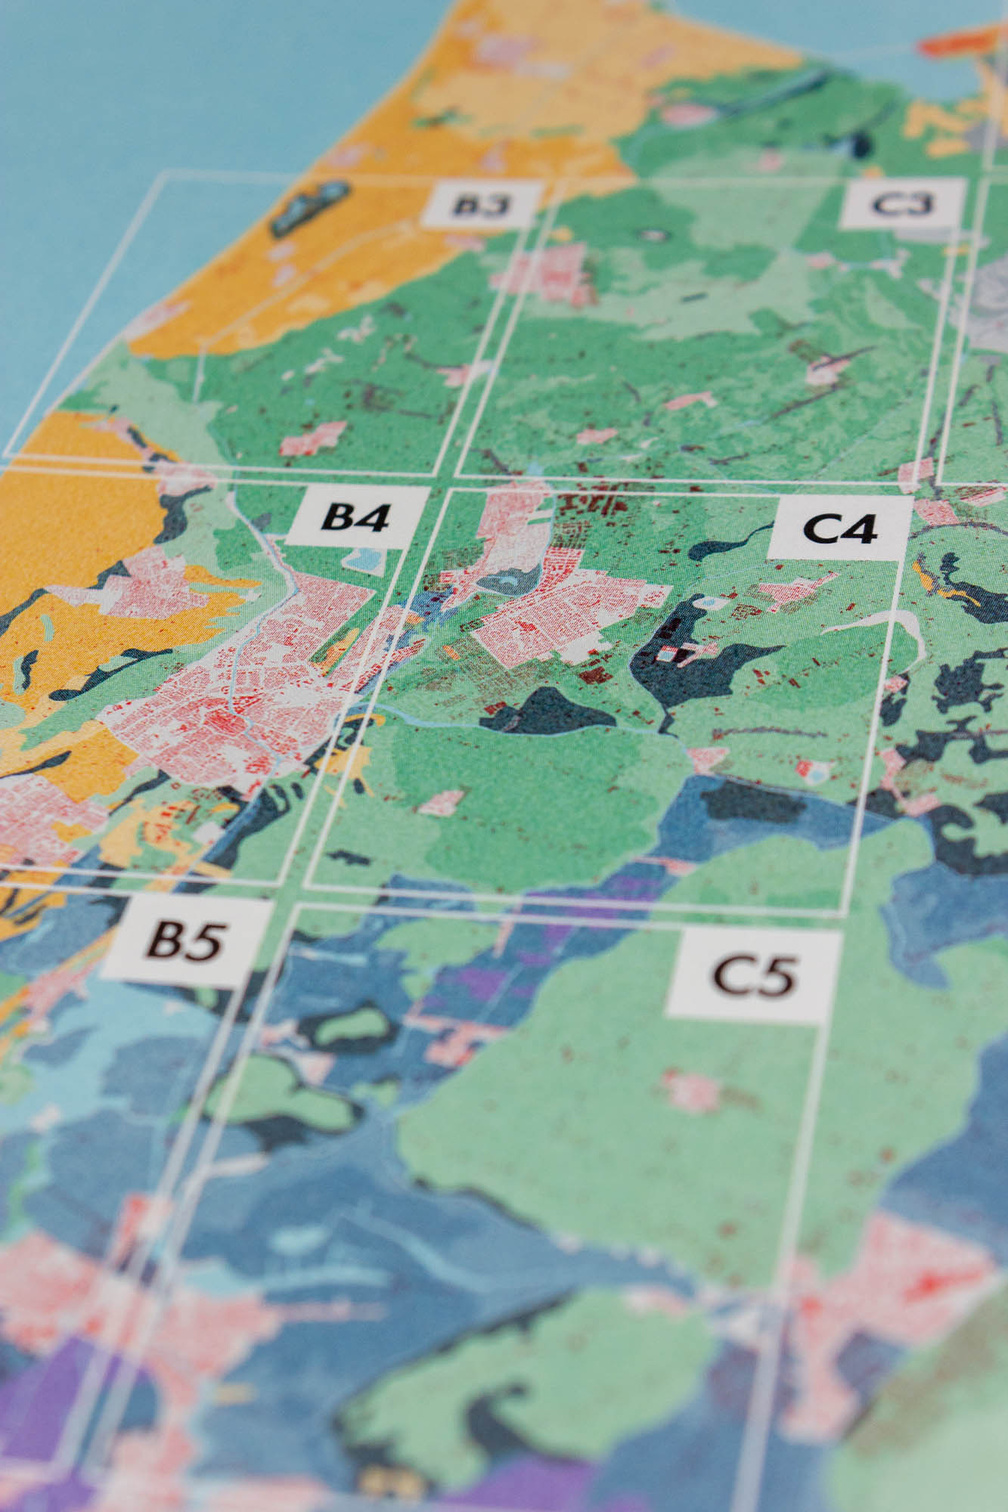
June 2026 – A new map for the Kröller-Müller Museum sculpture garden, one of the largest outdoor sculpture collections in Europe, located in De Hoge Veluwe National Park near Otterlo, in the Netherlands (Gelderland). The map helps visitors navigate this "outdoor gallery." Instead of presenting fixed routes, it invites visitors to stroll around and discover sculptures set directly into forest, heath, and open lawn, spread over about 25 hectares. Different indices allow searches by artist, ID, and grid reference.
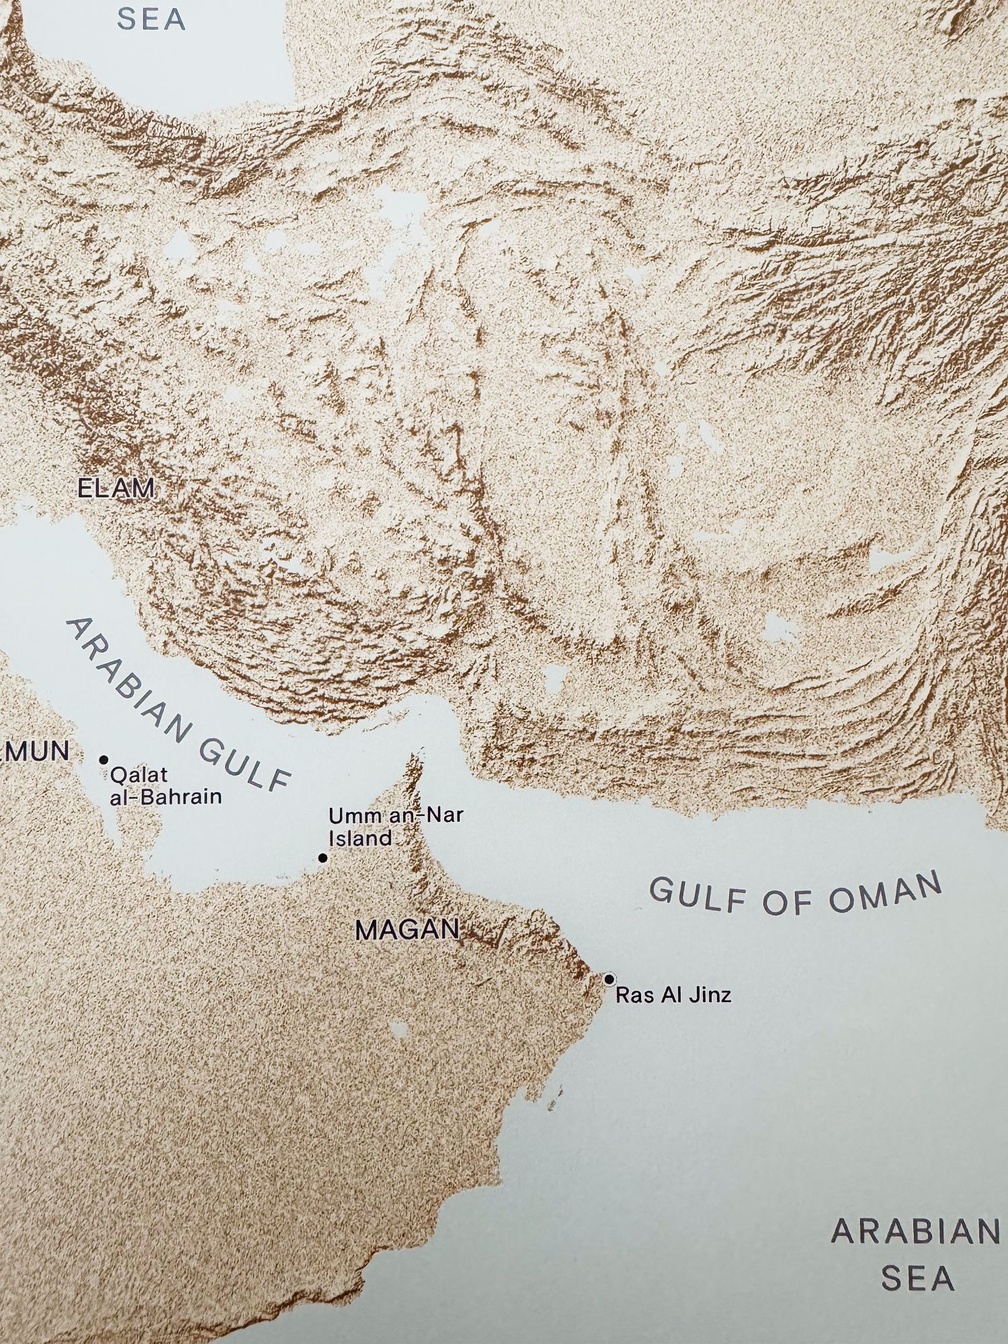
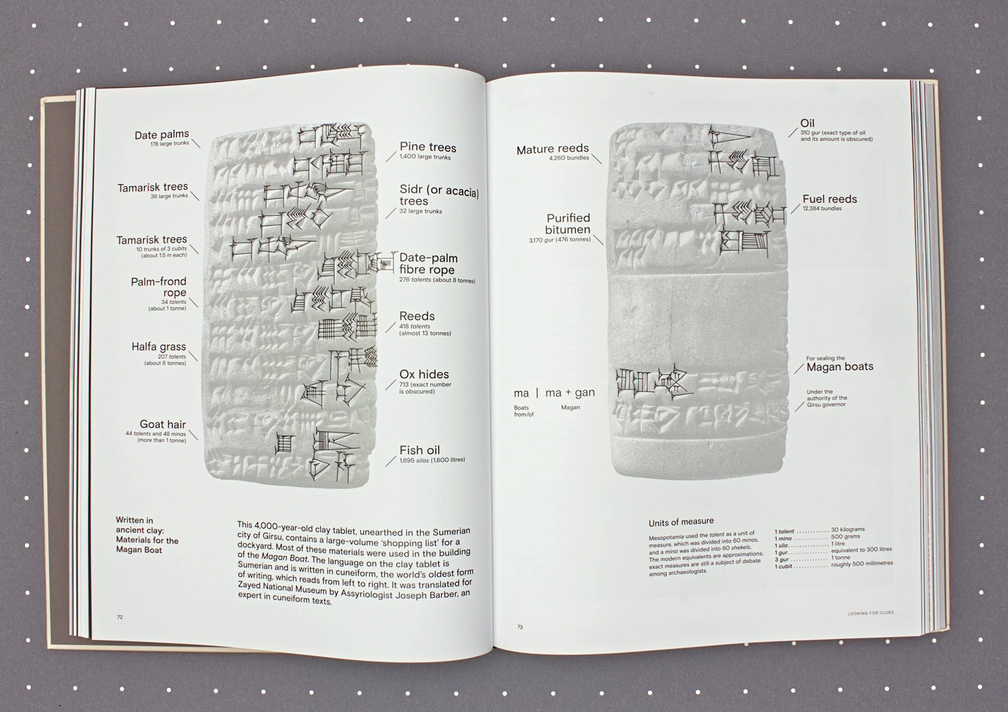
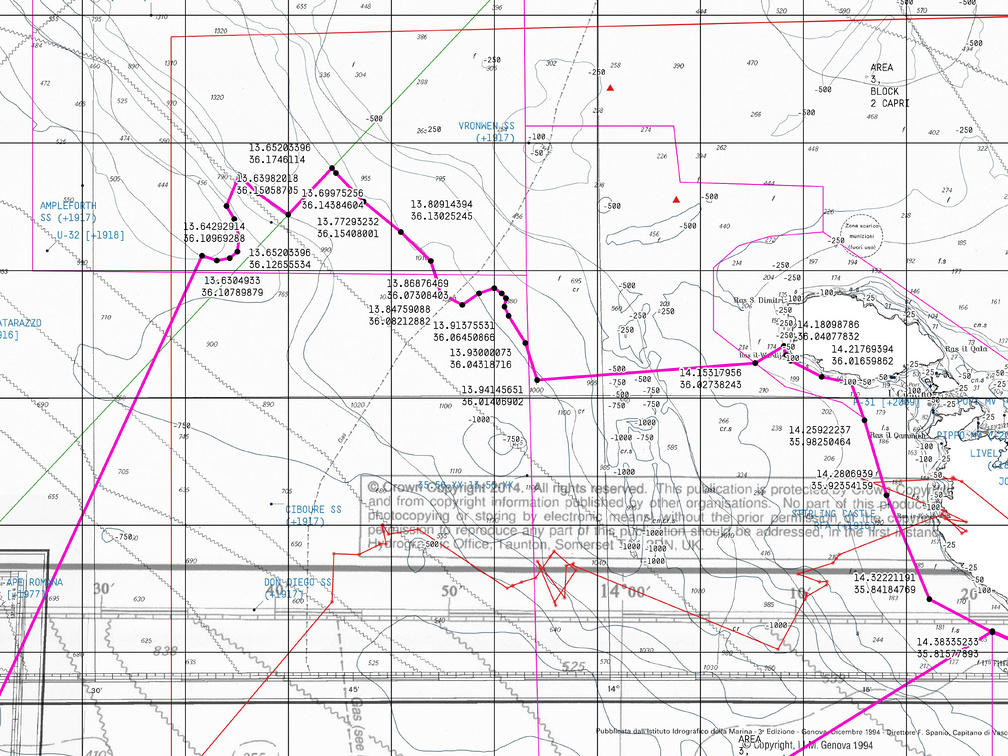
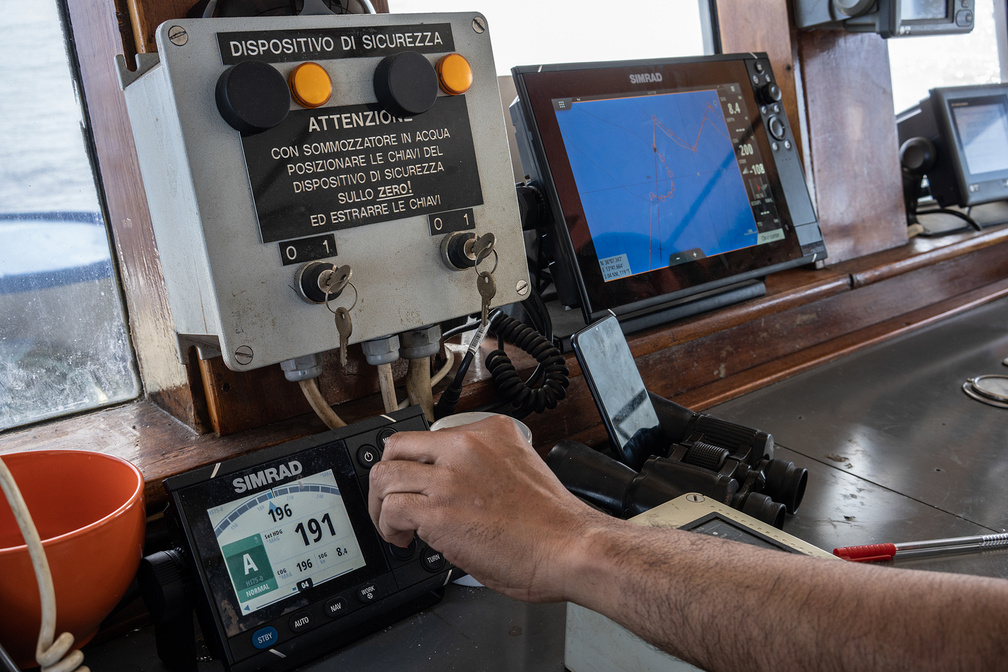
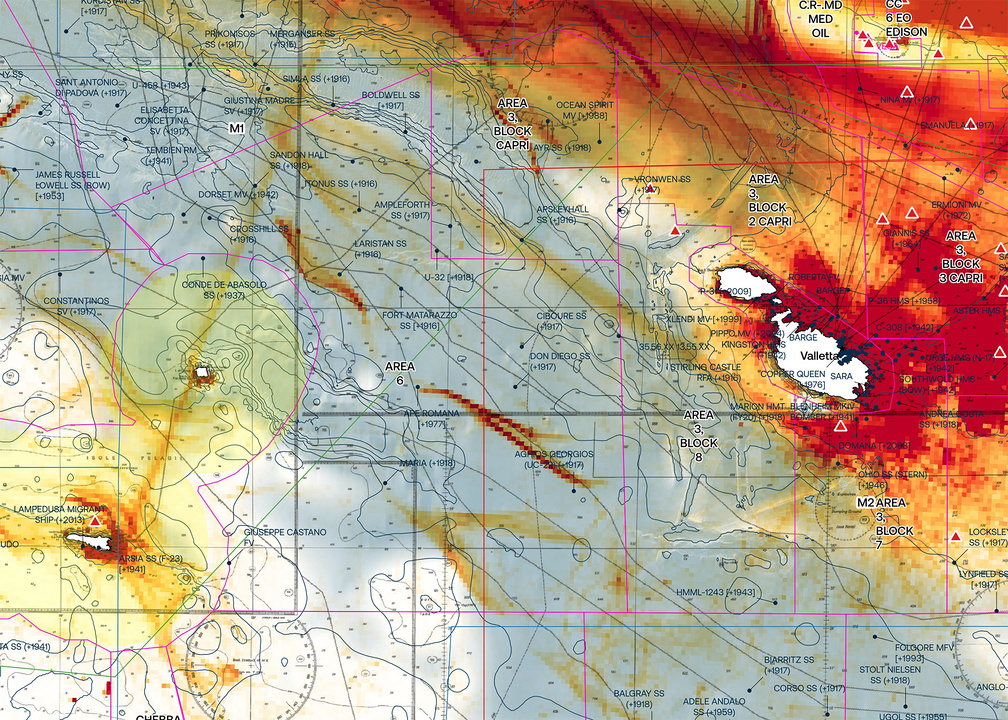
June 2026 – Magan Rediscovered: The Building of a Bronze Age Boat That Sailed the Arabian Gulf". It documents the Zayed National Museum's experimental archaeology project, detailing the reconstruction and successful sea trials of an 18-meter ancient reed and bitumen vessel.
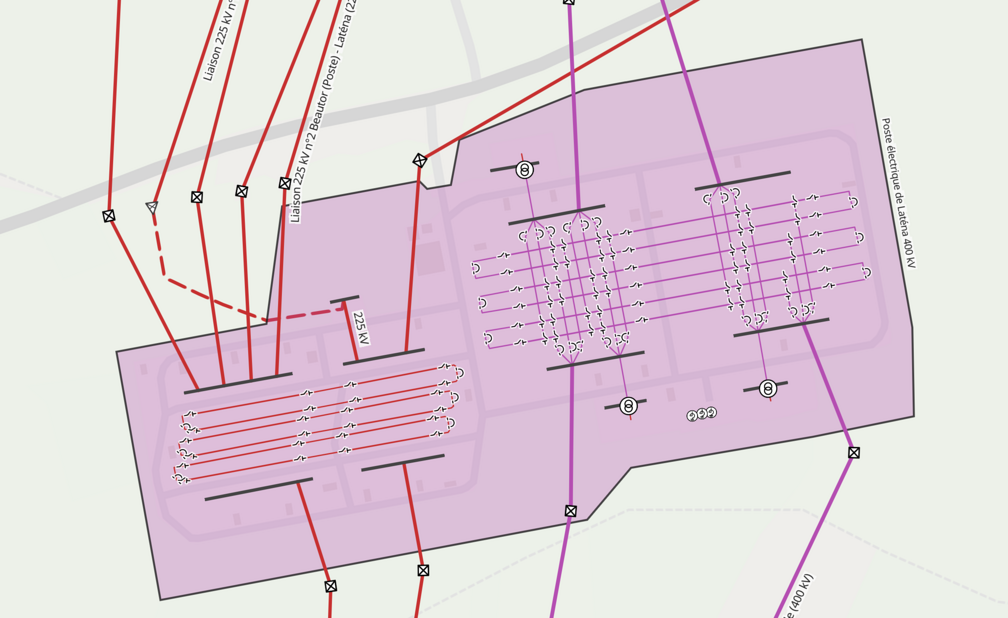
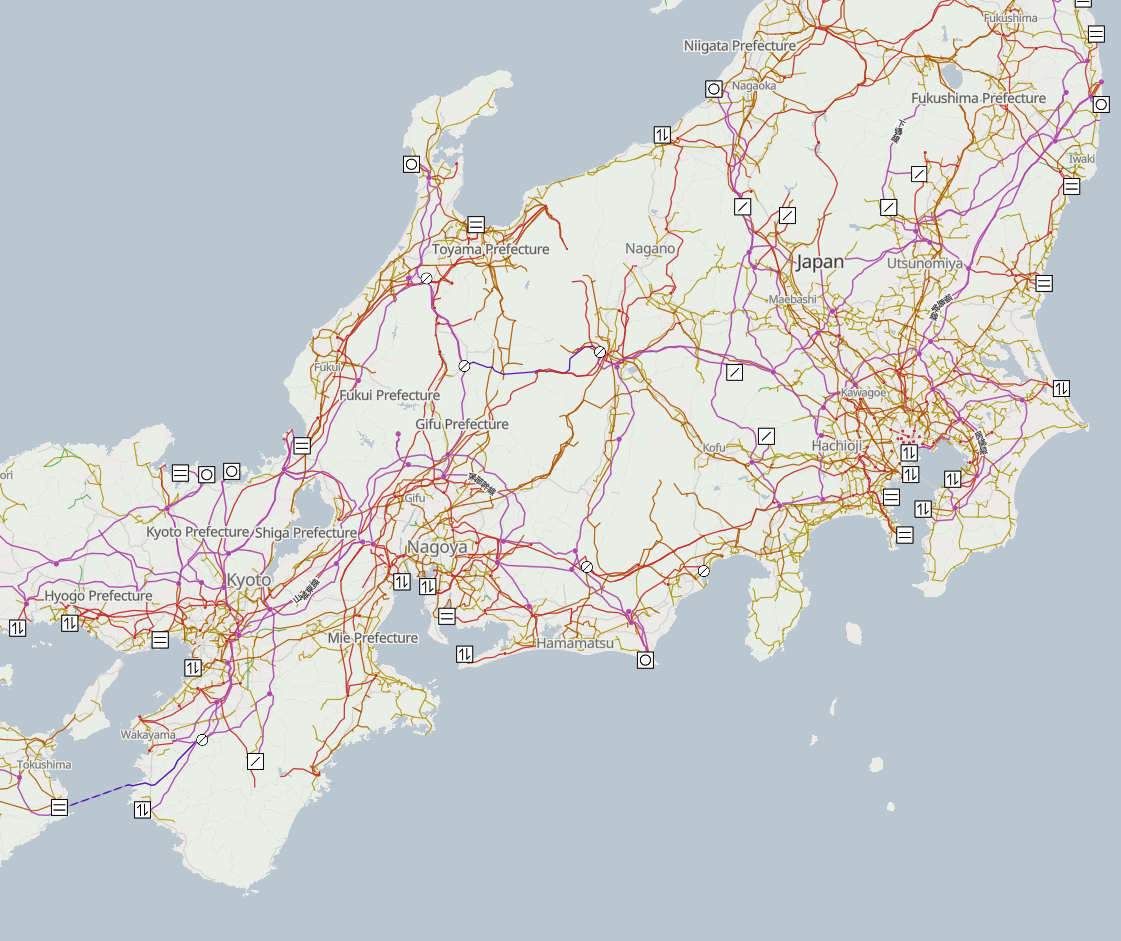
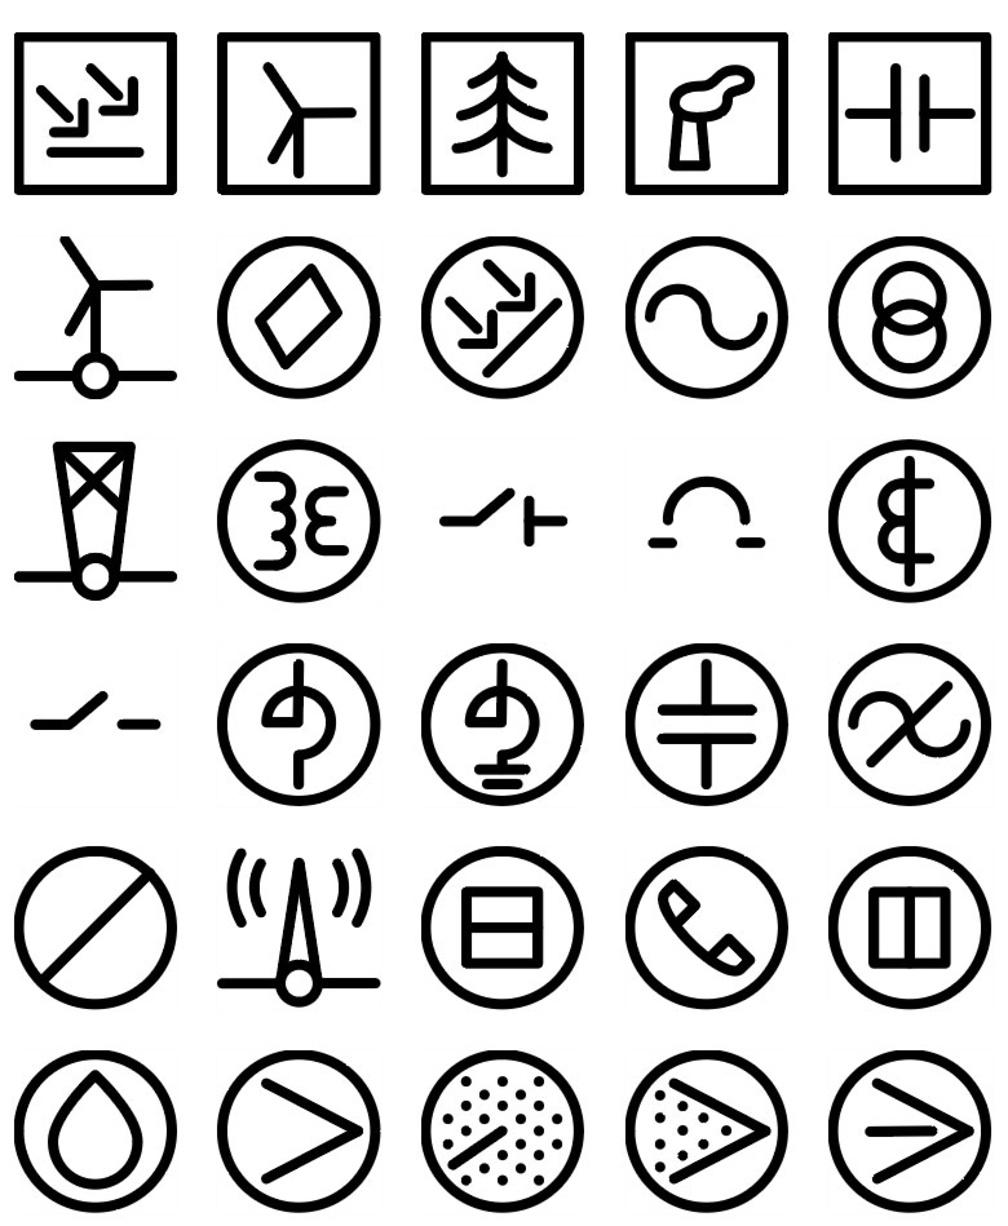
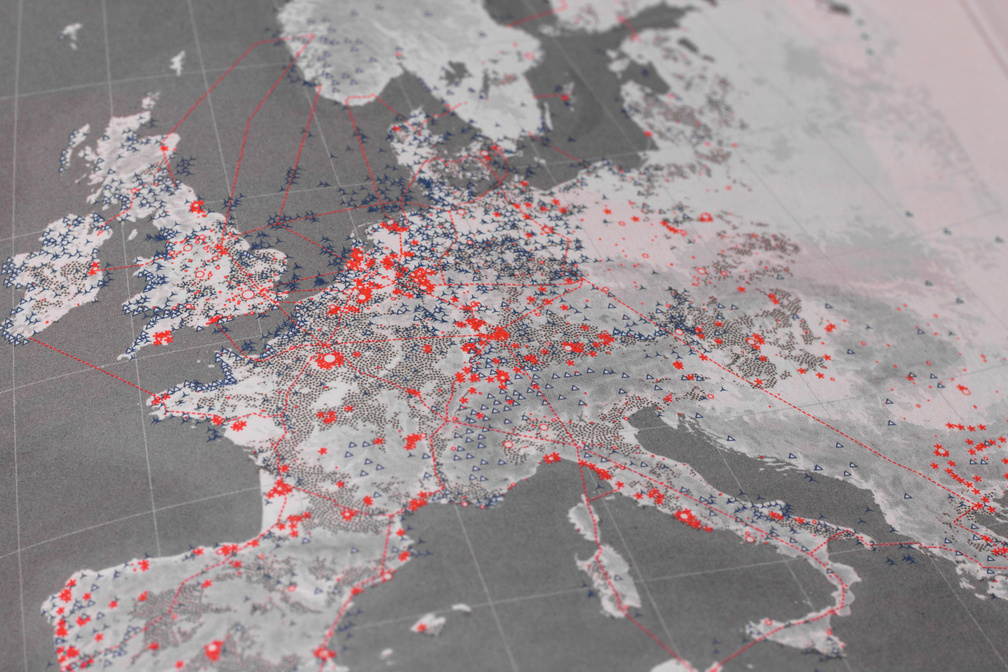
September 2025 – Icons and limited glyph set for Open Infrastructure Map, a view of the world's infrastructure mapped in the OpenStreetMap database.
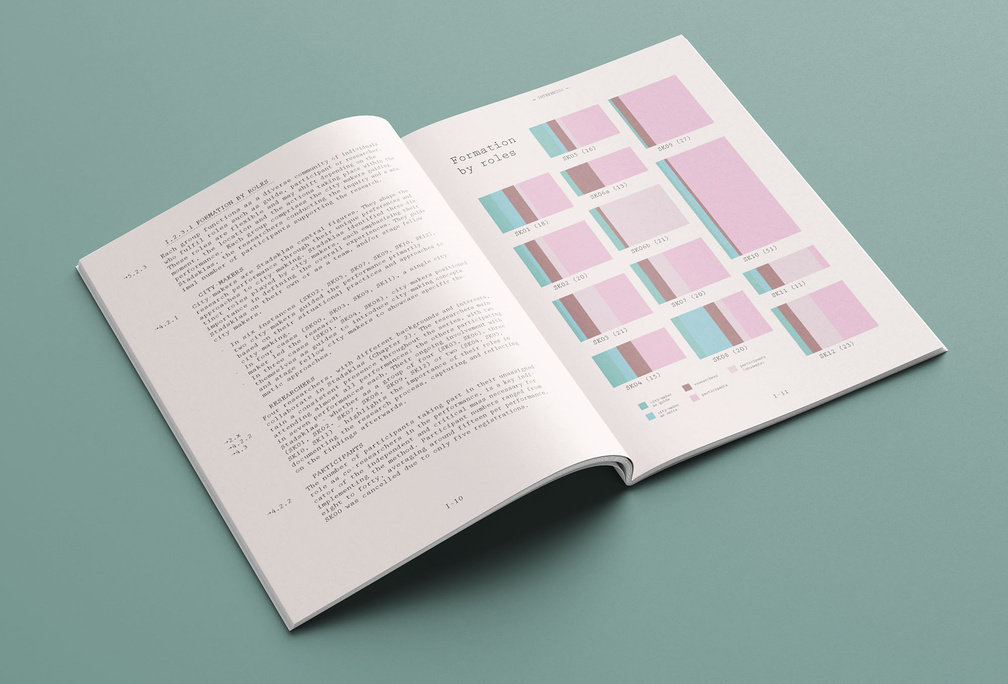
STADSKLAS
August 2025 – Bookdesign for Willemijn Lofvers' PhD research STADSKLAS. Experimental learning of transdisciplinary practitioners in dramaturgical arranged urban situations.
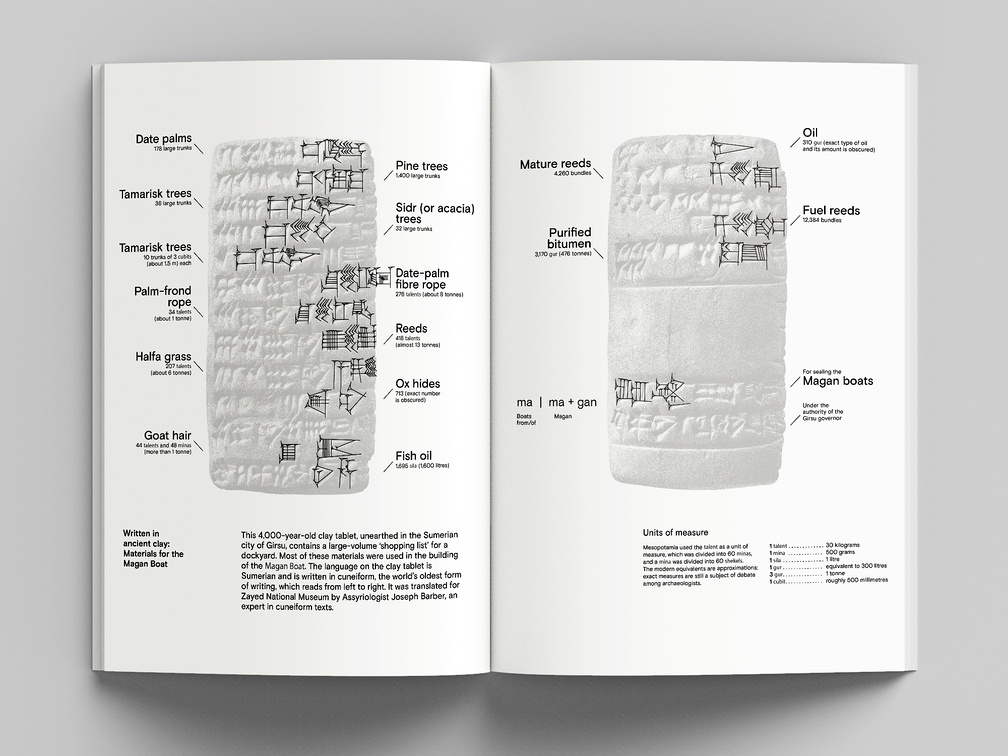
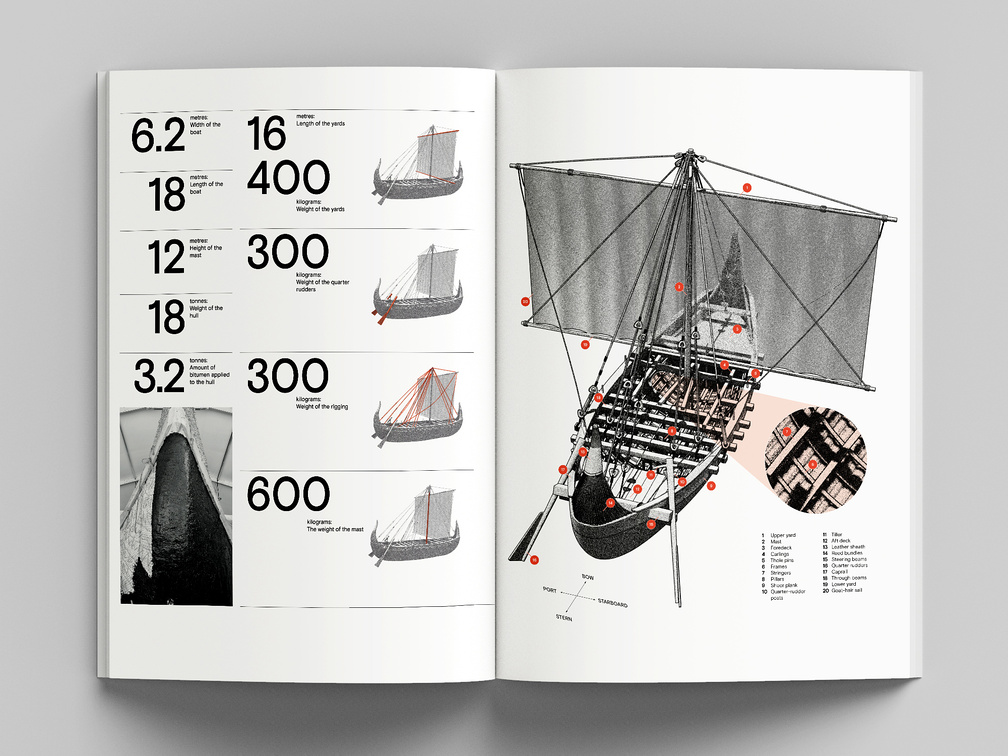
July 2025 – Infographics and cartography for Magan rediscovered, a publication from The Zayed National Museum, the national museum of the United Arab Emirates, chronicling the 'Magan Boat Project', a joint initiative with Zayed University and NYU Abu Dhabi launched in 2021. The project resulted in the reconstruction of an 18-meter Bronze Age ship that sailed from the coast of Abu Dhabi.
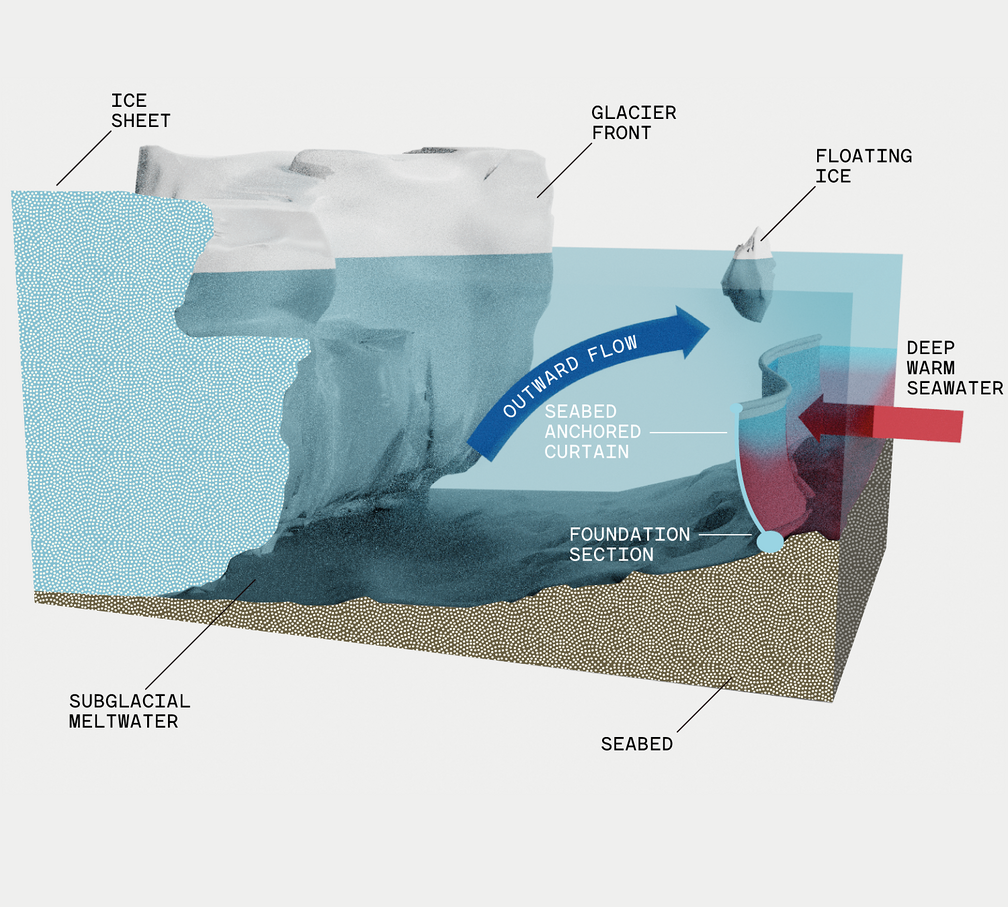
Can $500 Million Save This Glacier?
January 2024 – Information design for New York Times -- A bold engineering project might show a way to slow sea-level rise — and bring new imagination to the fight against climate change.
Encounters
March 2022 – Maps for "In Focus", the Photographic Journal of british photographer David Yarrow.
Encounters
June 2021 – Maps for "In Focus", the Photographic Journal of british photographer David Yarrow.
May 2021 – Cartography for a performance by artist Rossella Biscotti that has taken place in the Mediterranean Sea between 20 and 23 May 2021. The Journey is a performance of a ship navigating a GPS content-related route inspired by time, history and current geopolitical data researched together with different experts and communities in an area of the Mediterranean Sea between Italy, Malta, Tunisia, Libya. The narrative is centered on the decision and consequences of dropping a 17-ton marble block awarded to the artist by the iconic Michelangelo quarry in Carrara, Italy, yet left untouched.
Montana
November 2020 – Montana map for "In Focus", the Photographic Journal of british photographer David Yarrow.
West Africa
November 2020 – West Africa map for "In Focus", the Photographic Journal of british photographer David Yarrow.
Mediterranean Sea
September 2020 – Map aggregation and map reprojections for artist Rossella Biscotti project "The Journey" -- a performance of a ship navigating a GPS content-related route inspired by time, history and current geopolitical data researched together with different experts and communities in an area of the Mediterranean Sea between Italy, Malta, Tunisia, Libya.
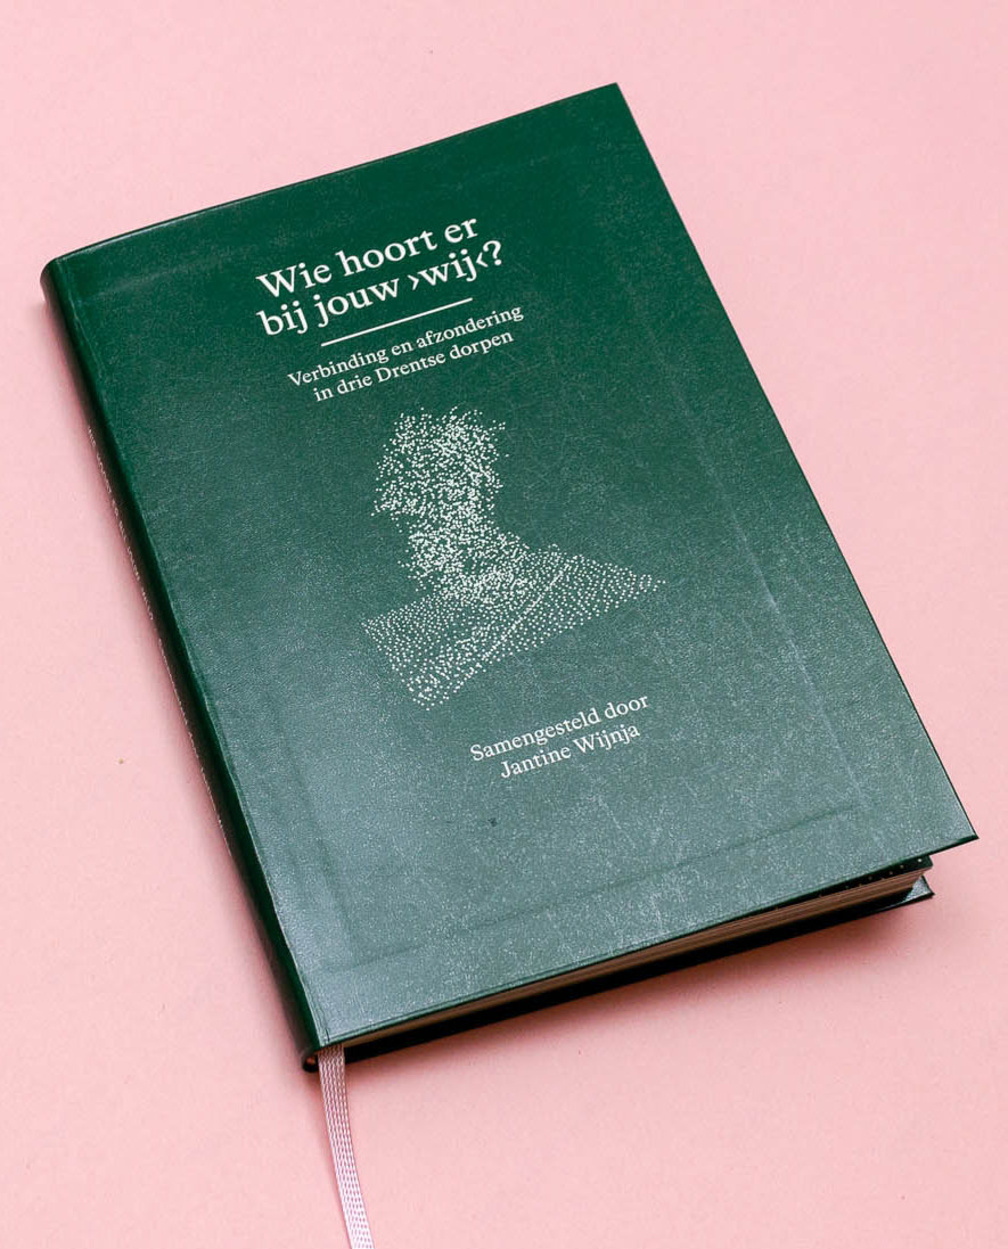
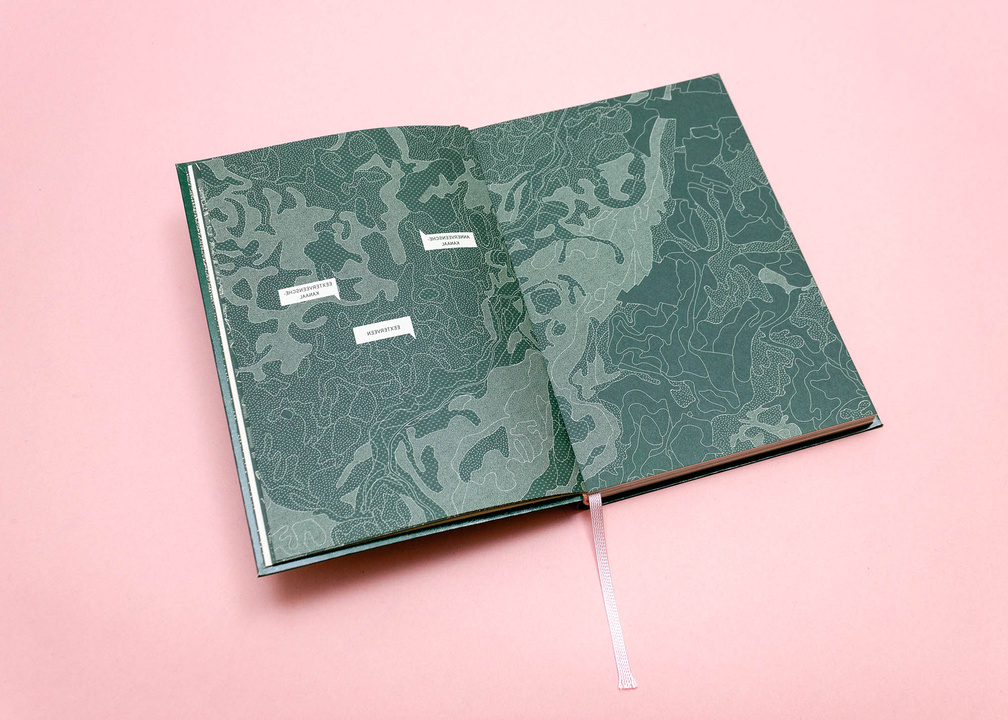
September 2020 – Book Design, text analysis and maps for ‘Dit Is Nu’ (‘This is Now’), an ongoing project of artist Jantine Wijnja.
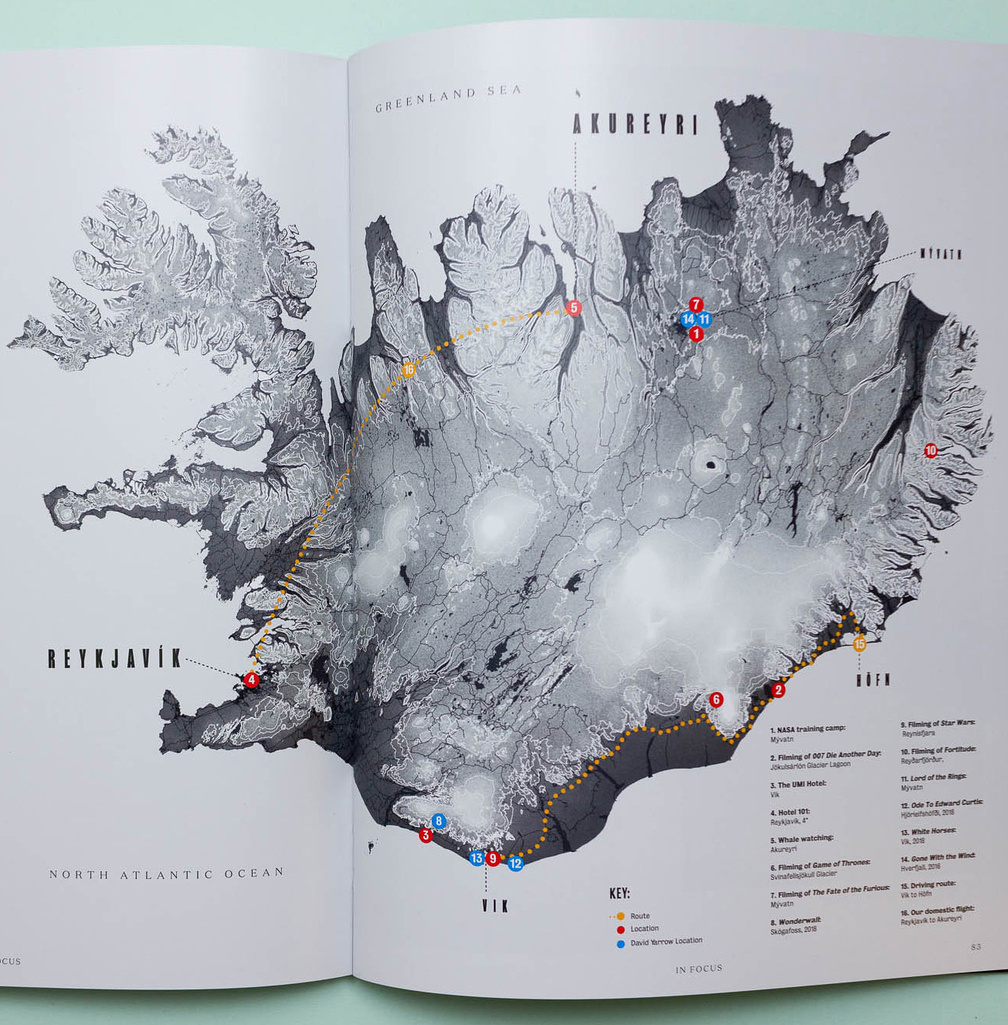
Iceland
June 2020 – Iceland map for "In Focus", the Photographic Journal of british photographer David Yarrow.
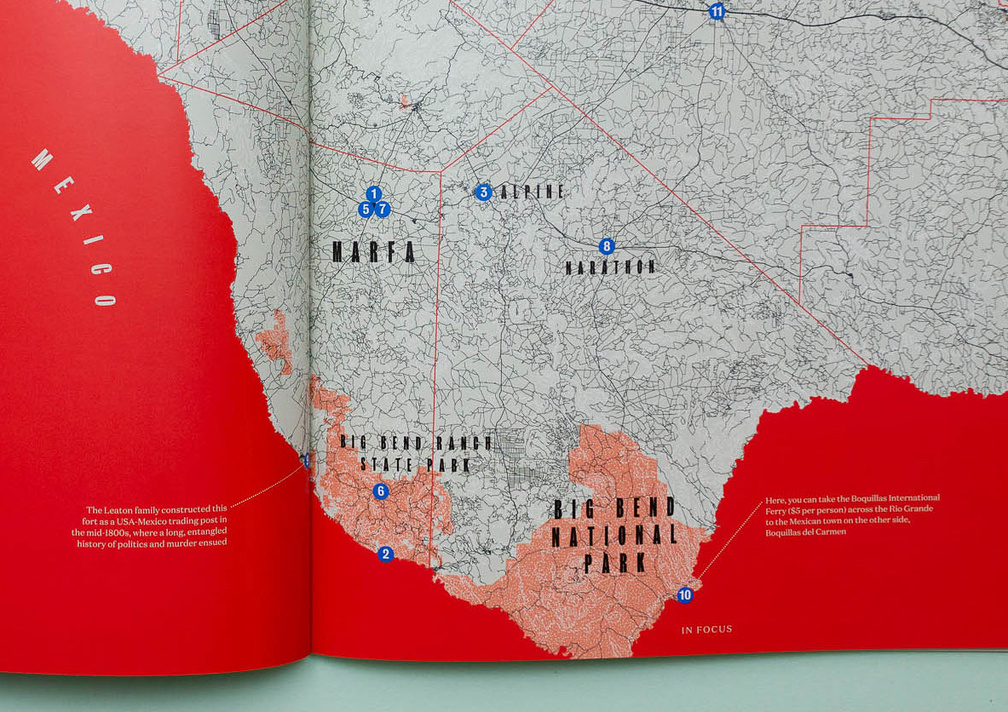
West Texas
June 2020 – Texas map for "In Focus", the Photographic Journal of british photographer David Yarrow.


How competition makes us creative
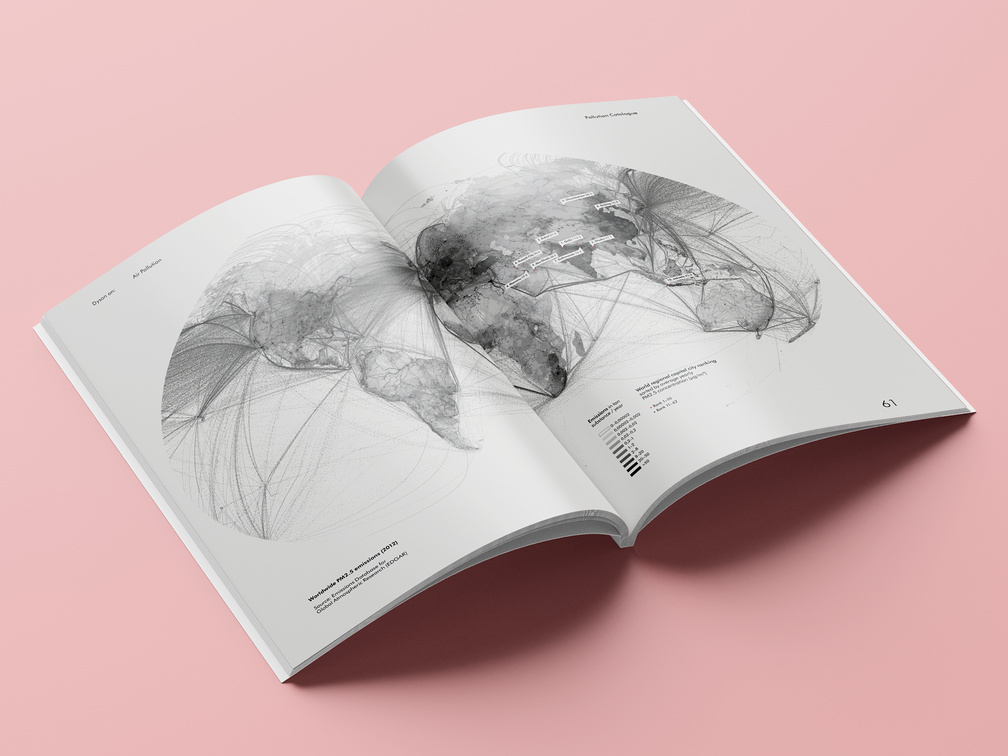
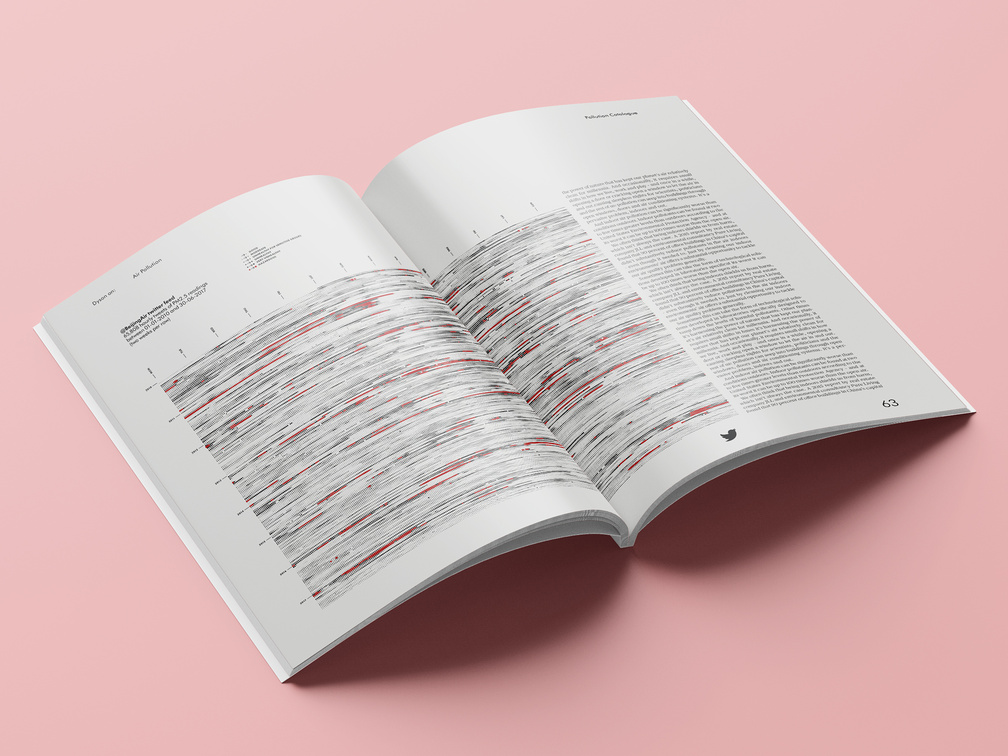
July 2019 – Graphics on air pollution for the second issue of Dyson on: Magazine.
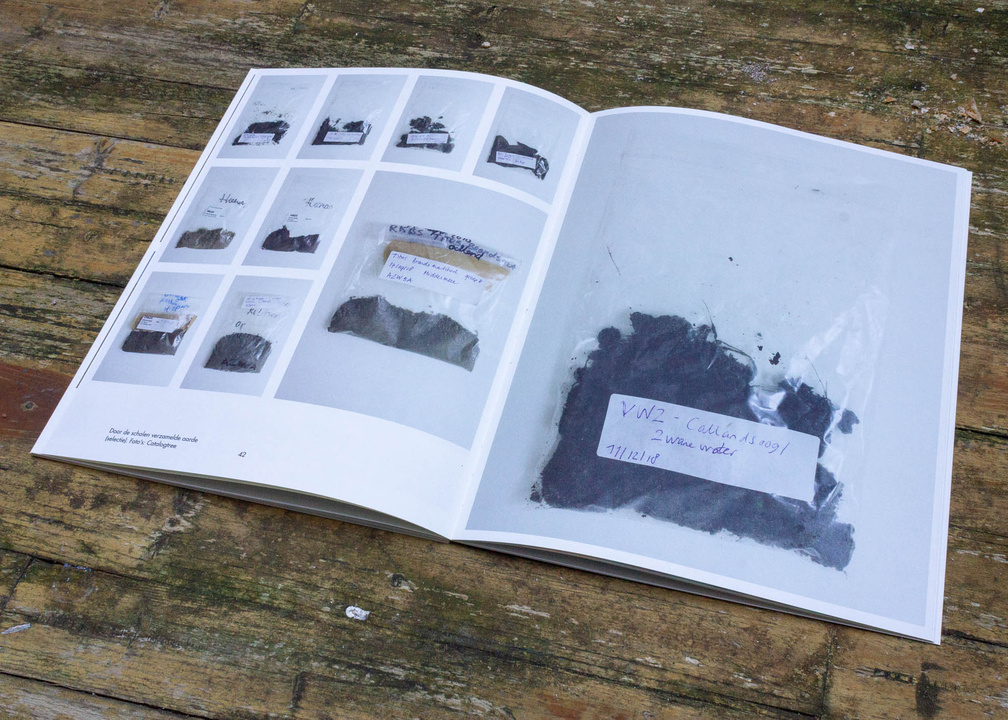
June 2019 – Publication accompanying the exhibition "herman de vries: At Your Feet" at Stedelijk Museum Alkmaar
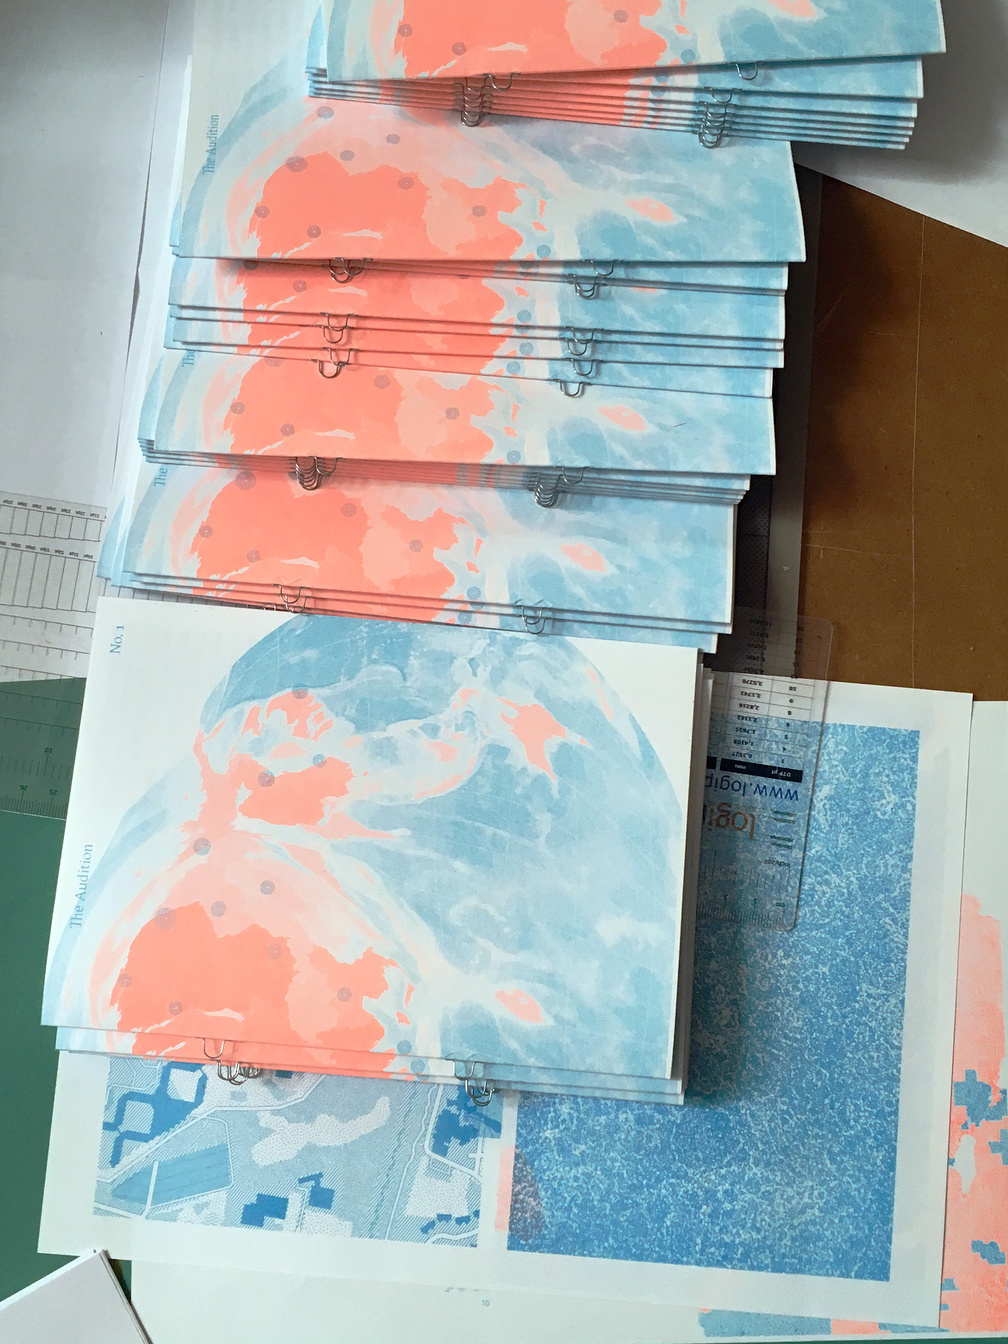
September 2018 – 'The Audition' is a self-initiated series of RISO-printed booklets, each focussing on one aspect of our work. The first issue is dedicated to our fascination for cartography.
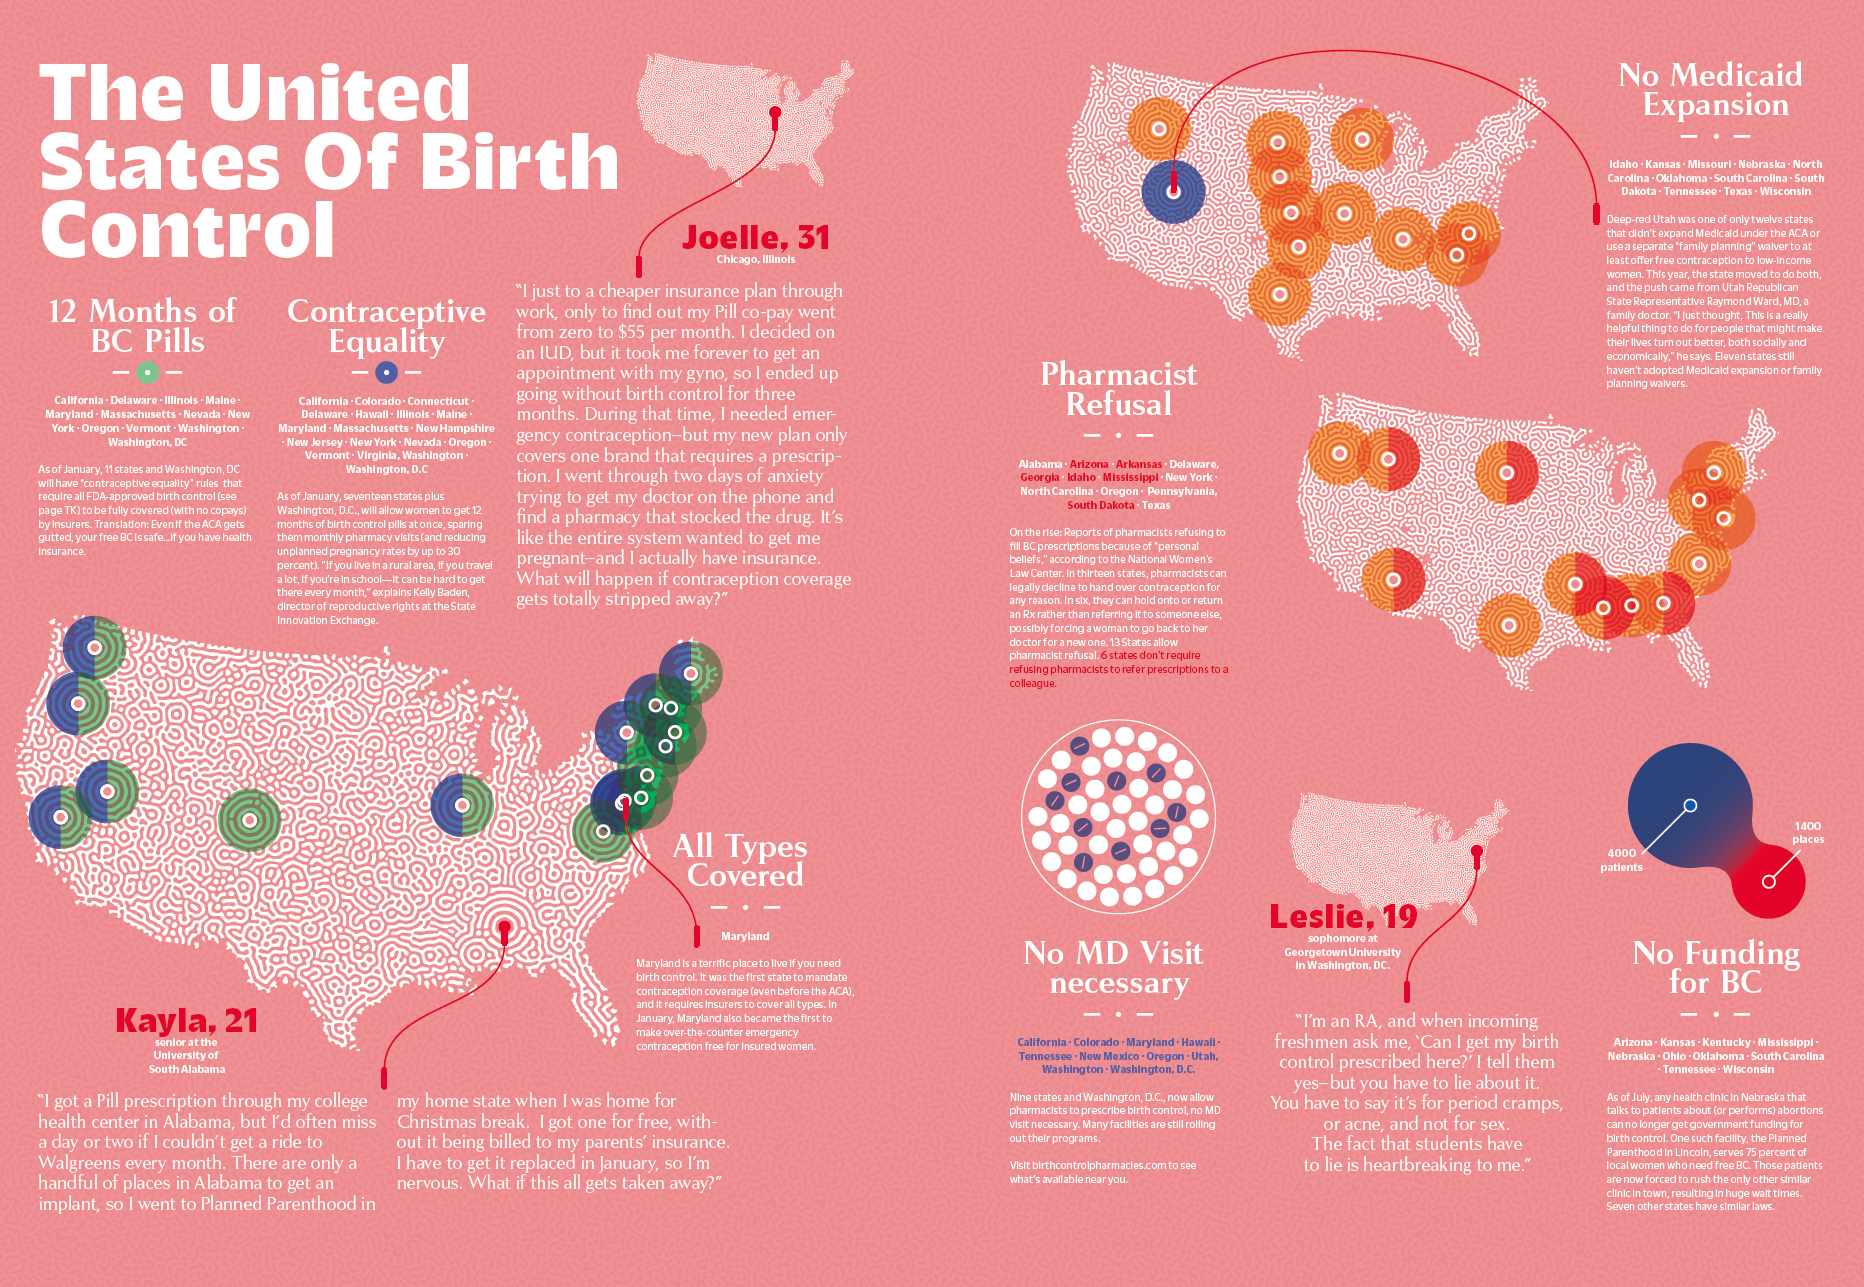

The United States of Birth Control
September 2018 – Various graphics on birth control in the U.S. for the November issue of Cosmopolitan Magazine.
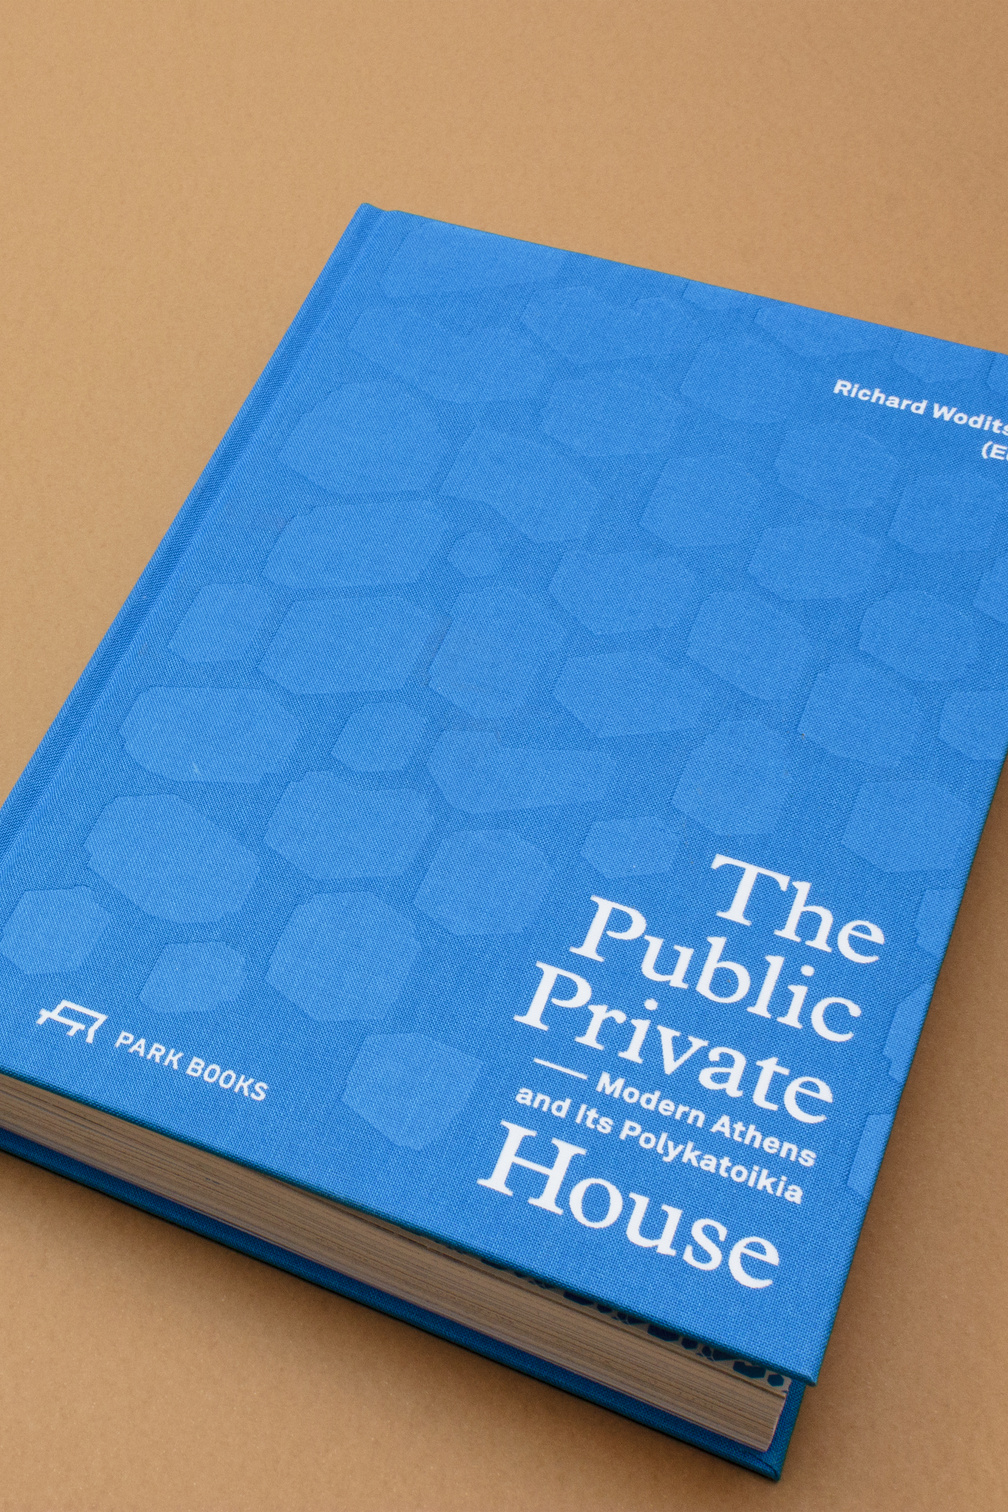
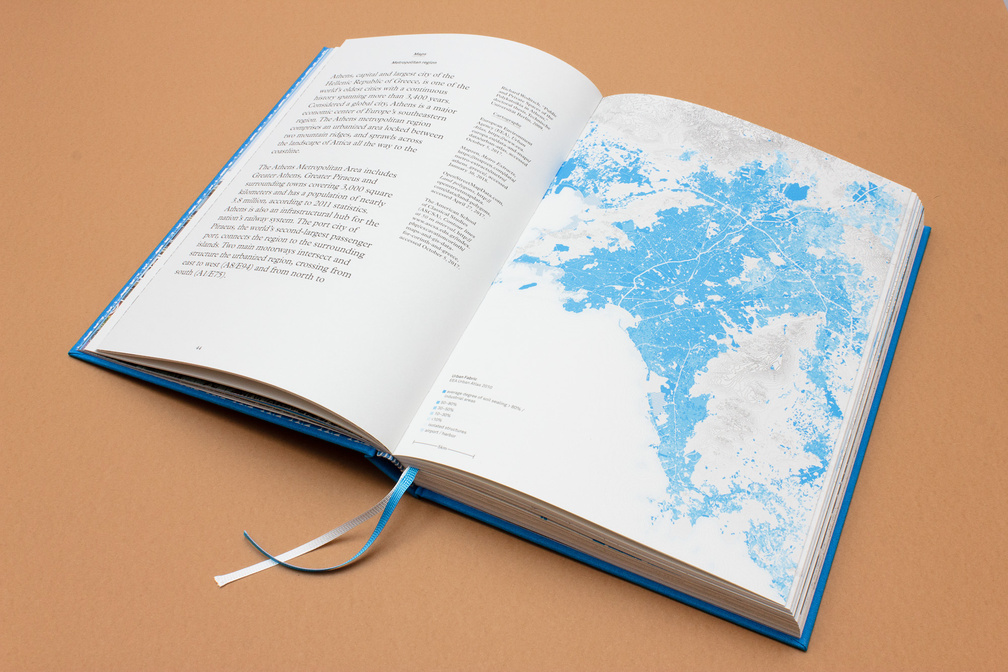
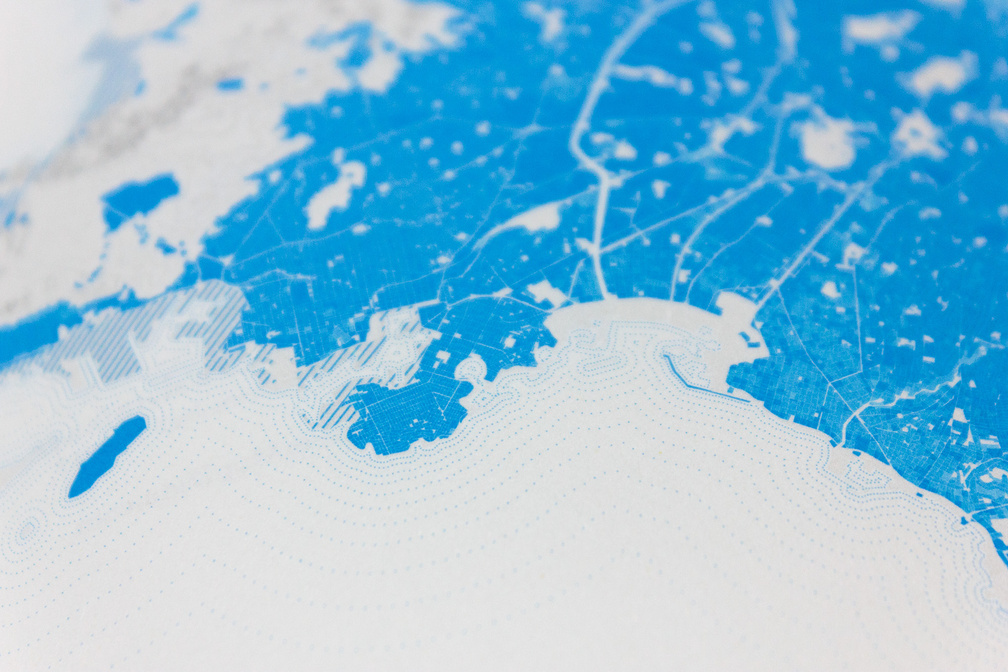
September 2018 – ‘The Public Private House’, edited by Prof. Dr. Richard Woditsch and published by Park Books, Zurich (CH), examines the building typology of simple apartments blocks, the ‘Polykatoikia’, that define Athen's signature housing structure. On the shortlist for ‘Die schönsten Deutschen Bücher 2019’.
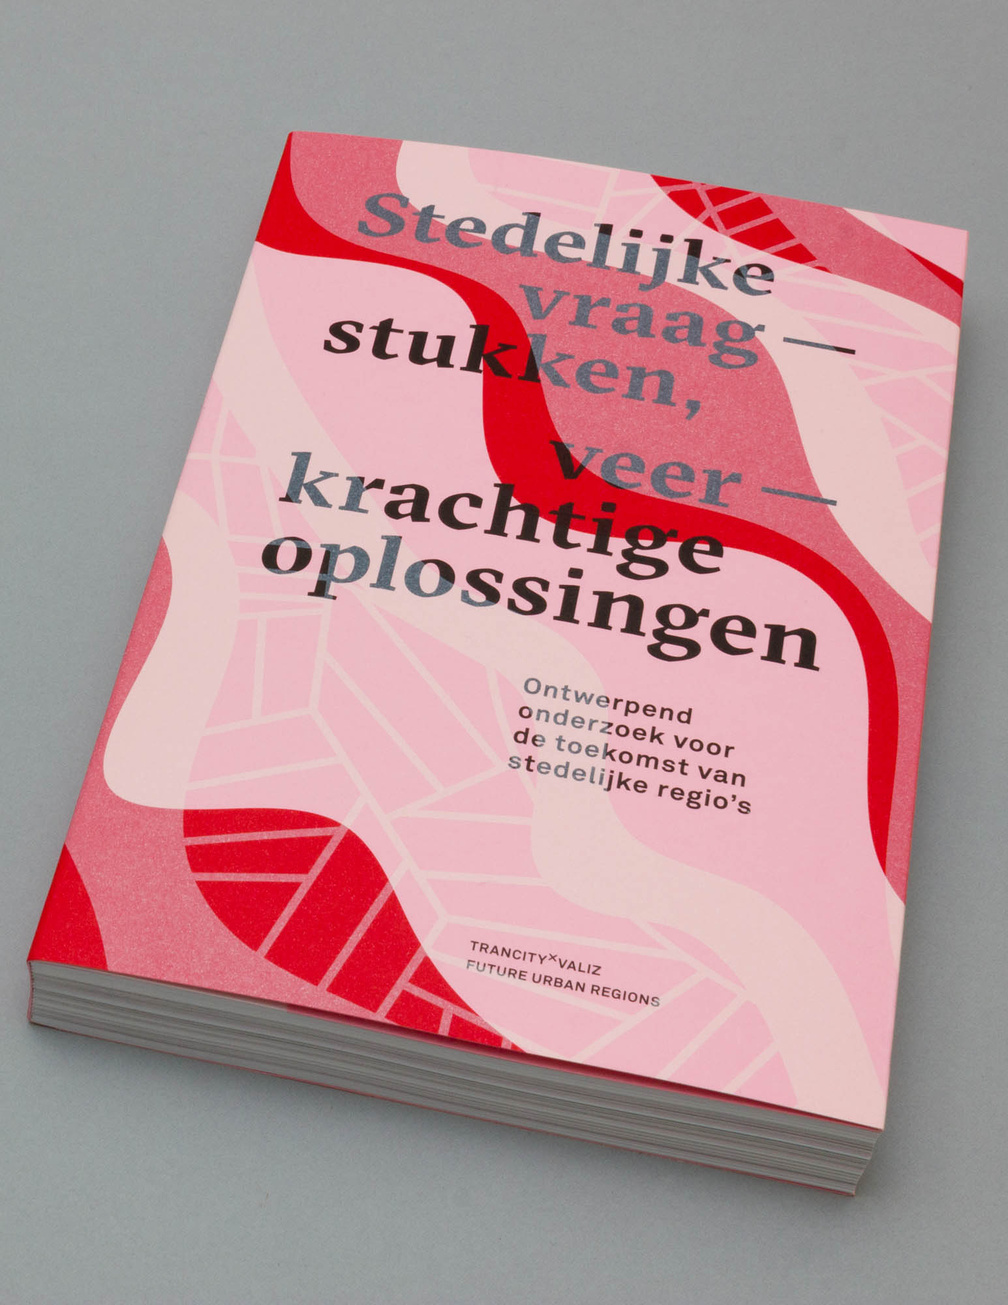

October 2017 – Book Design for ‘Urban Challenges, Resilient Solutions’ in which the ‘Future Urban Regions Lectorate’ offers designers, their commissioners and (local) governments new models and ideas to deal with healthy urban development. Published by trancity*valiz.

Clean Water & Sanitation
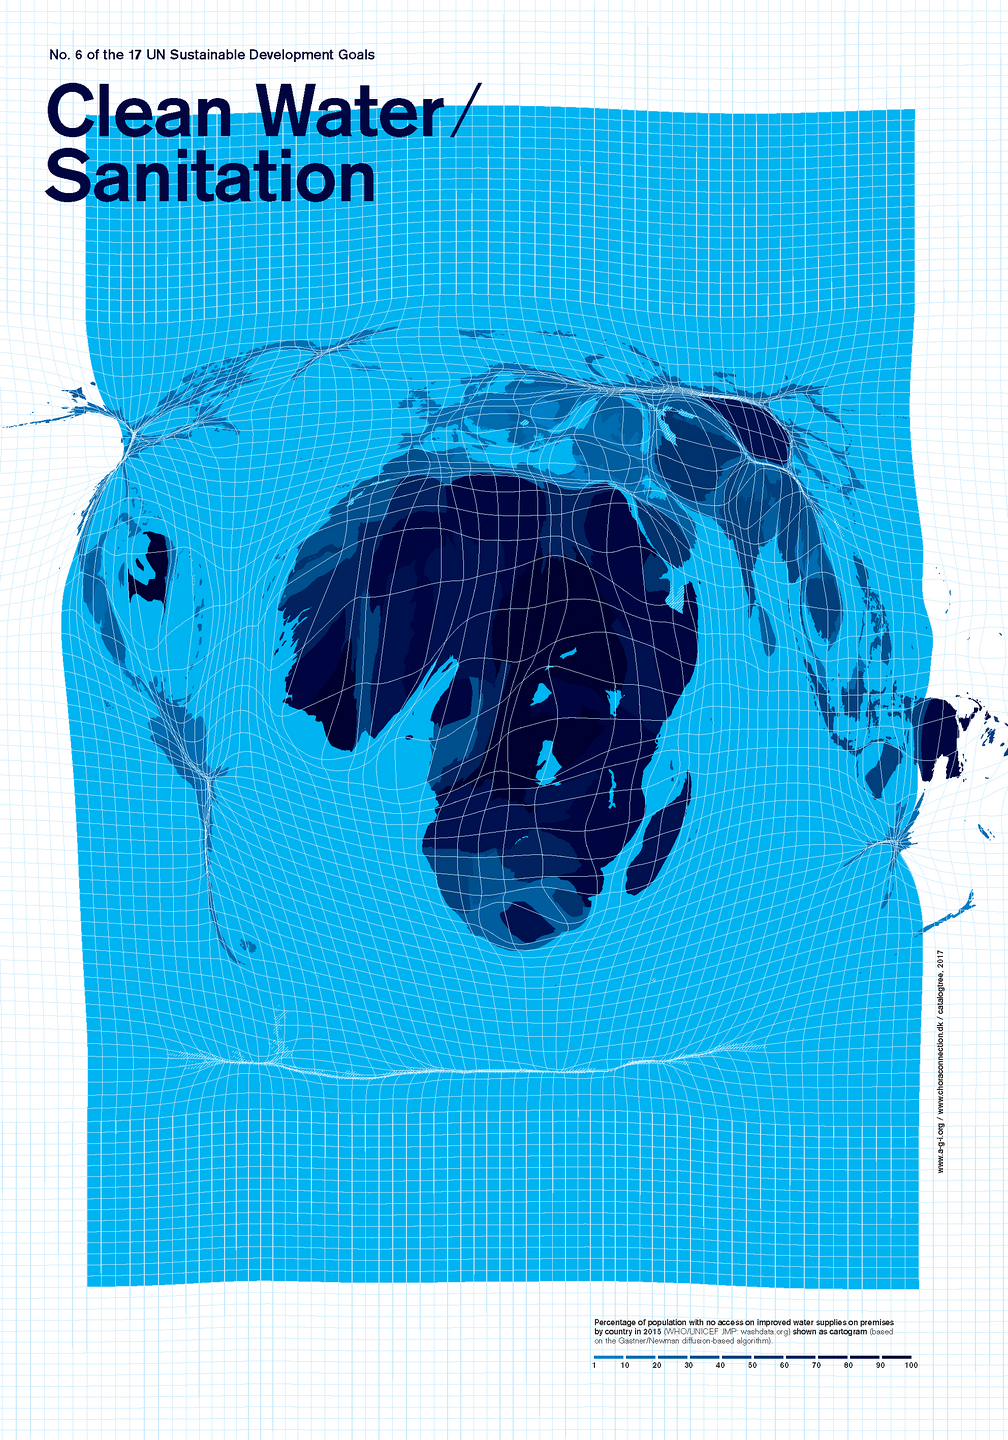
September 2017 – Poster on ‘Clean Water & Sanitation’, No. 6 of the 17 Sustainable Development Goals as a contribution to 17for17: Worldwide initiated by AGI and Chora Connection: Percentage of population with no access on improved water supplies on premises by country in 2015 shown as cartogram. The posters have been exhibited at Palais de Tokyo in Paris (FR).
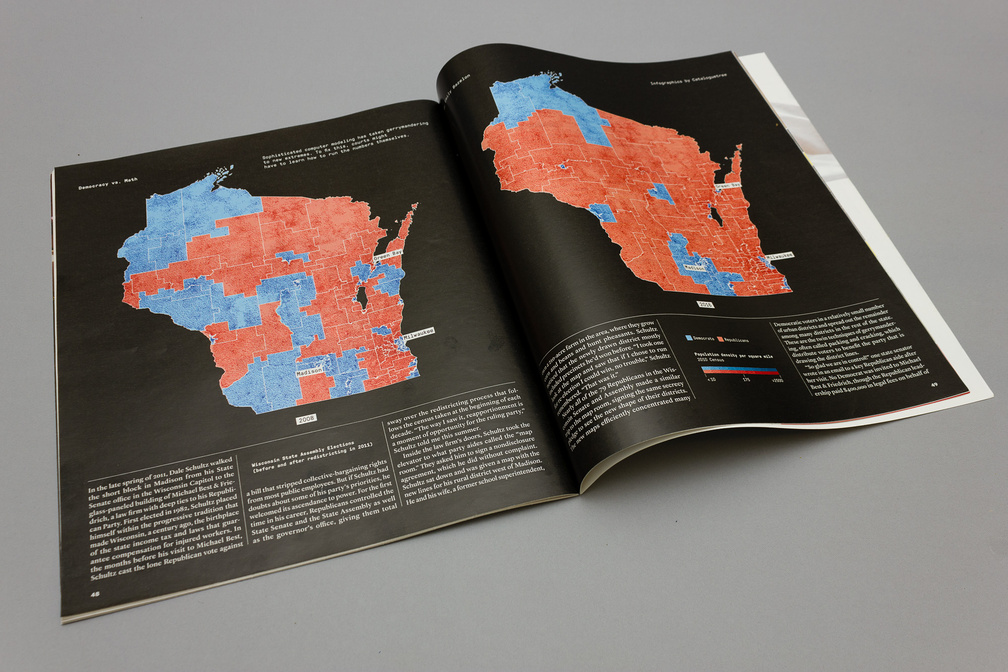
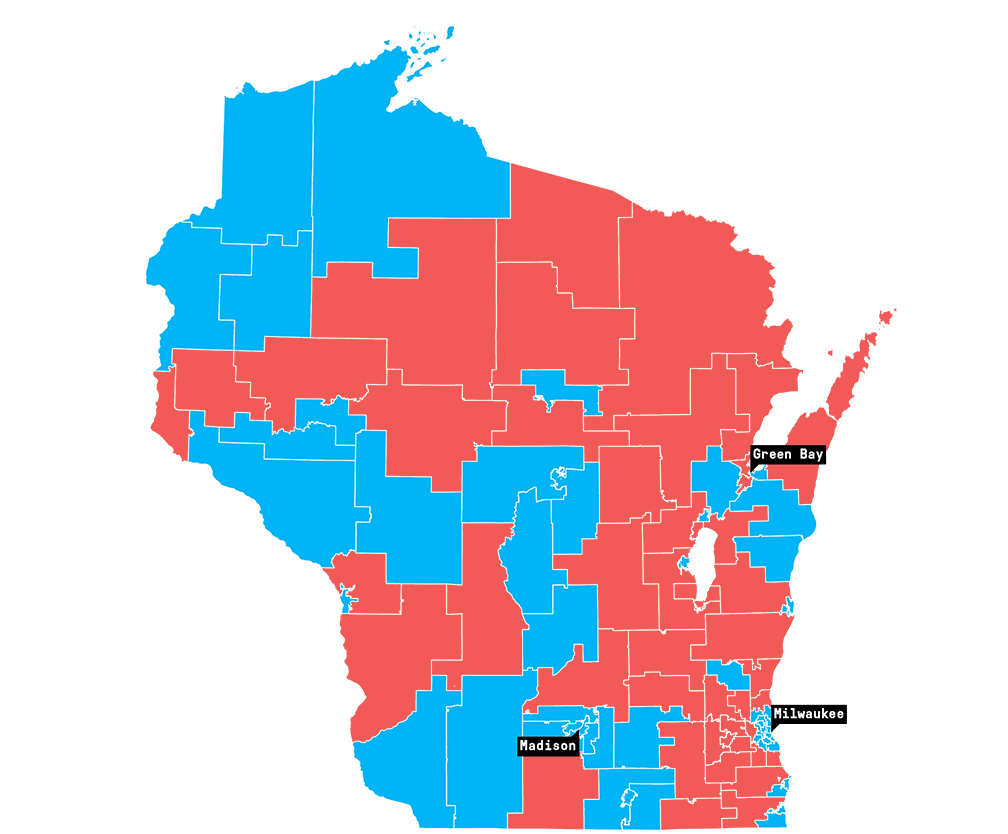
September 2017 – Maps and charts on the Wisconsin State Assembly elections for an article about Gerrymandering for New York Times Magazine.
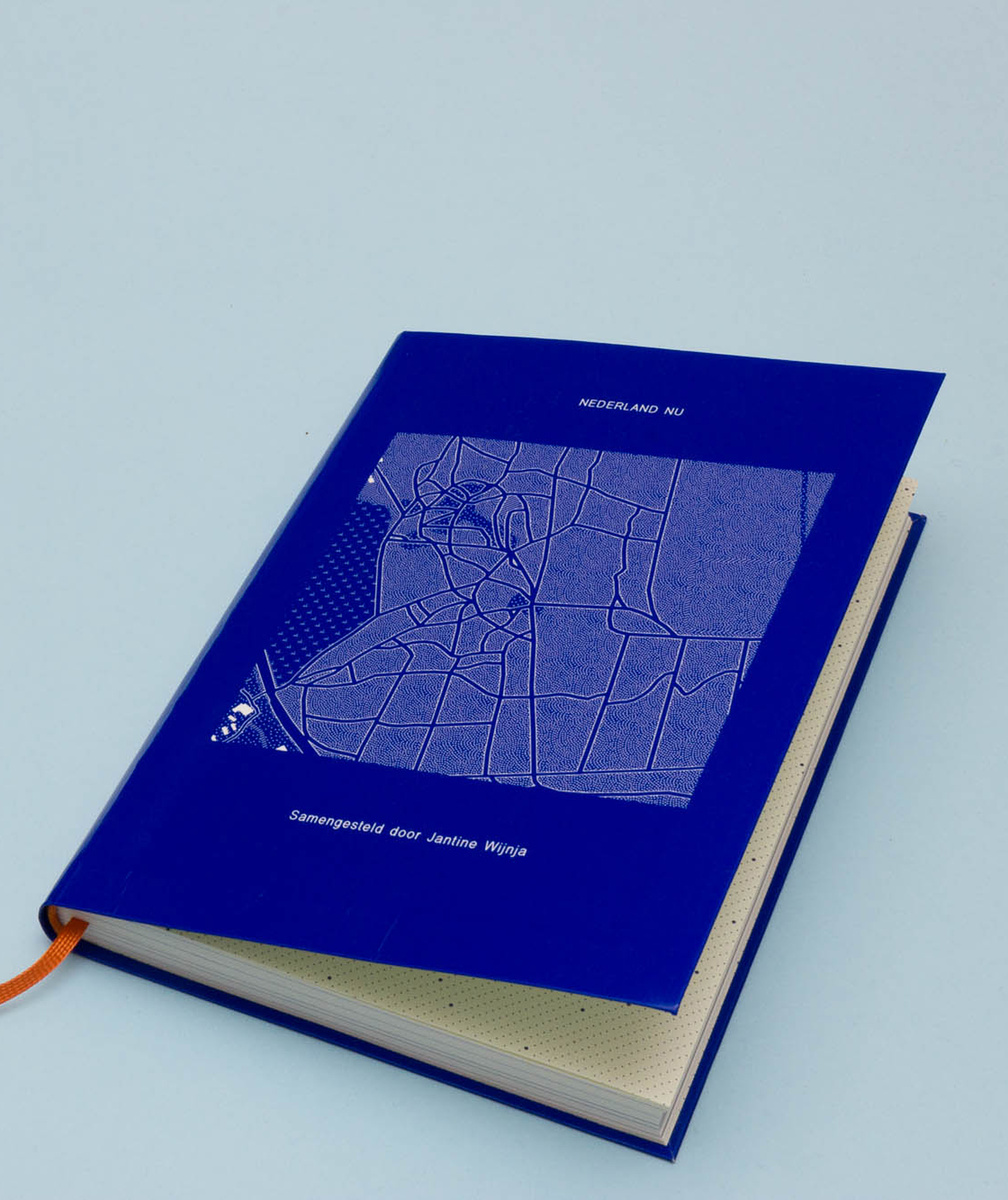
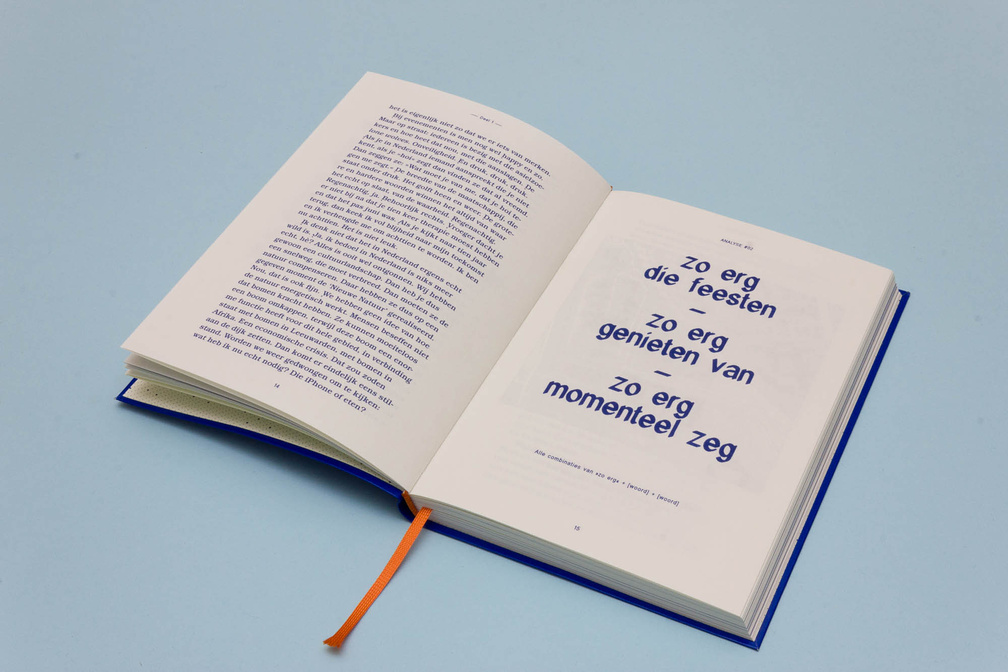
June 2017 – Book Design, text analysis, machine monologues and maps for ‘Dit Is Nu’ (‘This is Now’), an ongoing project of Jantine Wijnja.

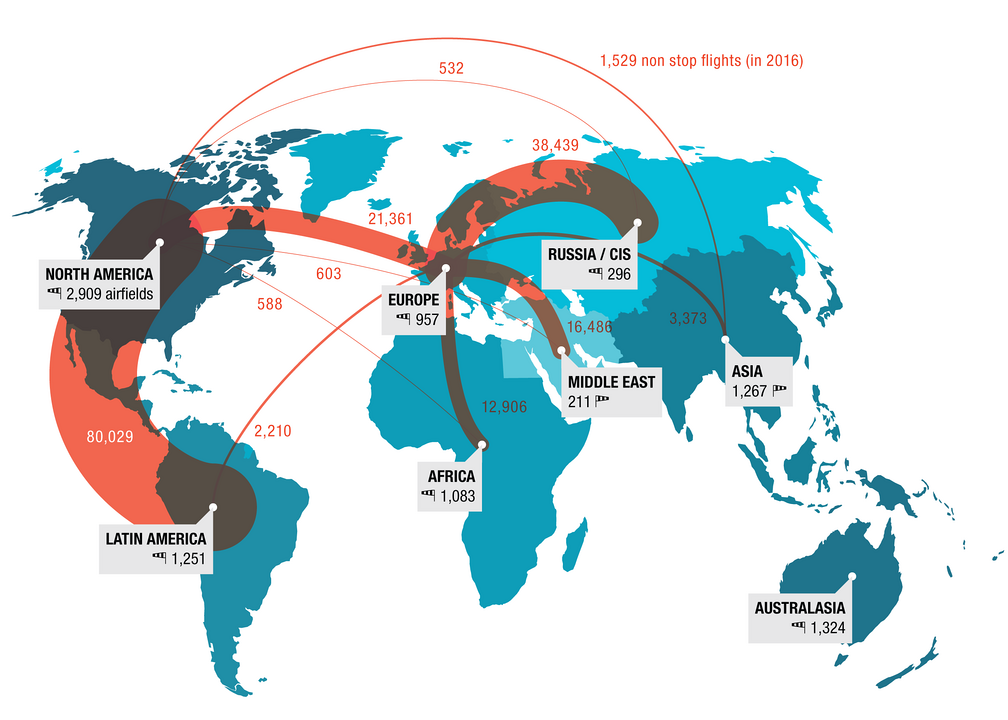
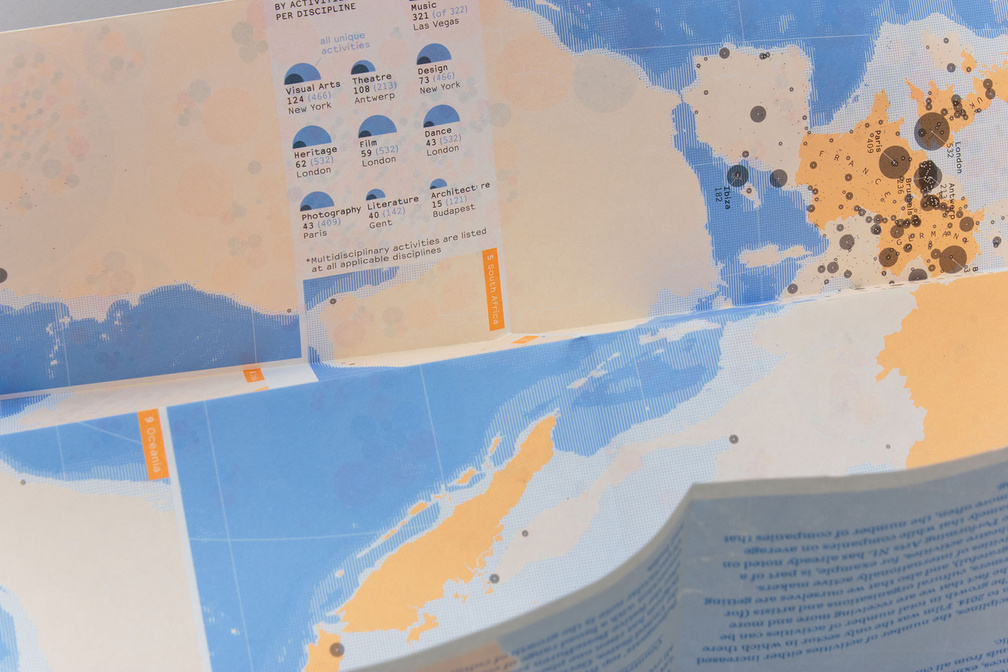
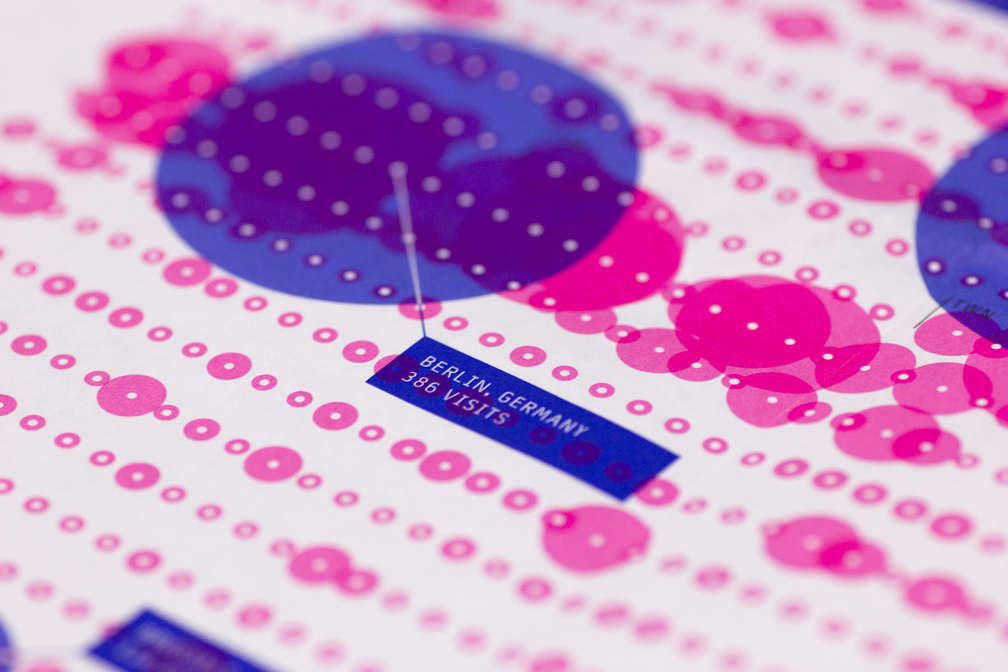
June 2017 – Annual report for DutchCulture, centre for international cooperation, Amsterdam (NL) visualising all cultural activities of dutch artists around the globe in 2016. All activities are sorted by country, city and discipline.
February 2017 – Maps and graphics for ‘The Wealth Report 2017’ published by Knight Frank, London (UK).
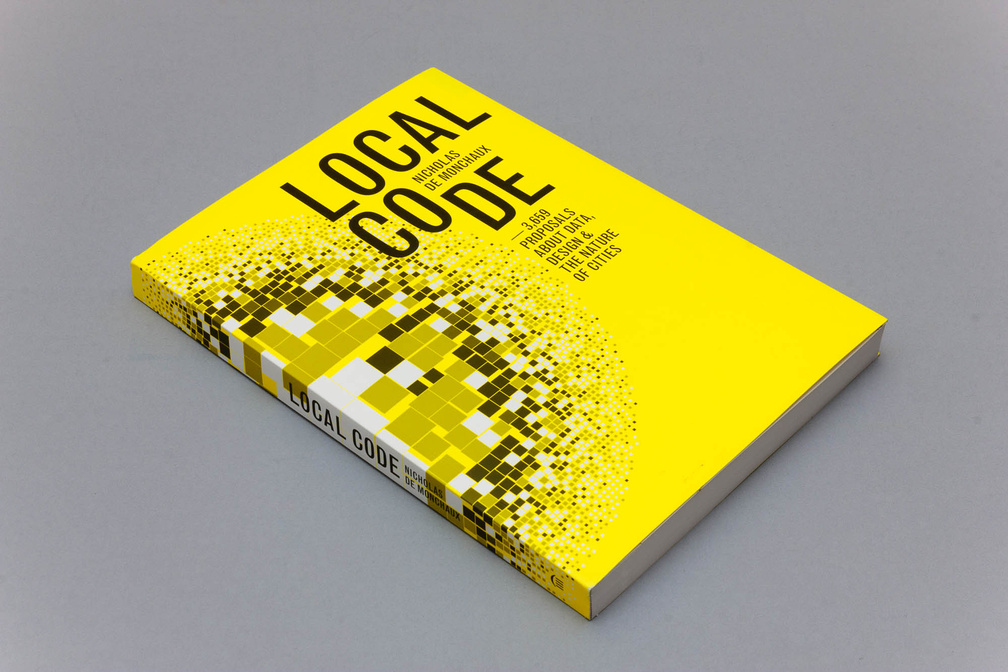

October 2016 – Book Design for Nicholas de Monchaux's book ‘Local Code: 3,659 Proposals About Data, Design, and the Nature of Cities’ published by Princeton Architectural Press. The book's data-driven layout arranges drawings of 3,659 digitally-tailored interventions for vacant public land in San Francisco, Los Angeles, New York City, and Venice (IT).
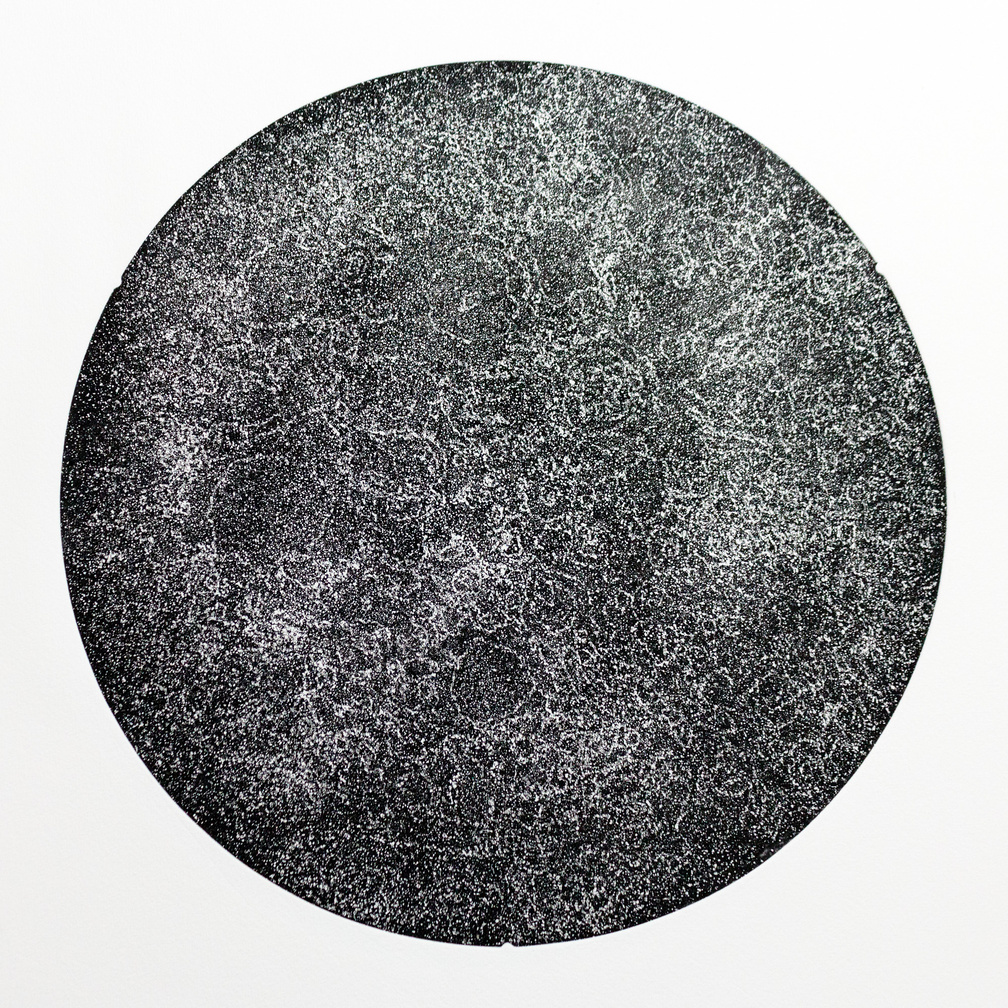
October 2016 – Aquatint print of the surface of the near- and far-side of the Moon.
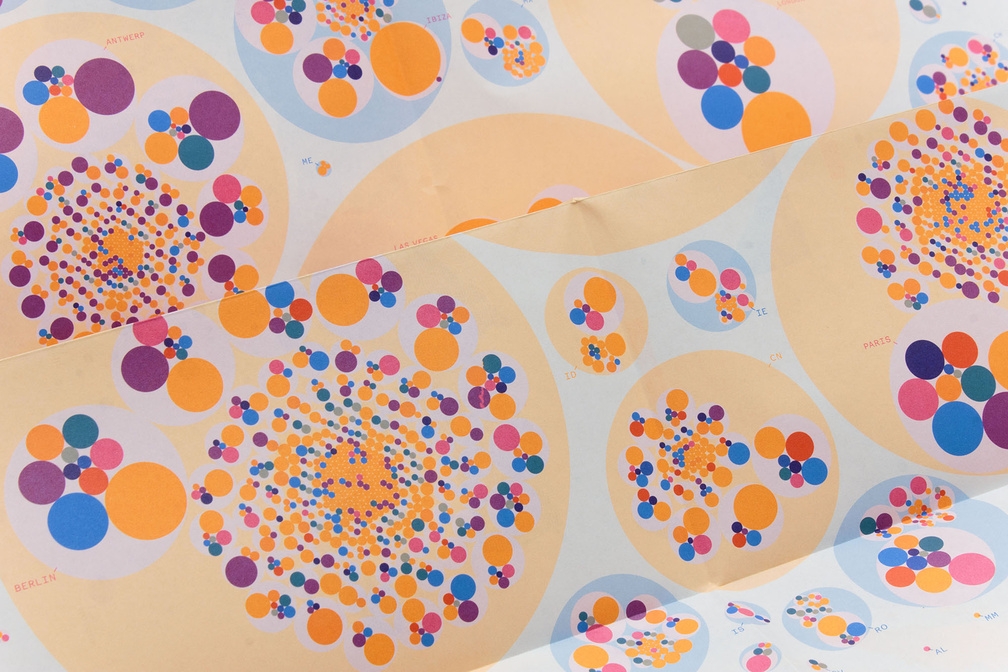
June 2016 – Annual report for DutchCulture, centre for international cooperation, Amsterdam (NL) visualising all 14,470 cultural activities of dutch artists around the globe in 2015. All activities are sorted by country, city and discipline.
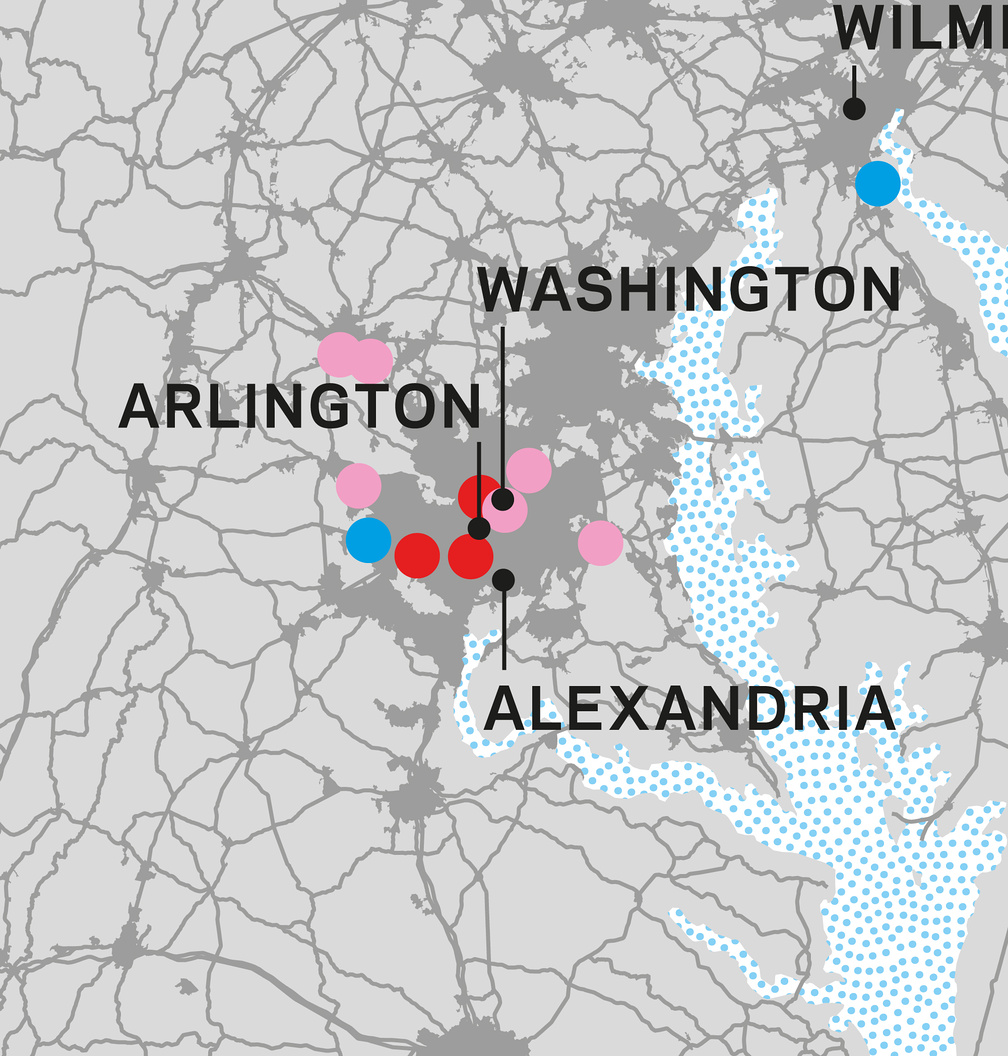
June 2015 – Maps and charts on new community sales in the US for BUILDER Magazine, Washington D.C. (US).
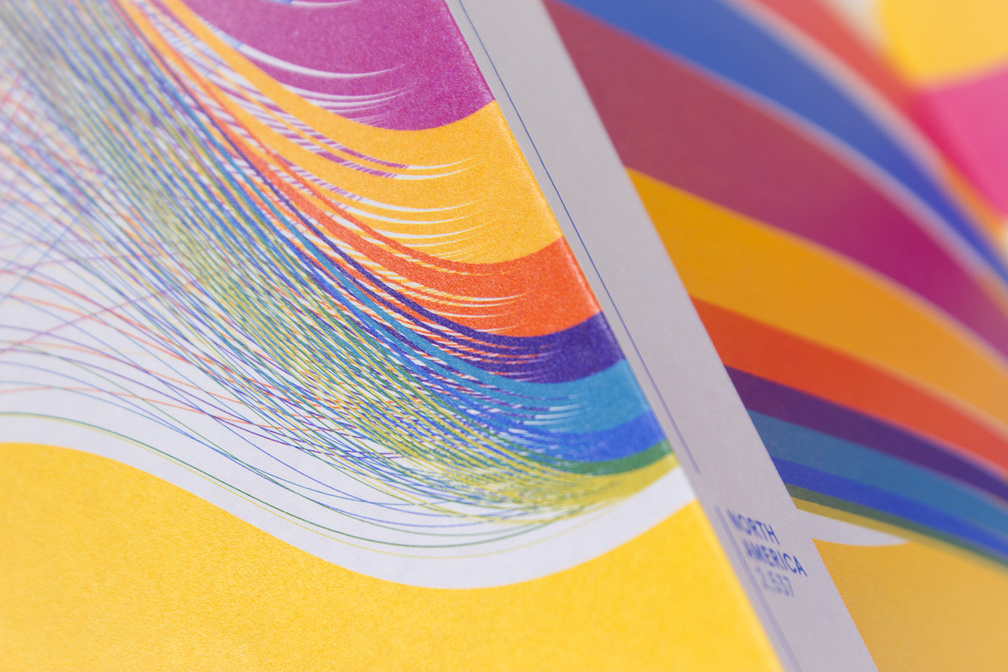
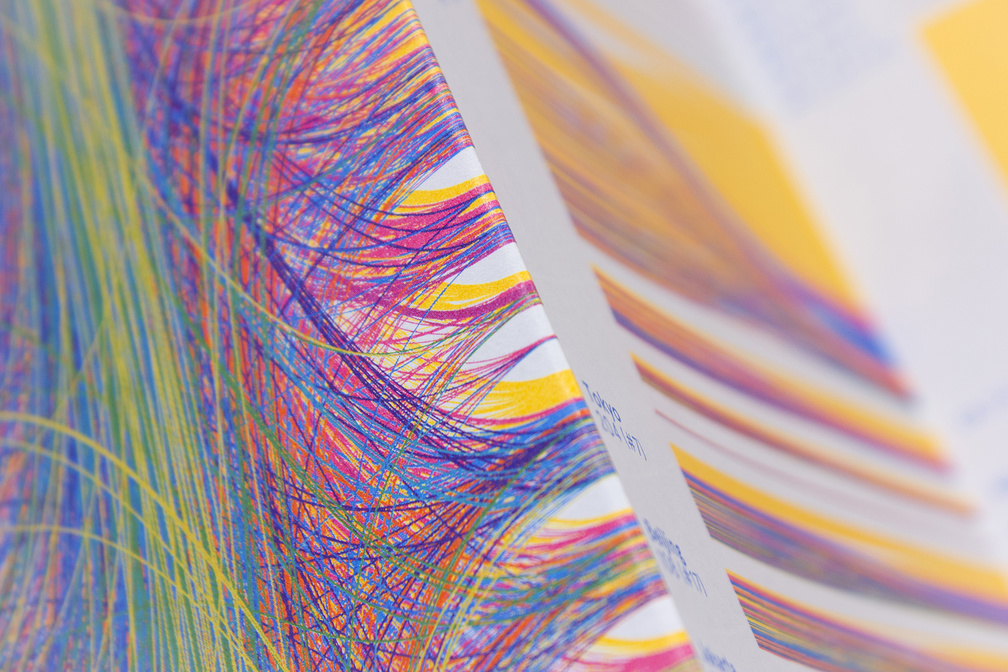
May 2015 – Annual report for DutchCulture, centre for international cooperation, Amsterdam (NL) visualising all 12,978 cultural activities of dutch artists around the globe in 2014. 12,614 activities took place in the top 50 countries and are split up by discipline, continent, country, city and traveller.
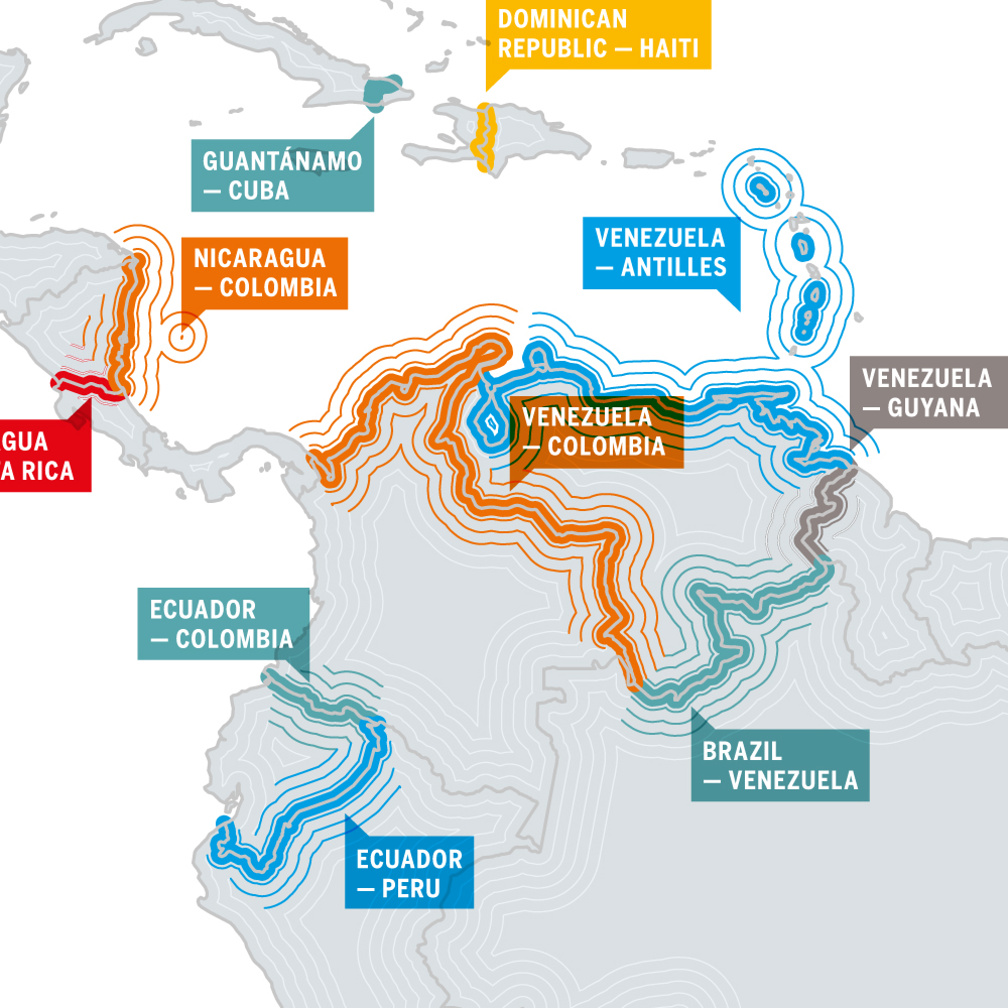
Hot or Not? Border Conflicts in the Americas
February 2015 – A map on border conflicts in The Americas for Americas Quarterly, North Hollywood (US).

July 2014 – Book Design of 'Landscape and Energy' for HNS landscape architects – a book about the effects of the transition from fossil fuels to renewable energy on our environment.
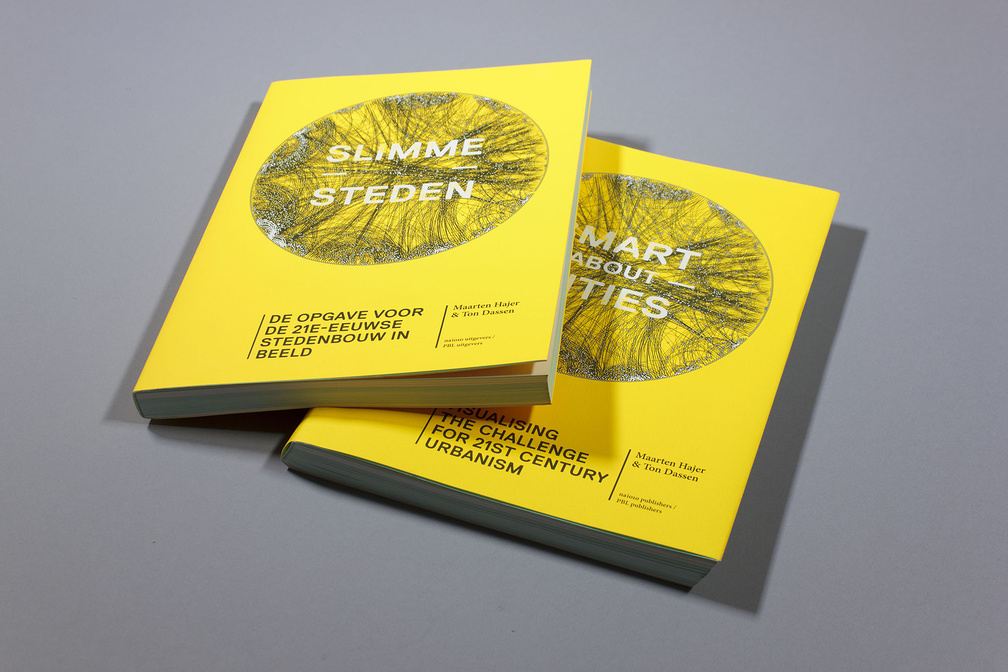
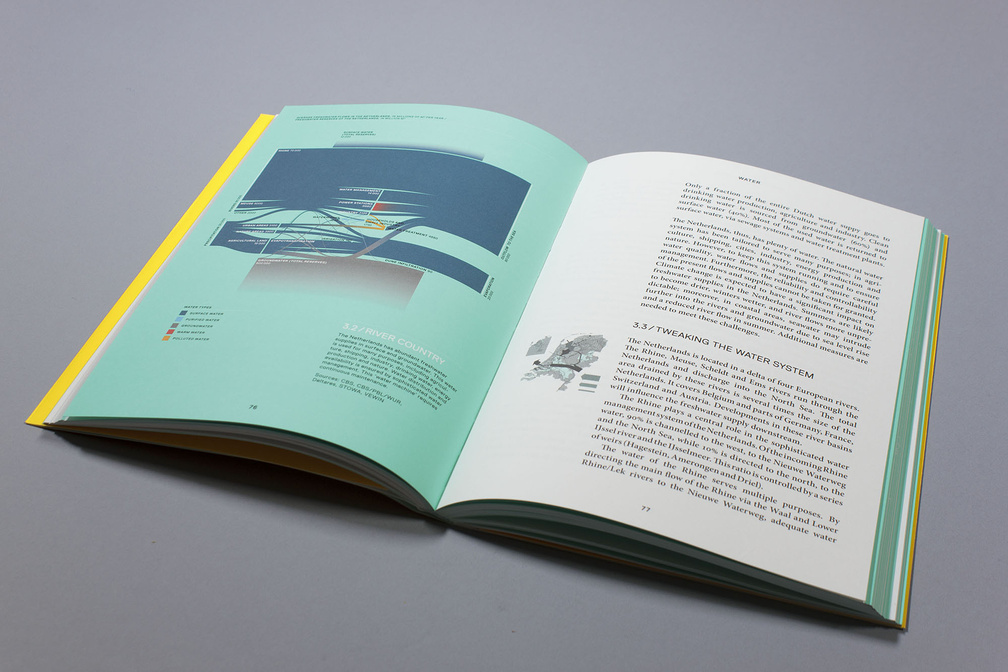
June 2014 – Book Design and Infographics for 'Smart about Cities' commissioned by PBL Netherlands Environmental Assessment Agency.
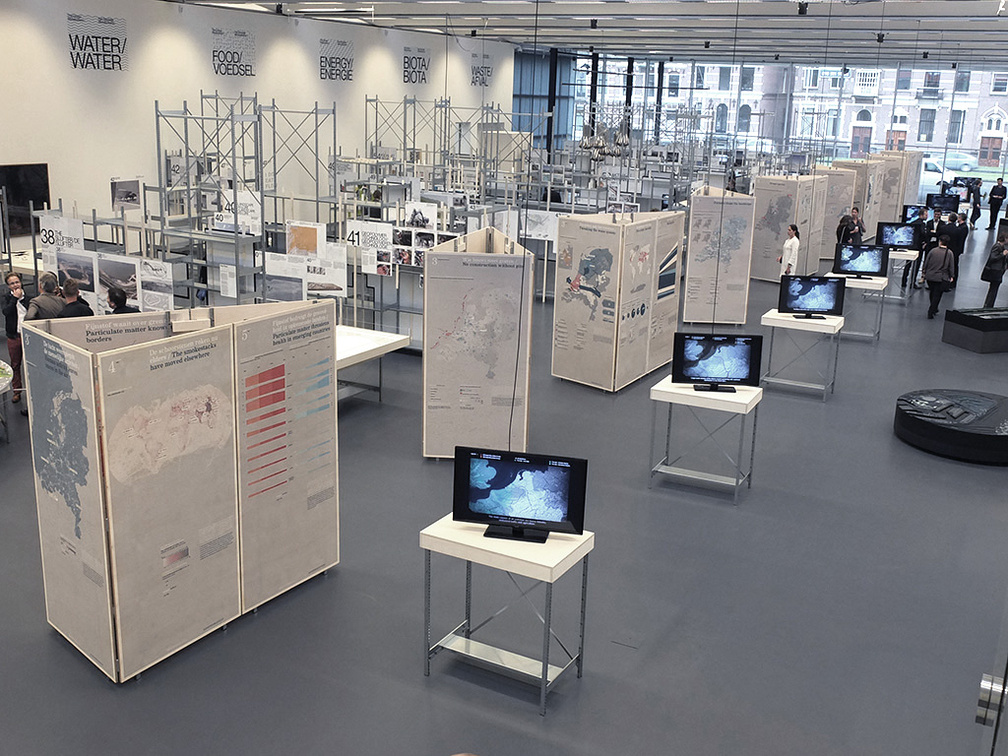
May 2014 – 45 large scale Infographics for IABR–2014–Urban by Nature, the International Architecture Biennale Rotterdam.
UNSPEAK
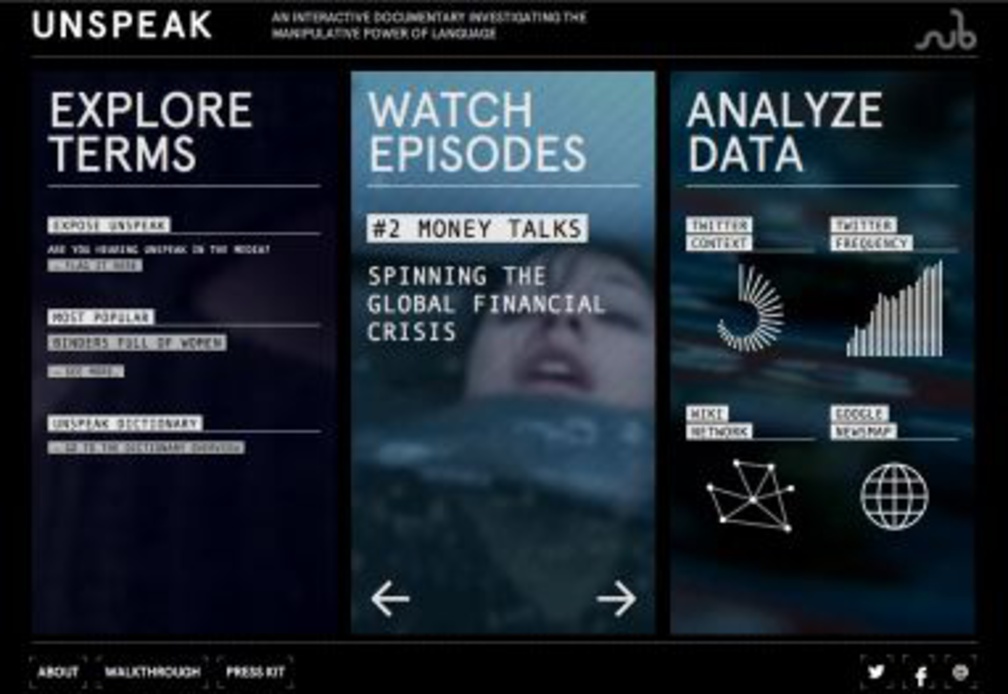
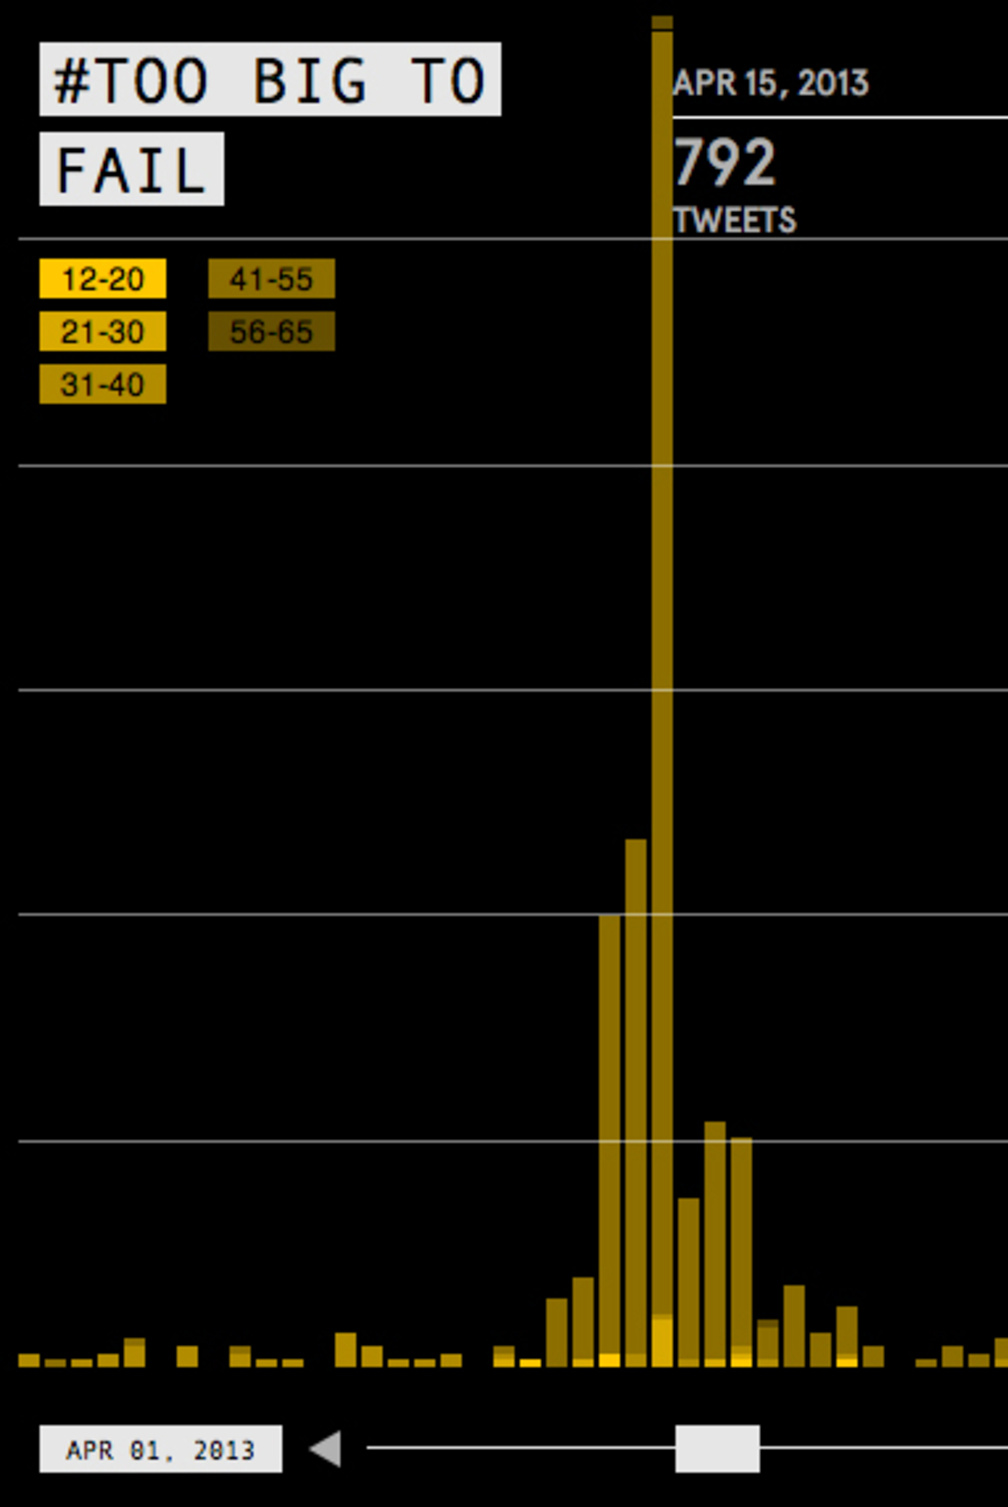
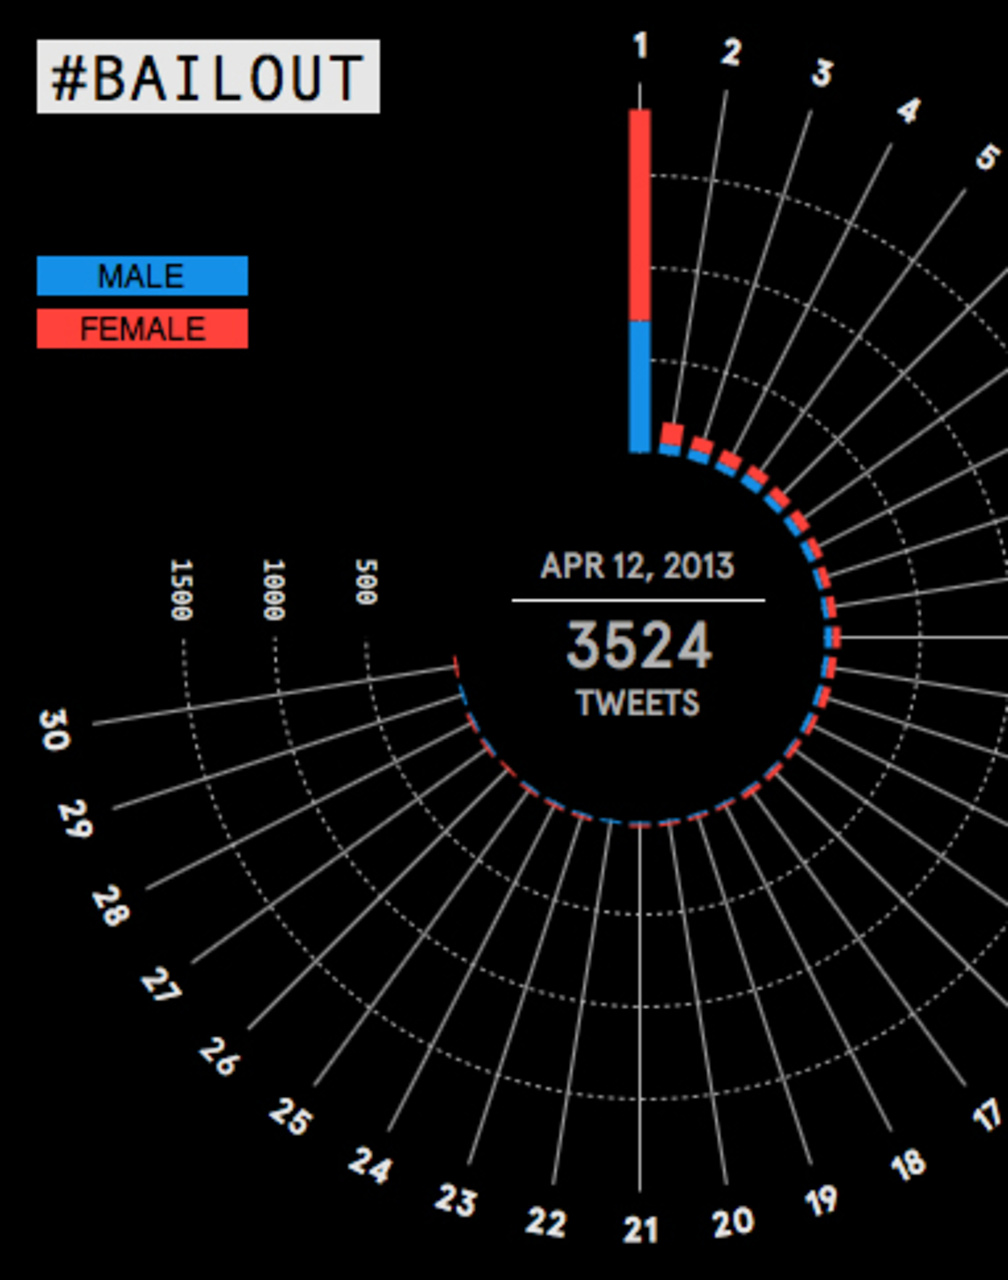
July 2013 – 'UNSPEAK' is a web-based interactive documentary investigating the manipulative power of language, based on the book by Steven Poole. A dictionary, datavisualizations and short films made by different directors reveal the unspoken messages and obscured meanings behind familiar media terms such as Weapons of Mass Destruction or Binders Full of Women. In collaboration with Submarine , Systemantics .
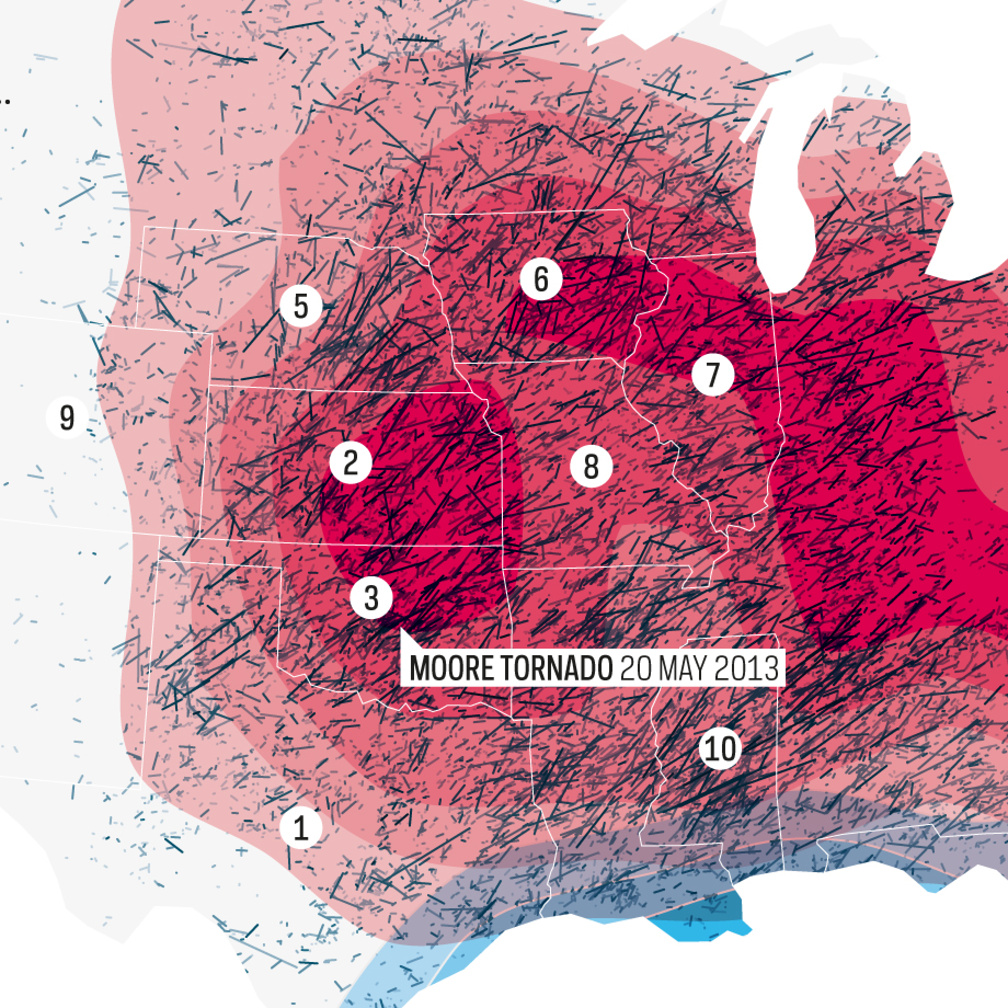
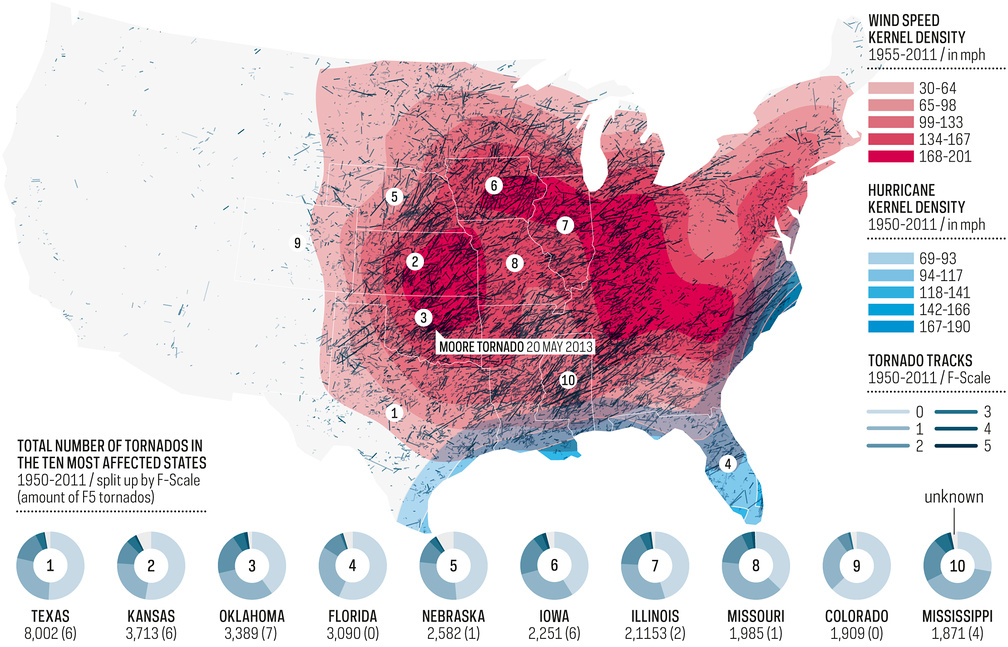
Disaster Strikes
June 2013 – Map for BUILDER Magazine, Washington D.C. (US) showing severe weather in the US over the past 50 years: Tornado Tracks, Kernel Wind and Hurricane Density.
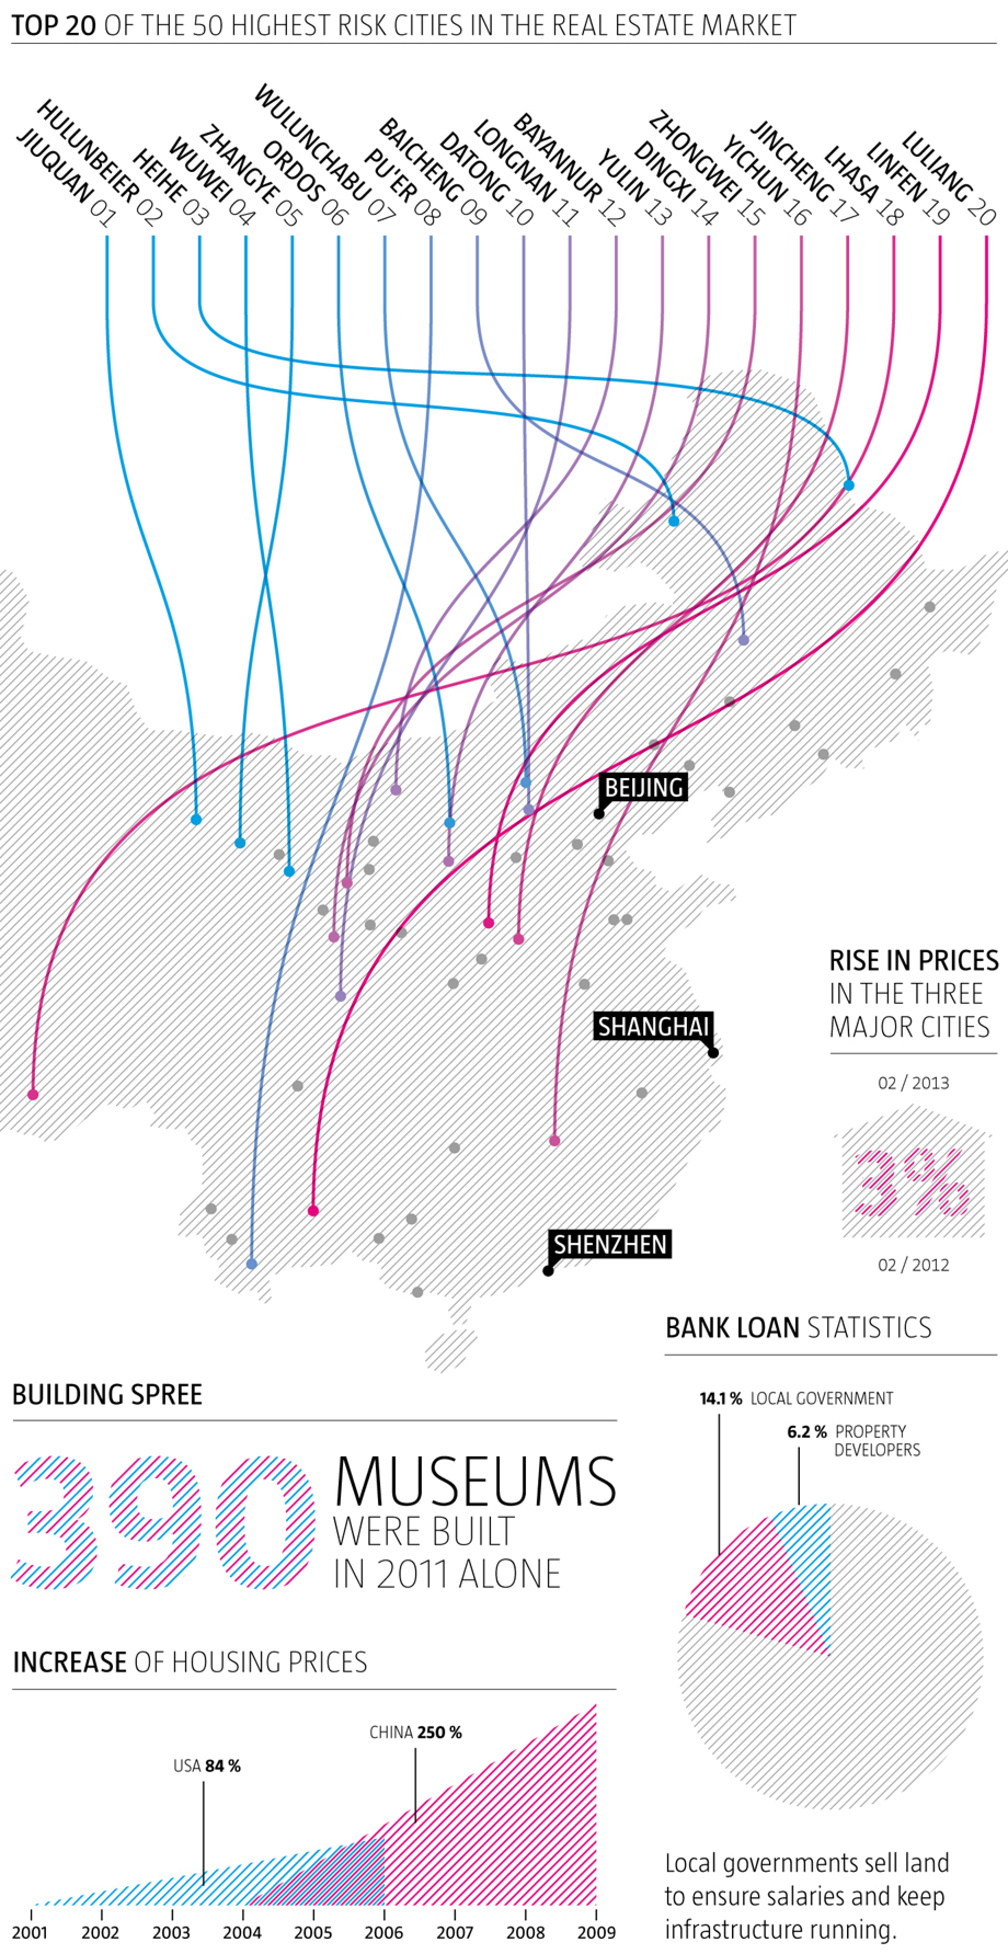
Is China's Real Estate Bubble About to Burst?
June 2013 – Map and infographics for Architect Magazine, Washington D.C. (US).
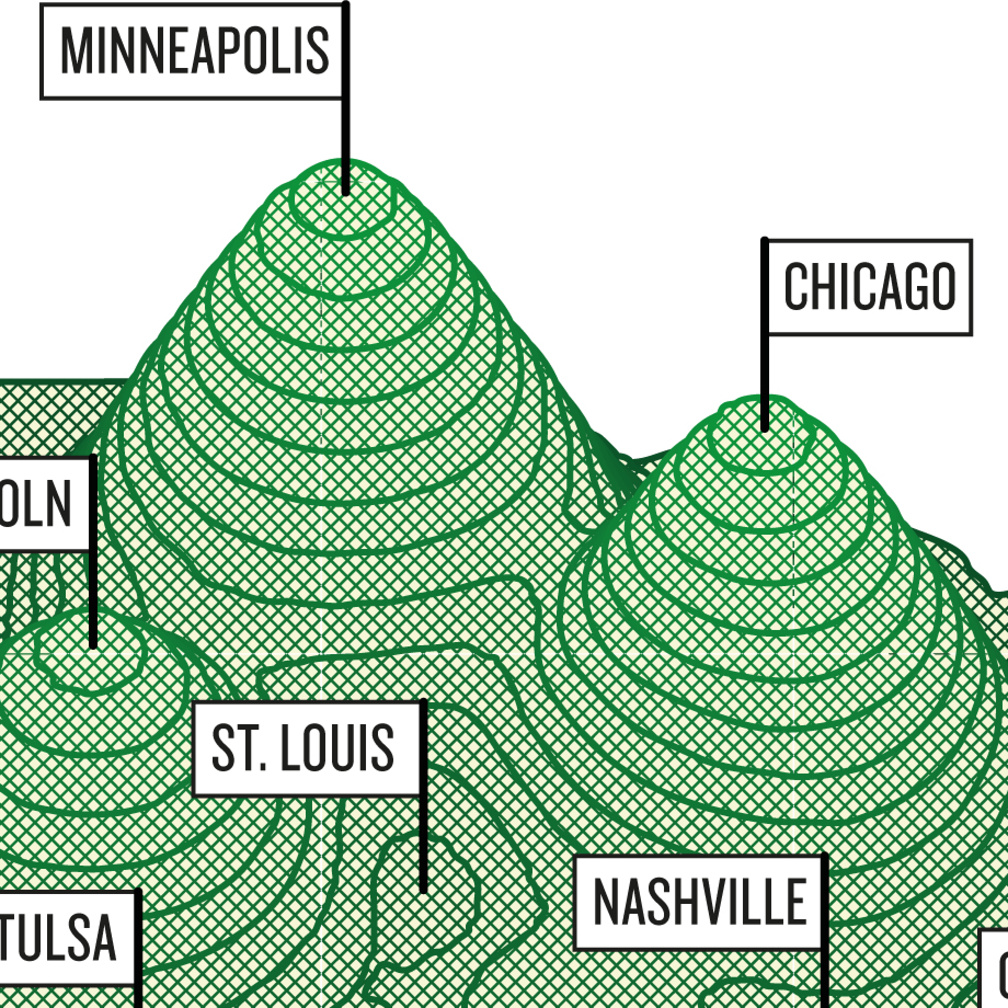
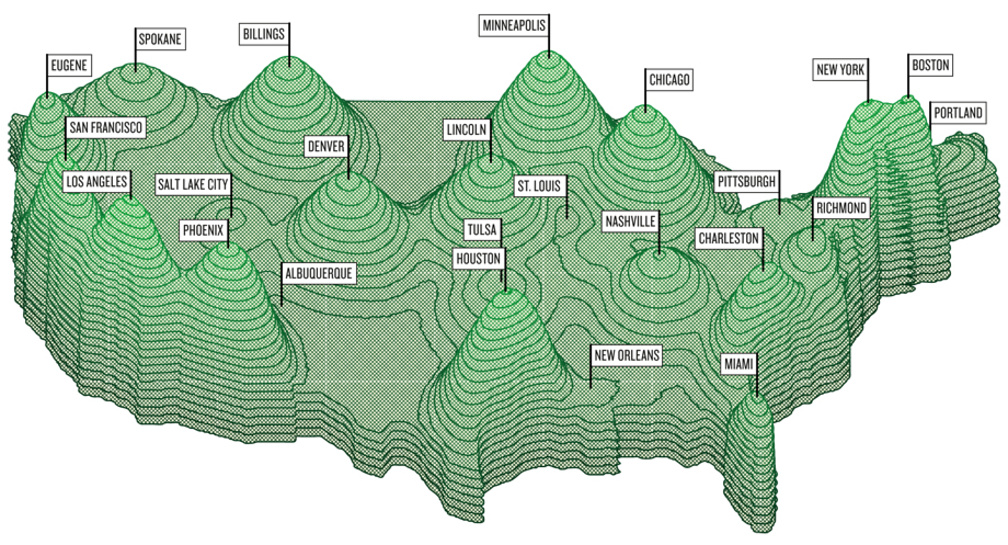
How Much Do You Have to Make to Be Successful?
May 2013 – Illustration for ESQUIRE magazine, New York (US). The map shows how much a family of four need to have to live very well in 24 cities of the US.
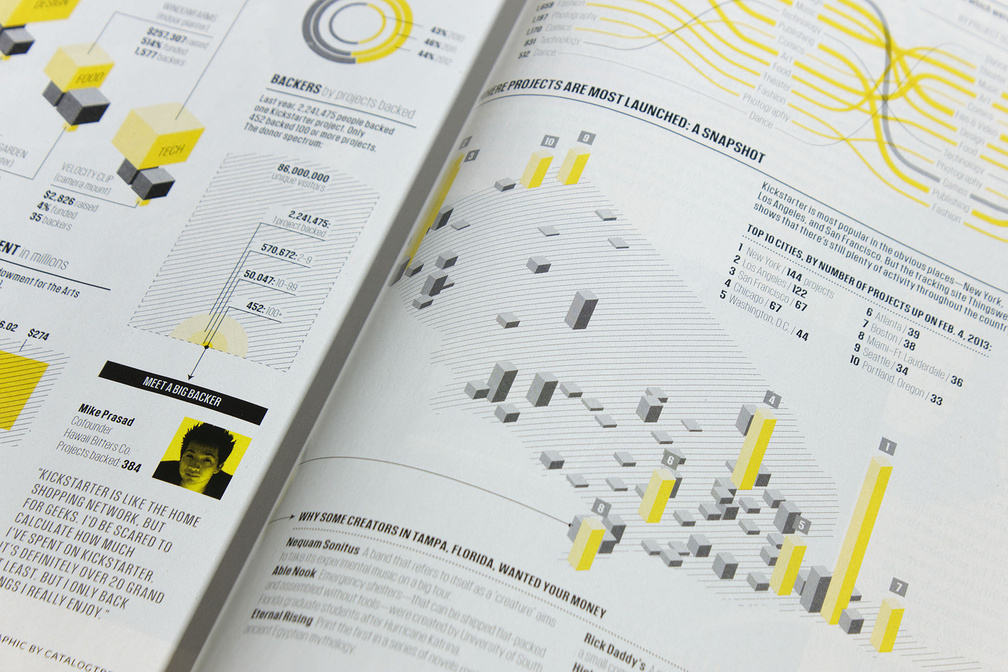
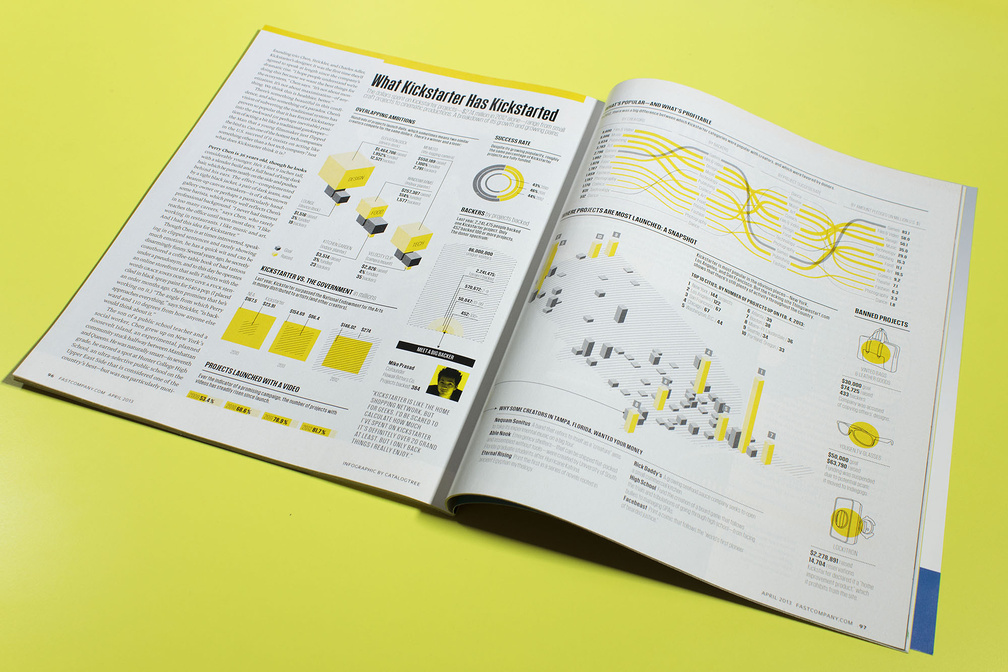
March 2013 – Charts and map about the crowdfunding platform 'Kickstarter' for Fast Company Magazine, Harlan (US).
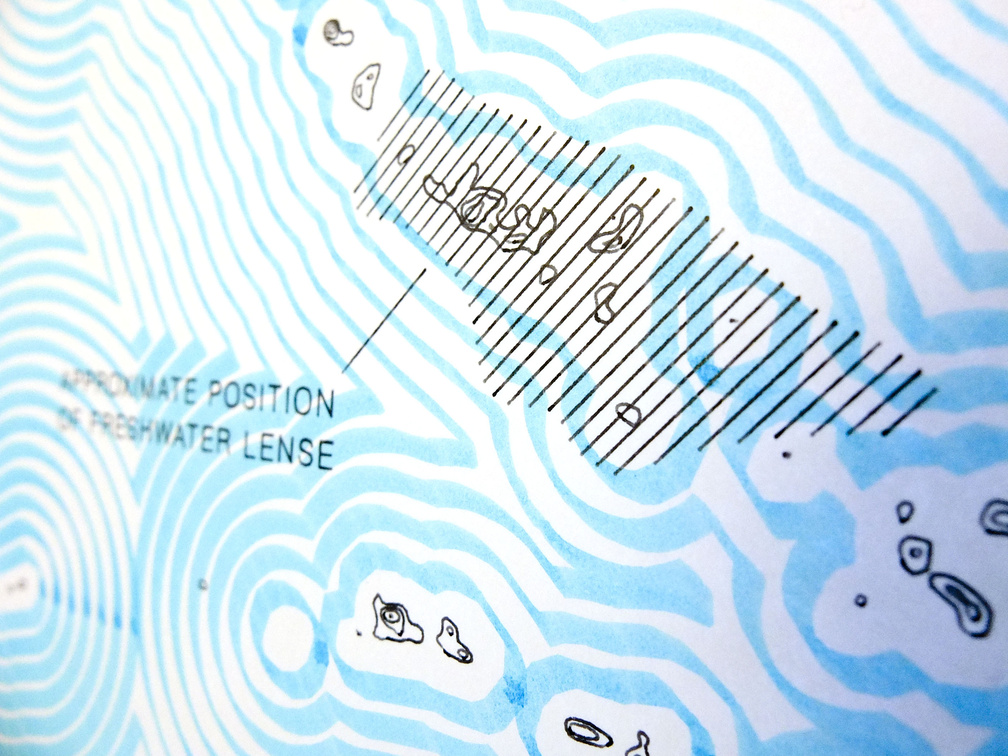
March 2013 – Series of four plotted posters about Tarawa which is part of the island nation Kiribati. With an maximum altitude of about 3 meters above sea level this could be the first nation which inhabitants have to be relocated in the next 50 years due to rising sea levels and pollution of drinking water.
cijferstad
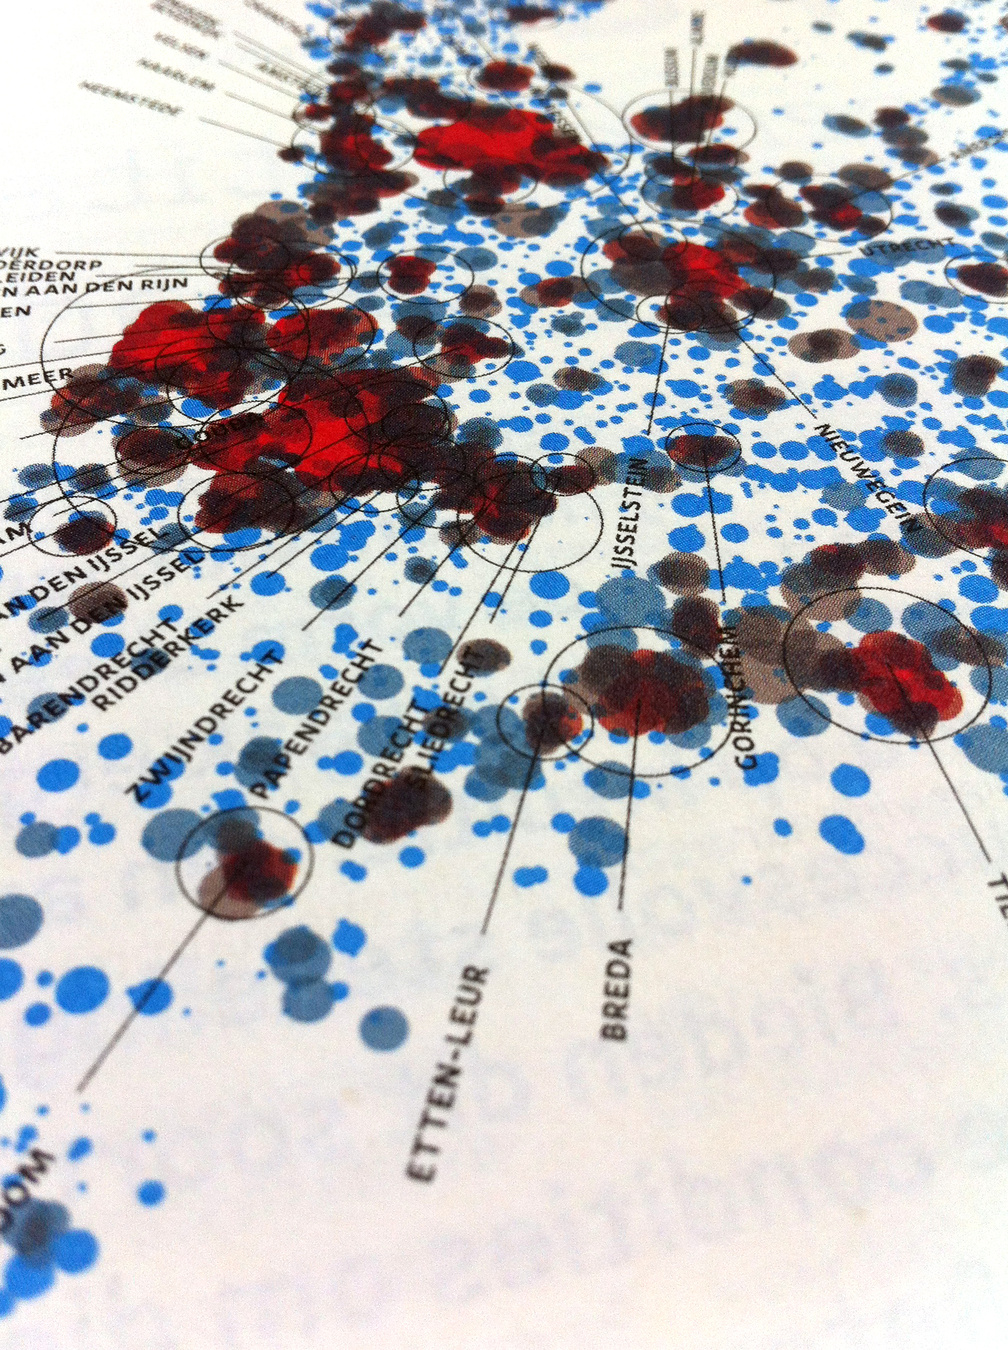
September 2012 – Map for S+RO magazine, The Hague (NL) that shows the urbanisation of dutch communities by neighbourhoods. The size of the circles is based on the population, the color on the amount of addresses/km2.
July 2011 – Data mining and visualization for SICA, Amsterdam (NL). Who are the most traveling dutch artists in 2010 and where did they go?
The Great Minerals Game
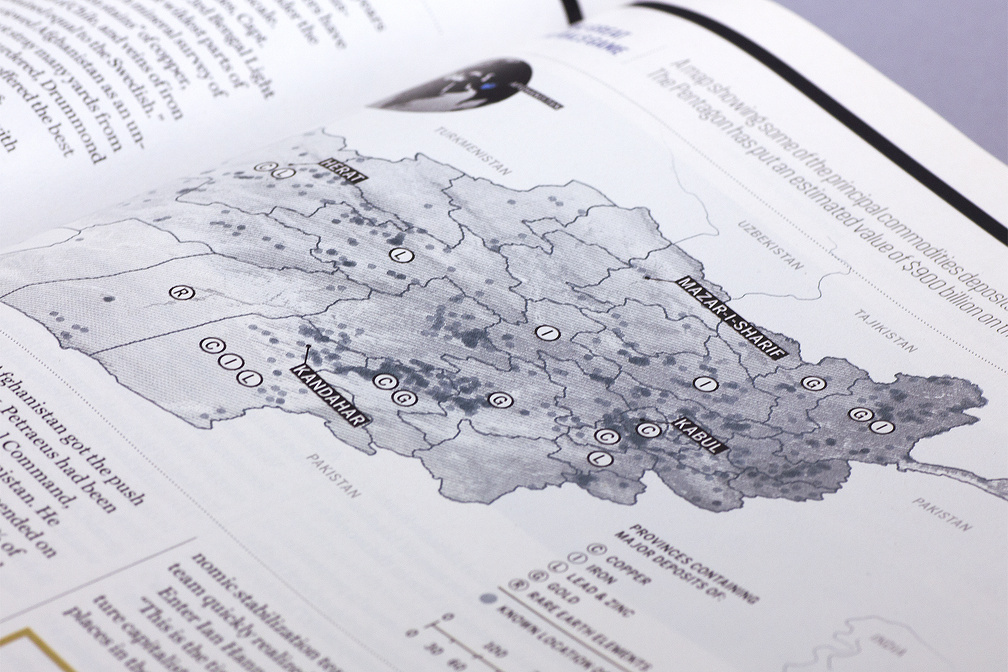
May 2011 – Map showing some of the principal commodities deposits in Afghanistan for Fortune Magazine, New York (US).
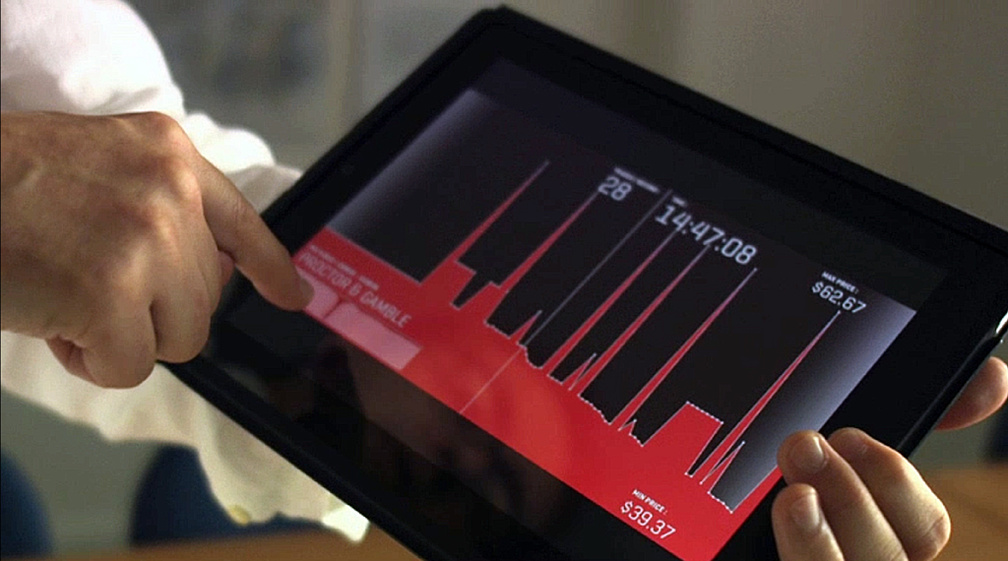
January 2011 – Together with Marije Meerman from VPRO Tegenlicht we developed a TouchDoc app for the iPad.
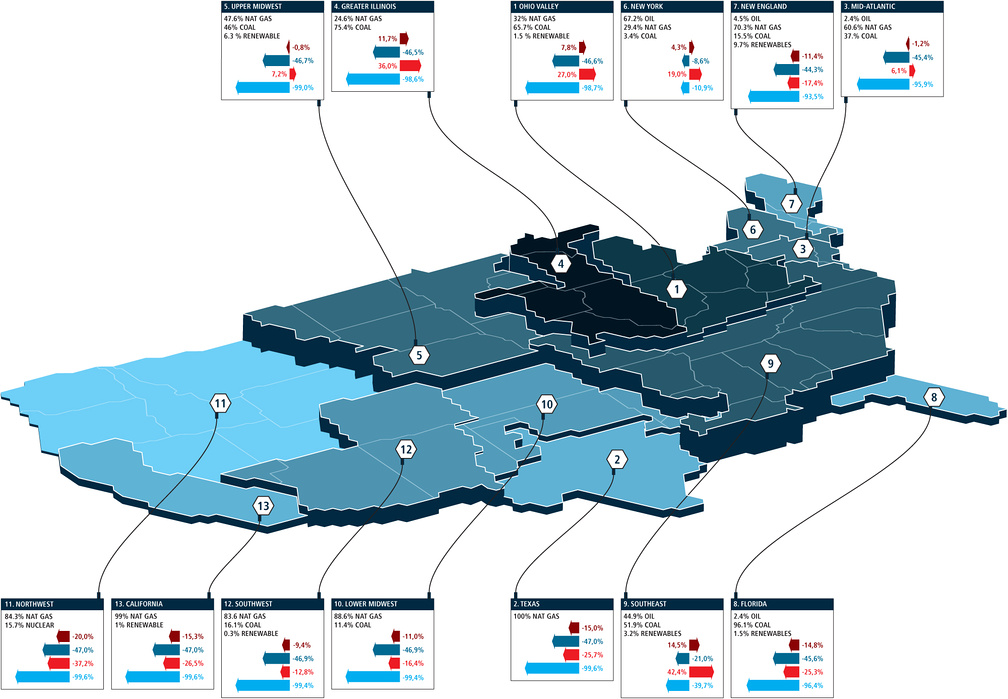
The Dirty Truth about Plug-In Hybrids
April 2010 – Map showing sustainable energy in the 13 electric power grid regions of the U.S. for Scientific American, New York (US).
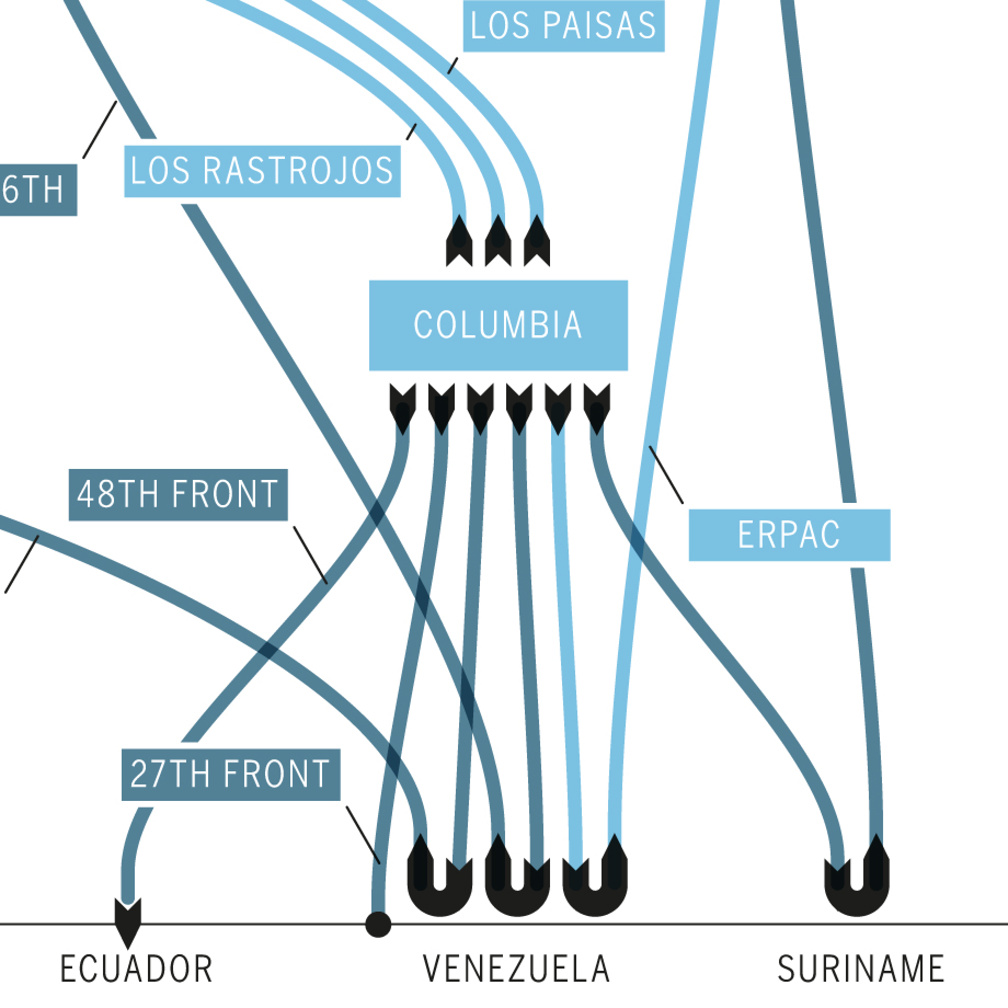
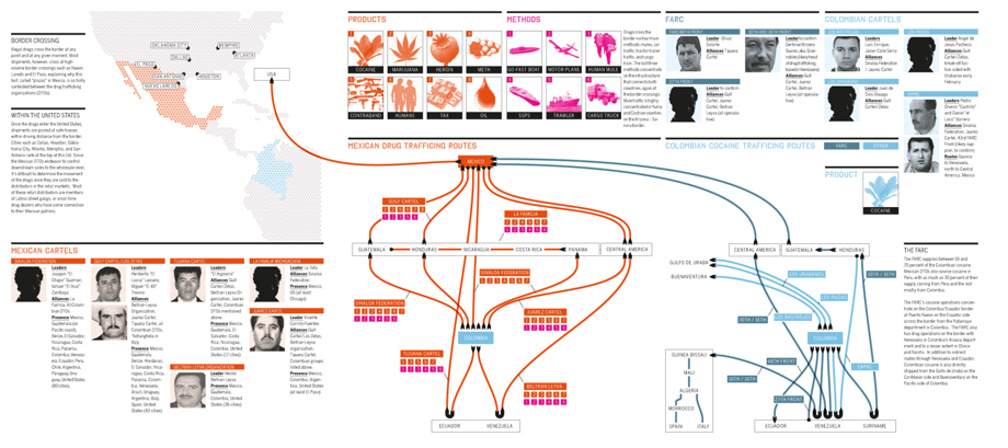
Narco-networks in The Americas
April 2010 – Map and charts on drug-trafficking routes in The Americas for Americas Quarterly, New York (US).
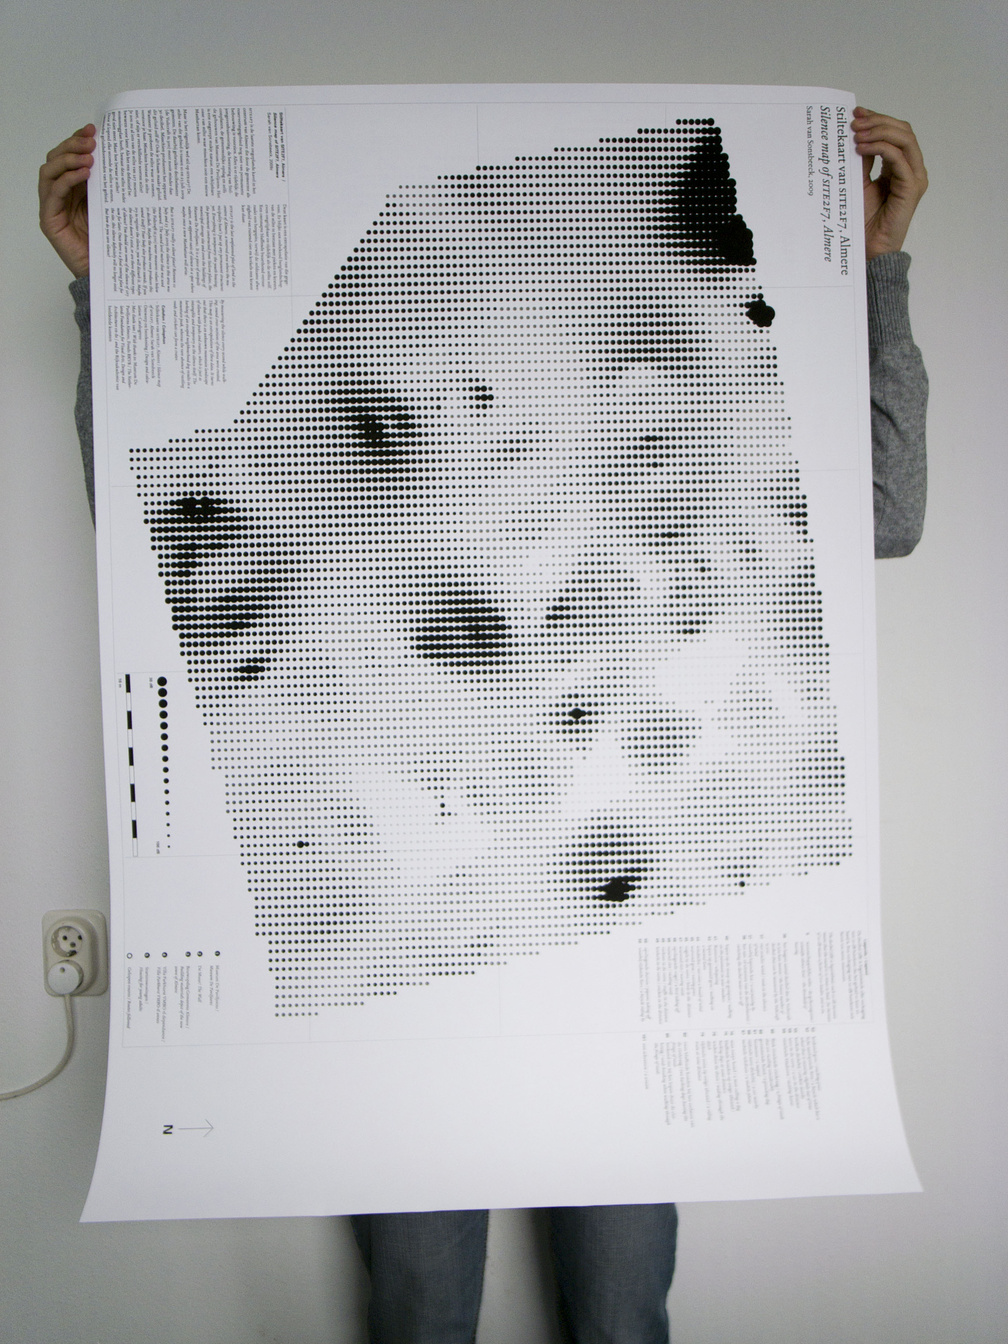
stiltekaart
August 2009 – Visualisaton of sound levels for Sarah van Sonsbeeck. Big dots (darker areas) represent silence as measured by Sarah on site 2F7 in Almere. In collaboration with Sarah van Sonsbeeck (concept, project) , Eva van Diggelen (curator) .
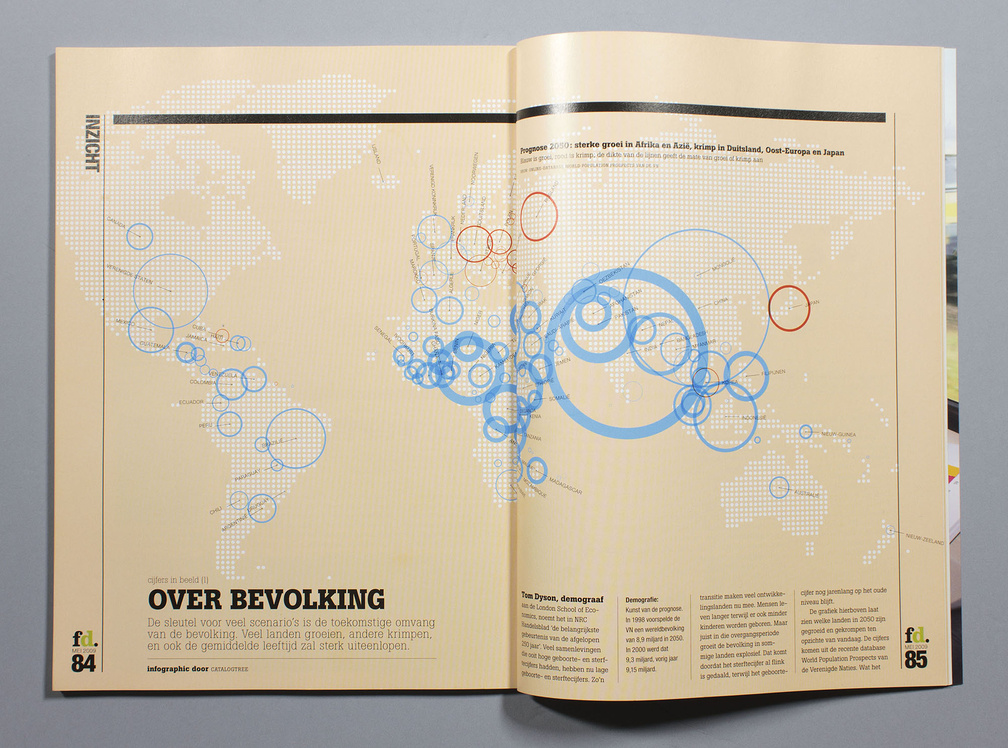
Over bevolking
May 2009 – Map on population growth by city until 2050 for fd Outlook, Amsterdam (NL).
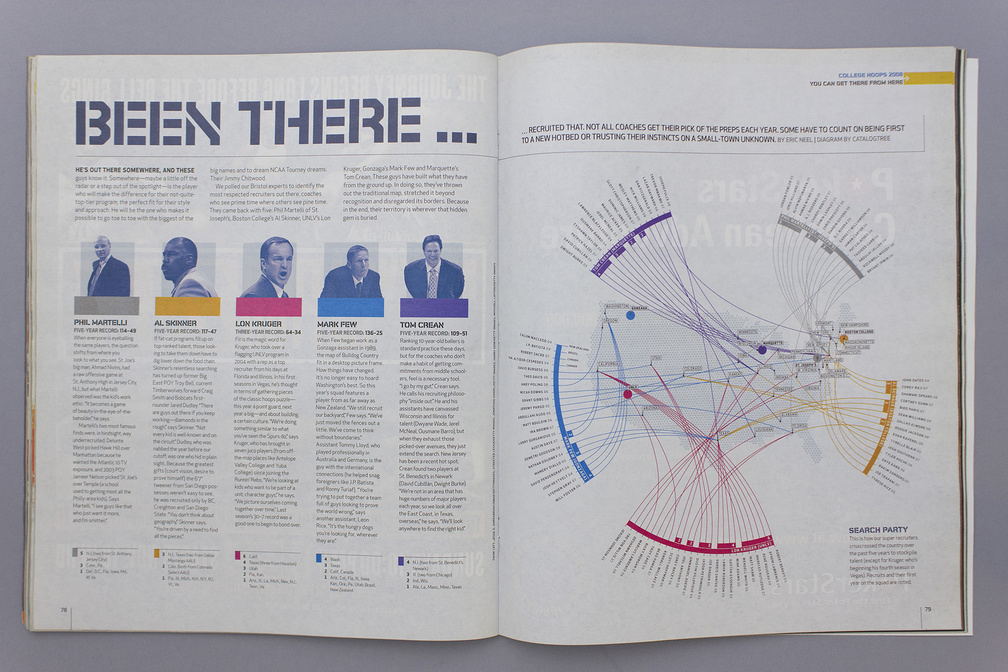
November 2007 – Infographic for ESPN the Magazine, Bristol (USA) showing origin of basketball talent. Recruits and their first year on the squad are noted.
December 2006 – Infographics for 'The 6th Annual in Ideas' in The New York Times Magazine, New York (US).
November 2006 – 'Werken aan de naoorlogse stad' by Endry van Velzen and Willemijn Lofvers, a book about a research fellowship between 2002 and 2006.
transurban poster
September 2006 – Poster for the book 'Werken aan de naoorlogse stad' by Endry van Velzen and Willemijn Lofvers about a research fellowship between 2002 and 2006.