January 2008 – Poster series on Parking Violations by Diplomats in New York City, 1997–2005. Thanks to Ray Fisman and Edward Miguel for kindly permitting us to use their data.
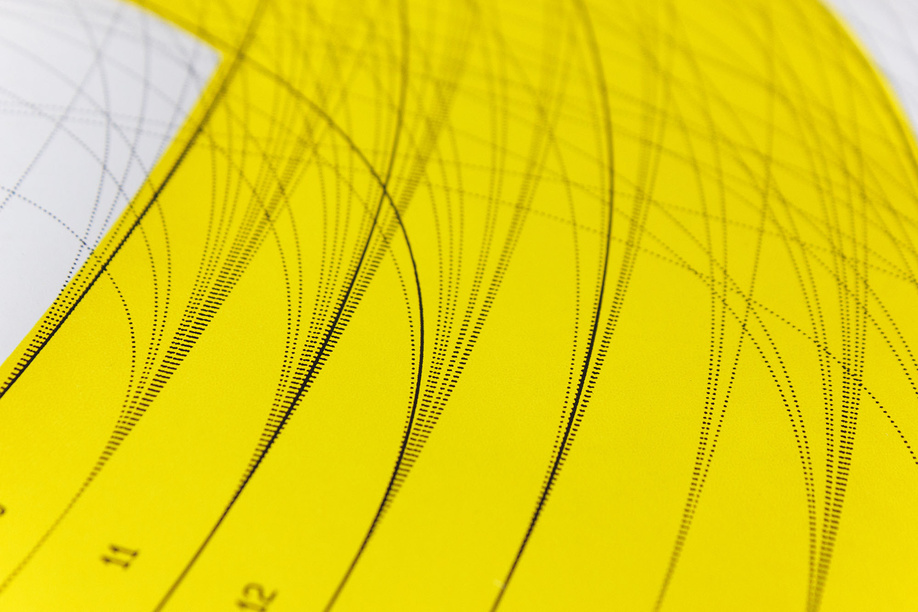
FD1: The graphic shows all violations/hour for each hour of 1999 to 2002. The violations are plotted in relation to the sun position as seen from Central Park. Thanks to Ray Fisman and Edward Miguel for kindly permitting us to use their data.
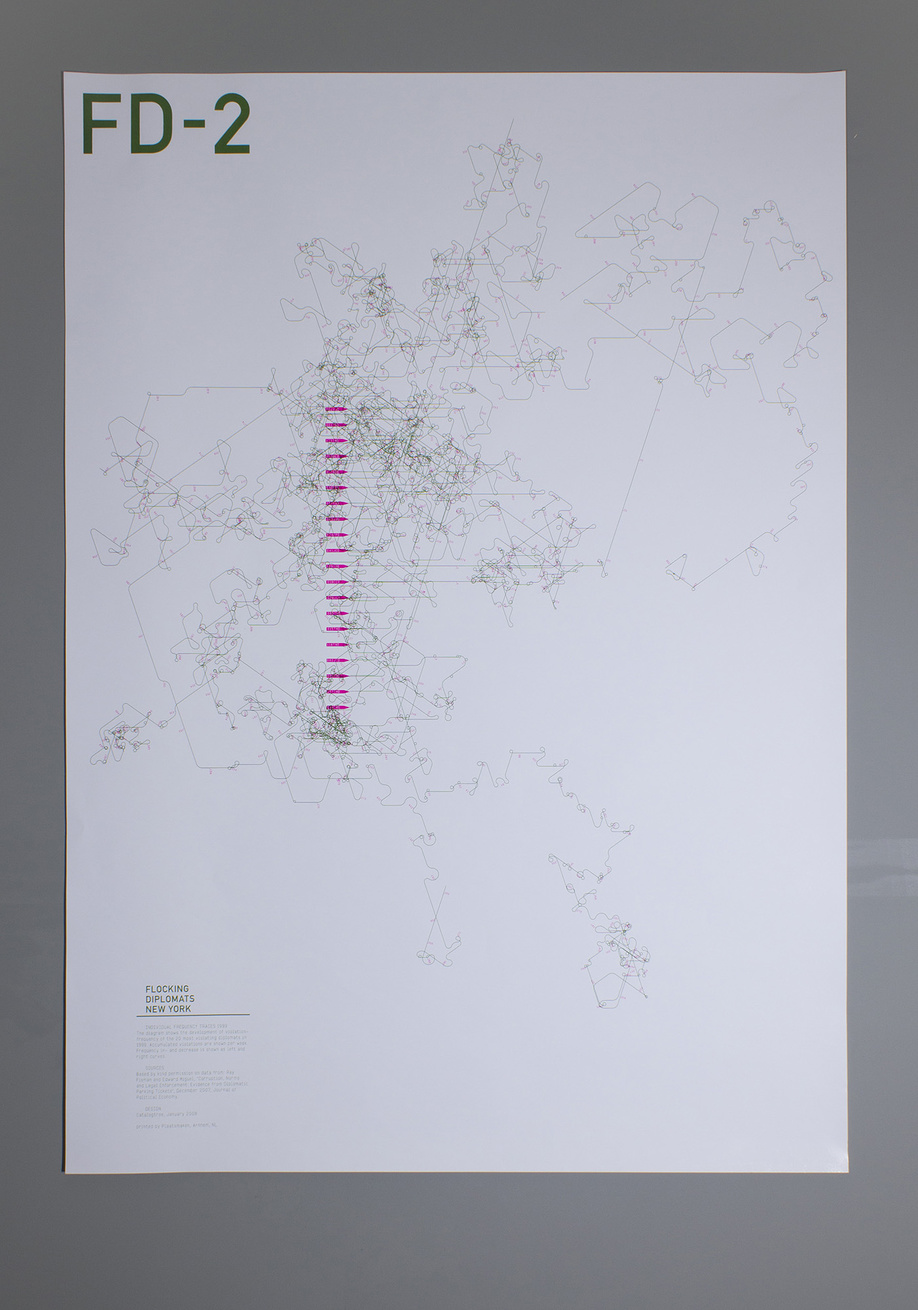
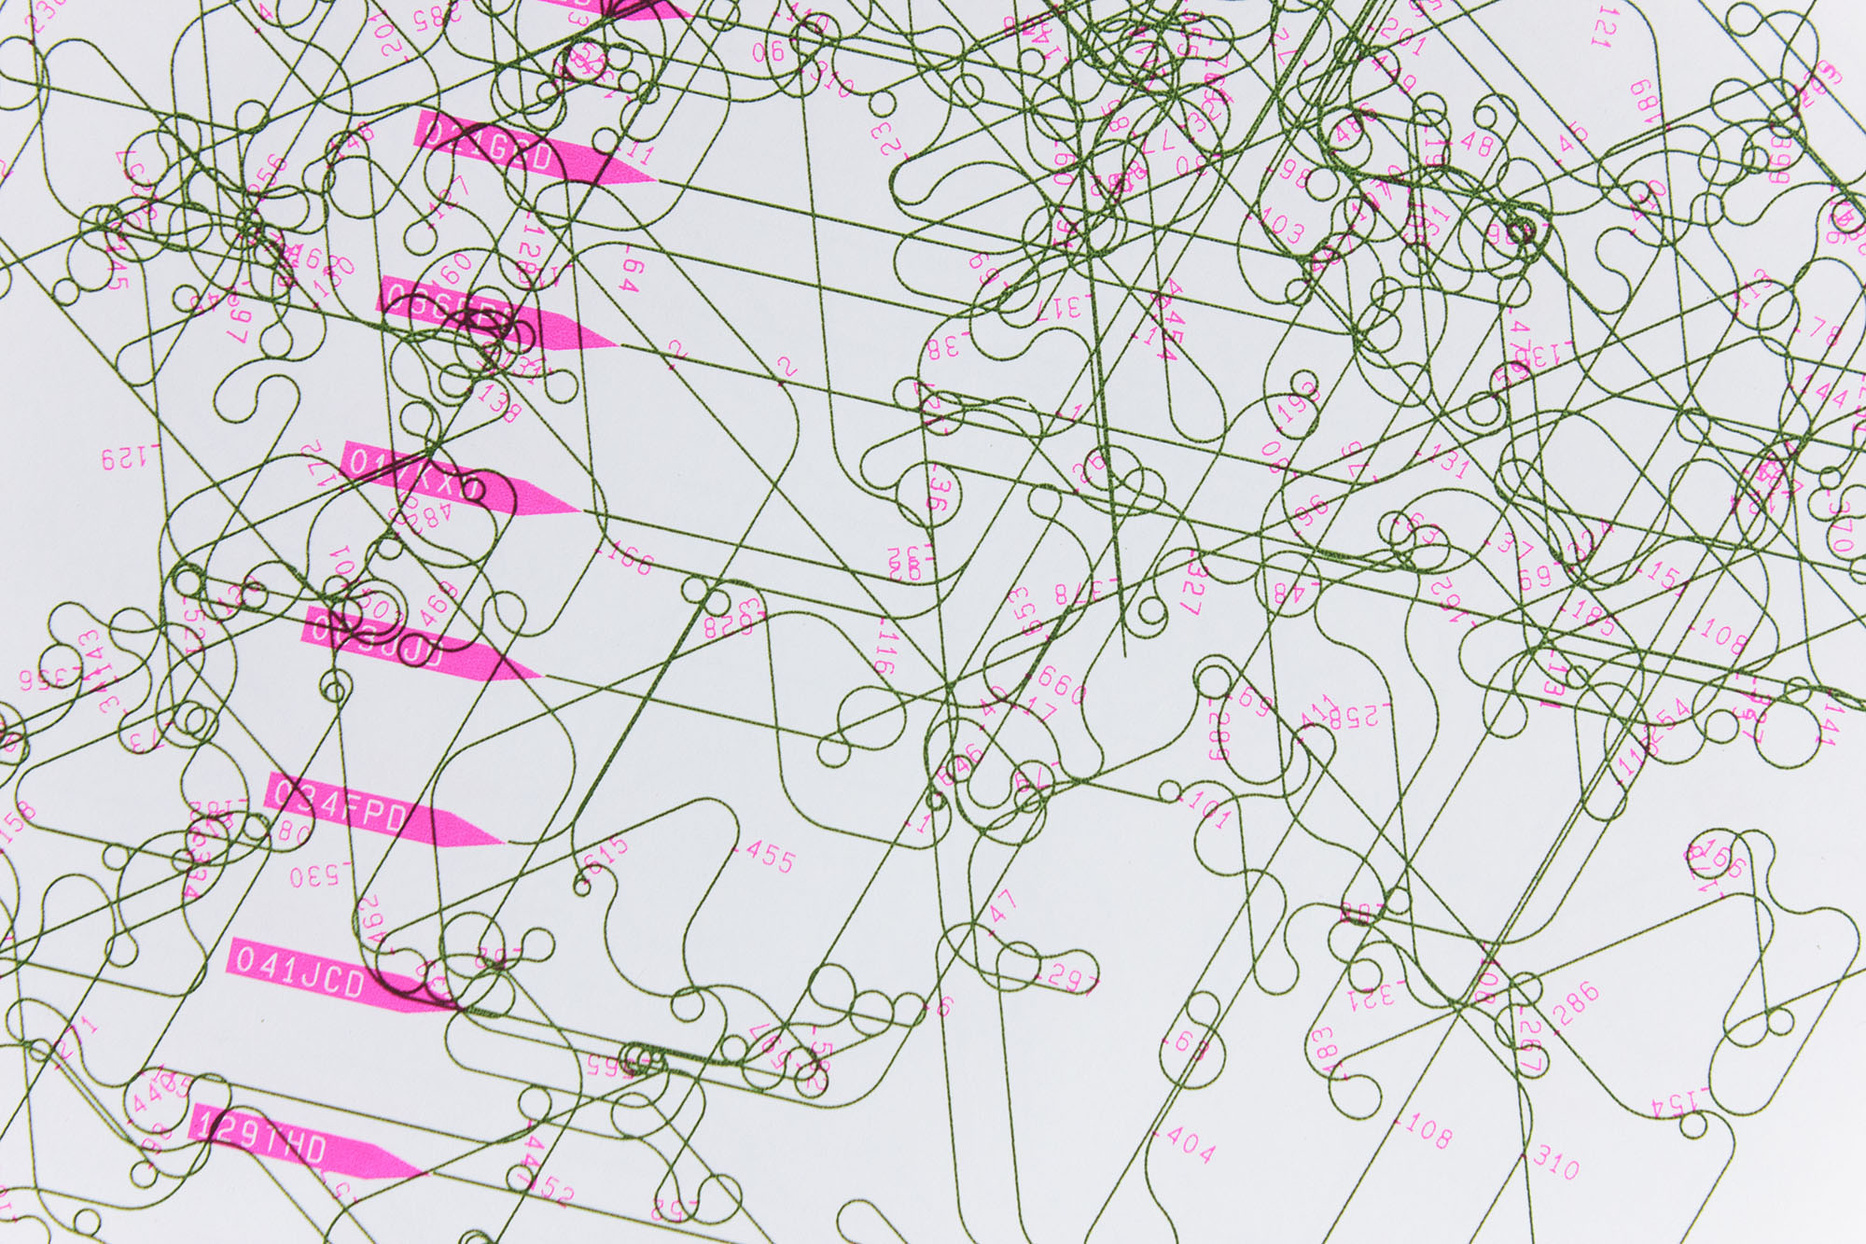
FD2: The diagram shows the development of violation-frequency of the 20 most violating diplomats in 1999. Accumulated violations are shown per week. Frequency in- and decrease is shown as left and right curves.
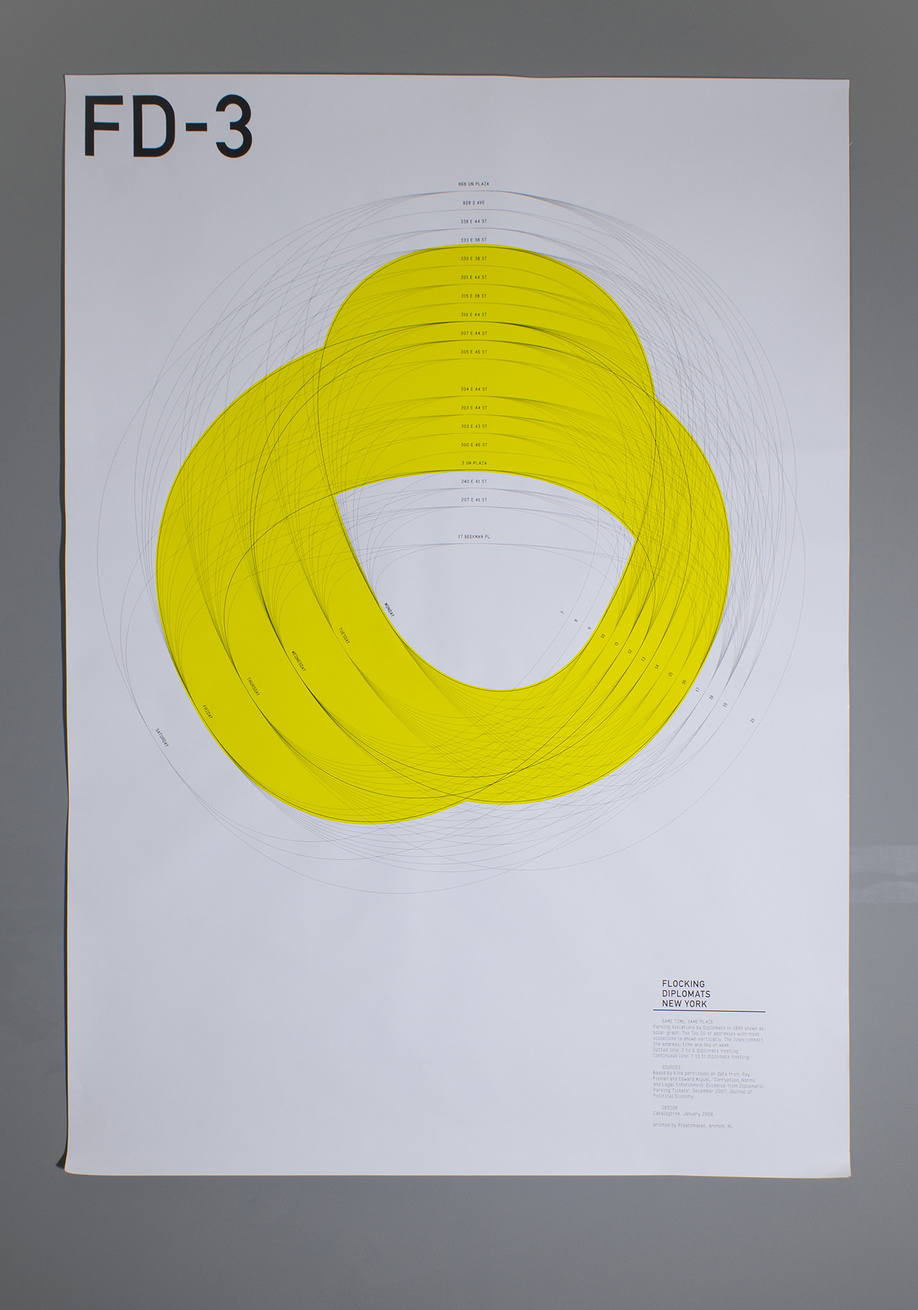
FD3: The Top 20 of addresses with most violations is shown vertically. The lines connect the address, time and day of week.
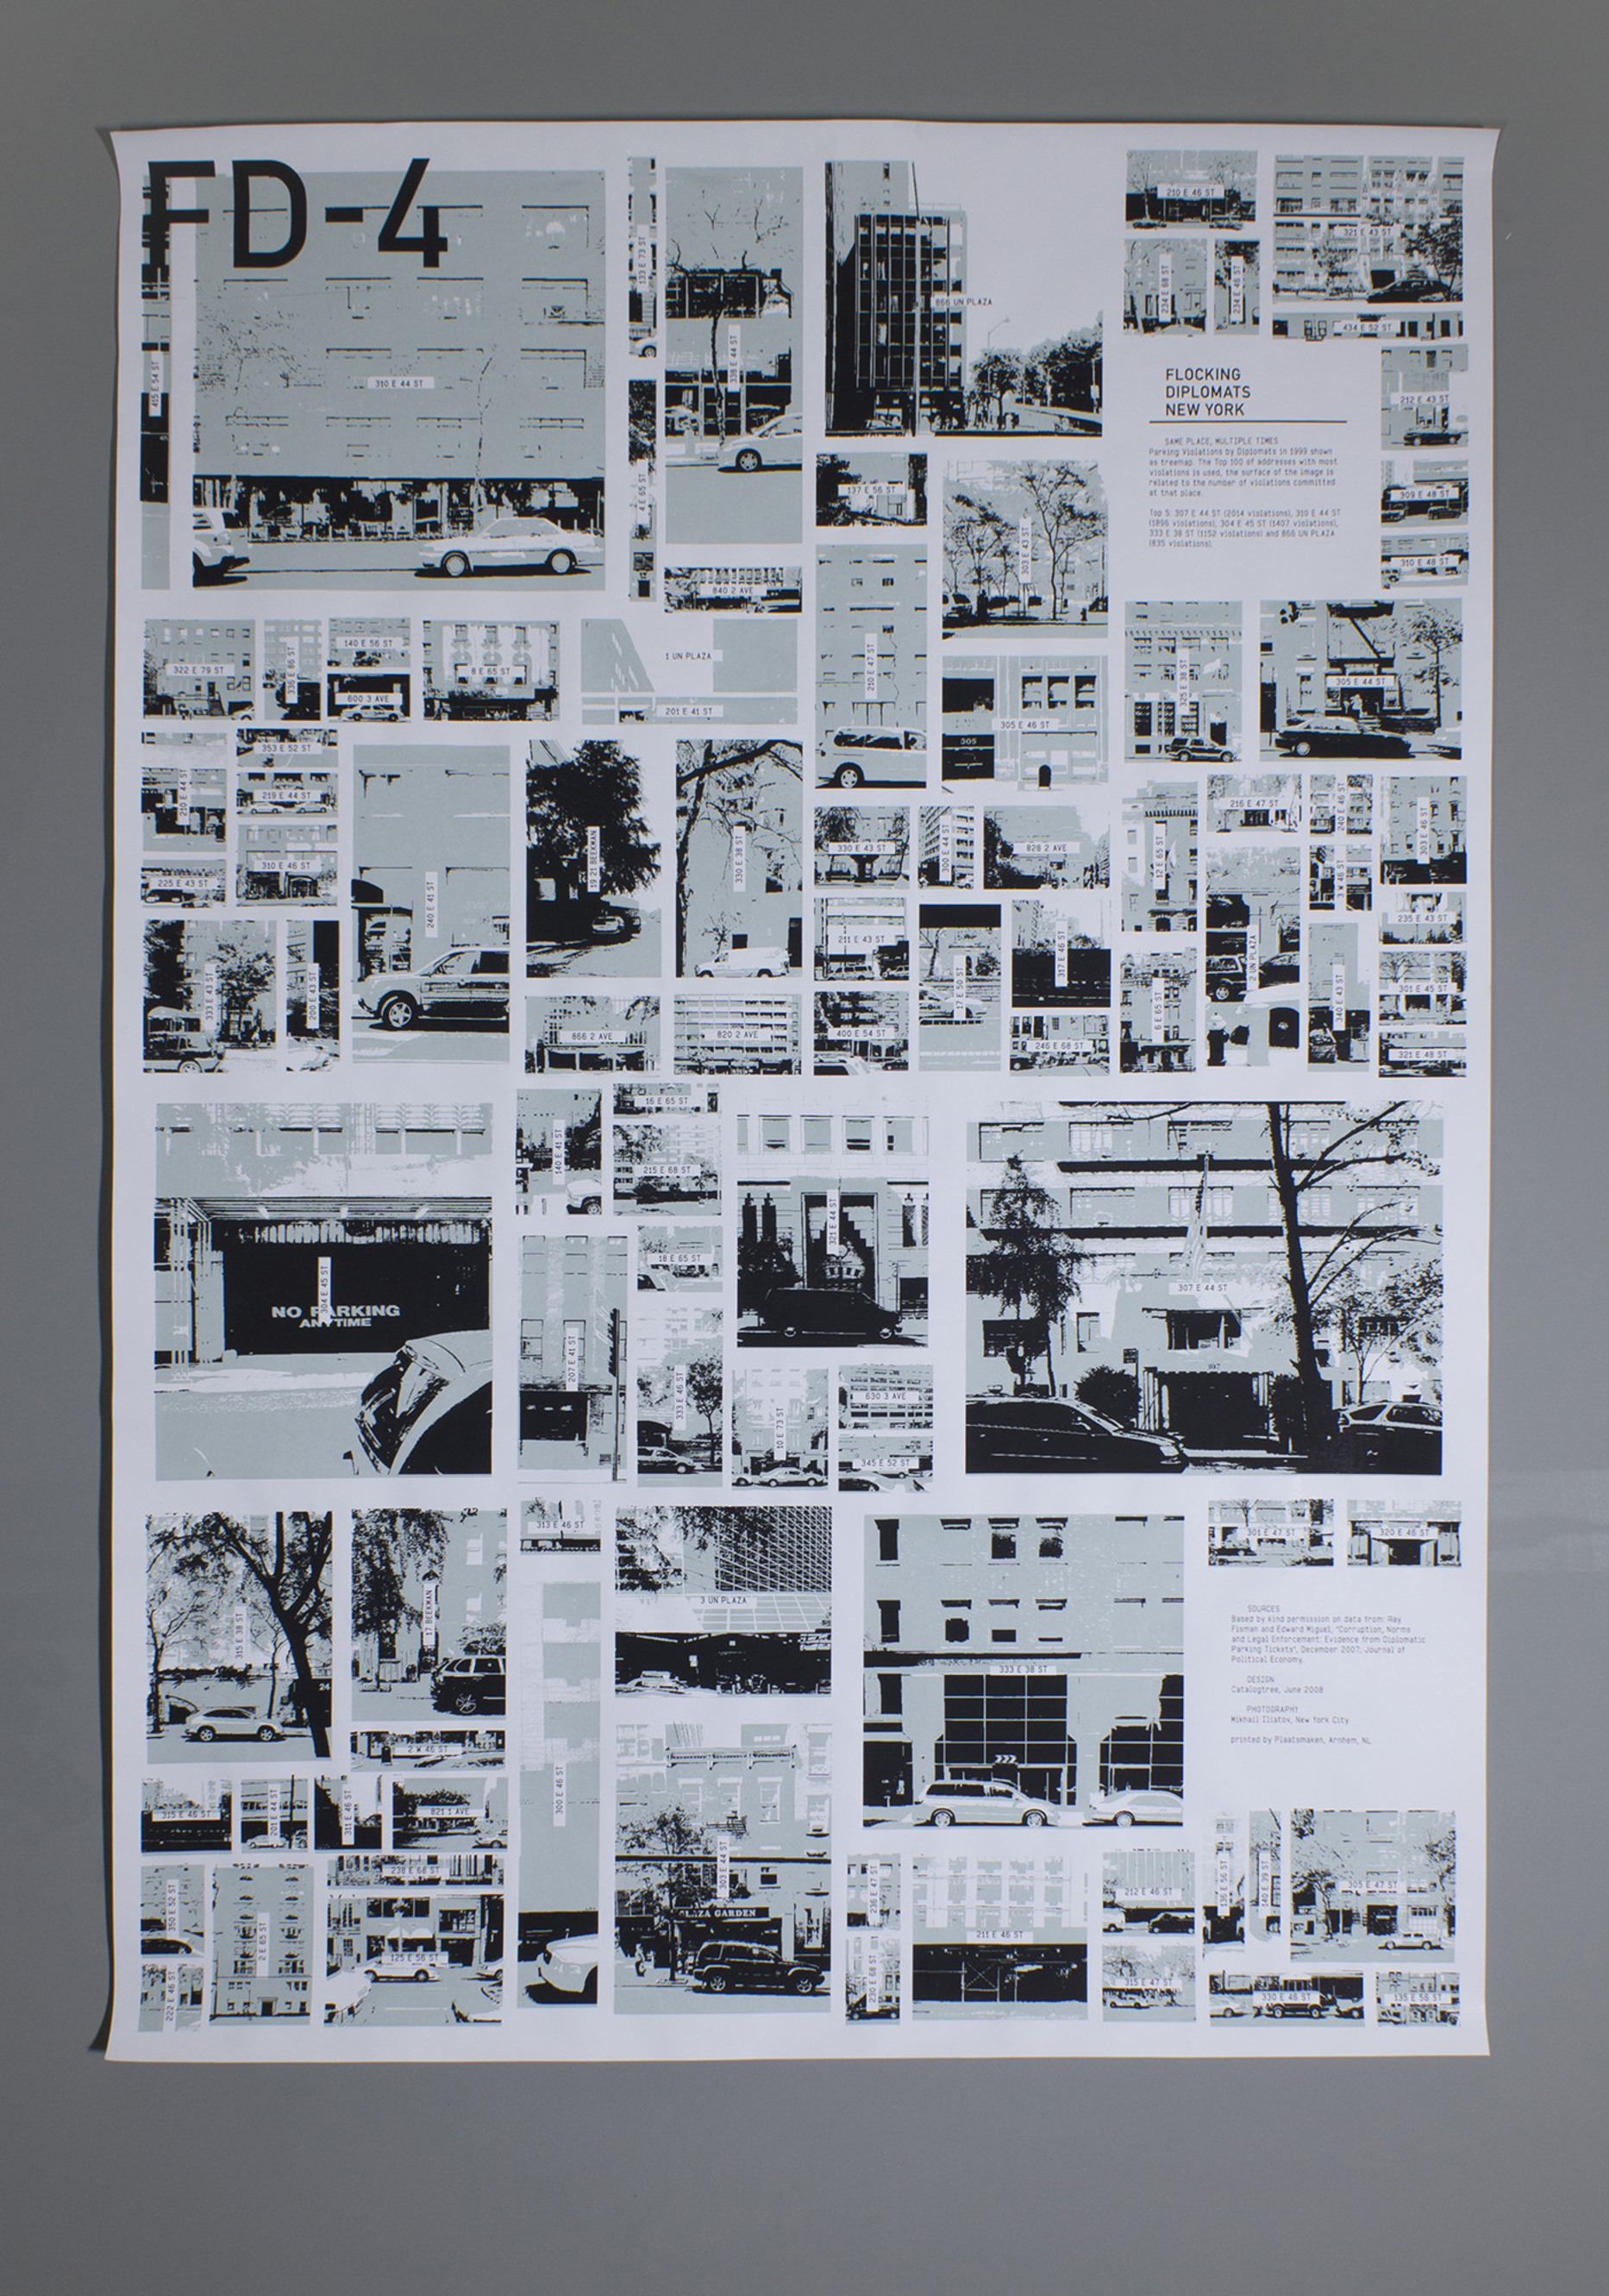
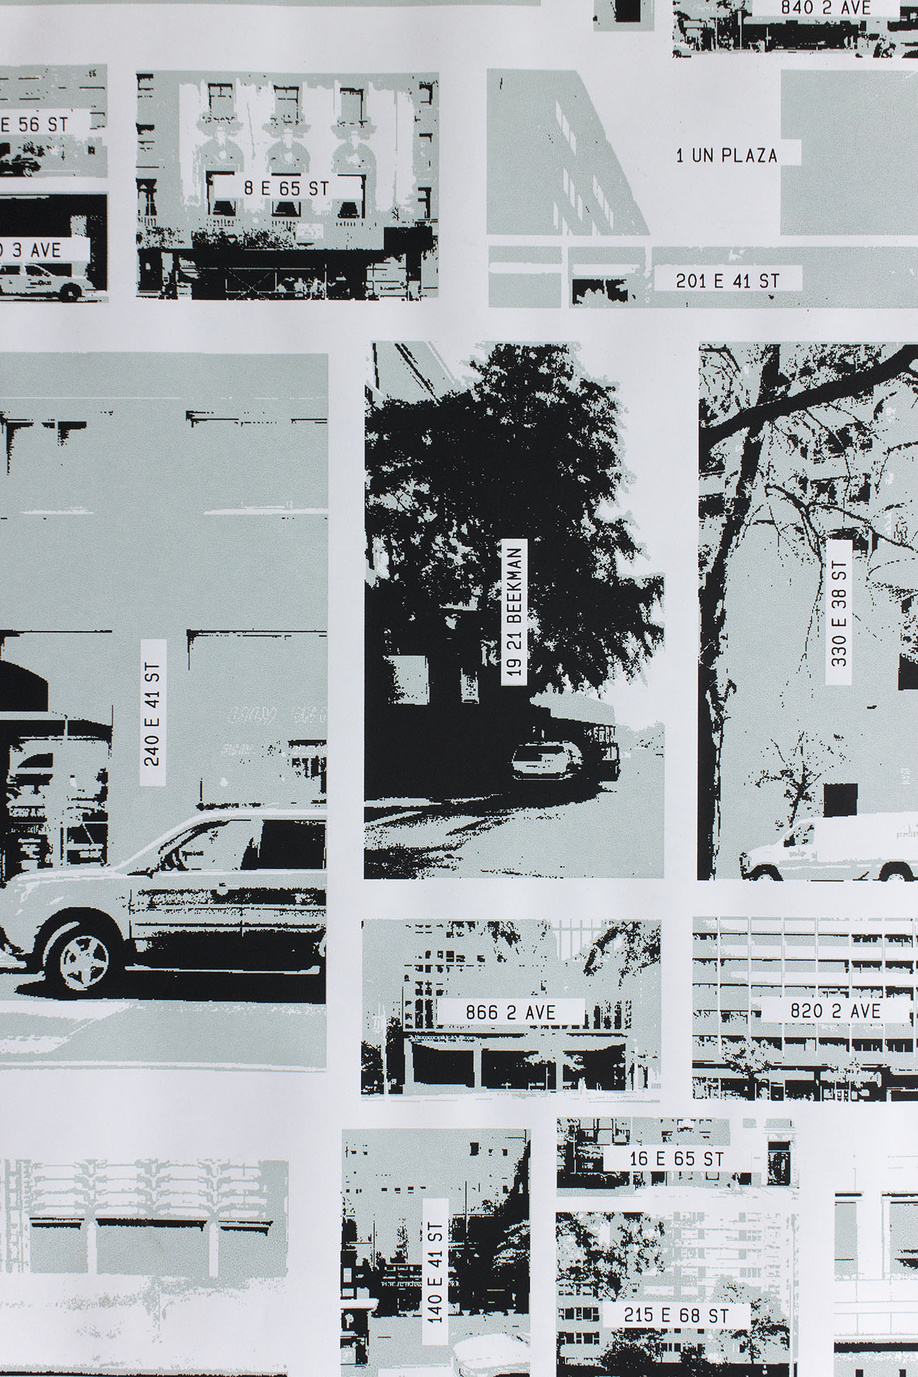
FD4: The Top 100 of addresses with most violations is used, the surface of the image is related to the number of violations committed at that place. In collaboration with Mikhail Iliatov (Photography).
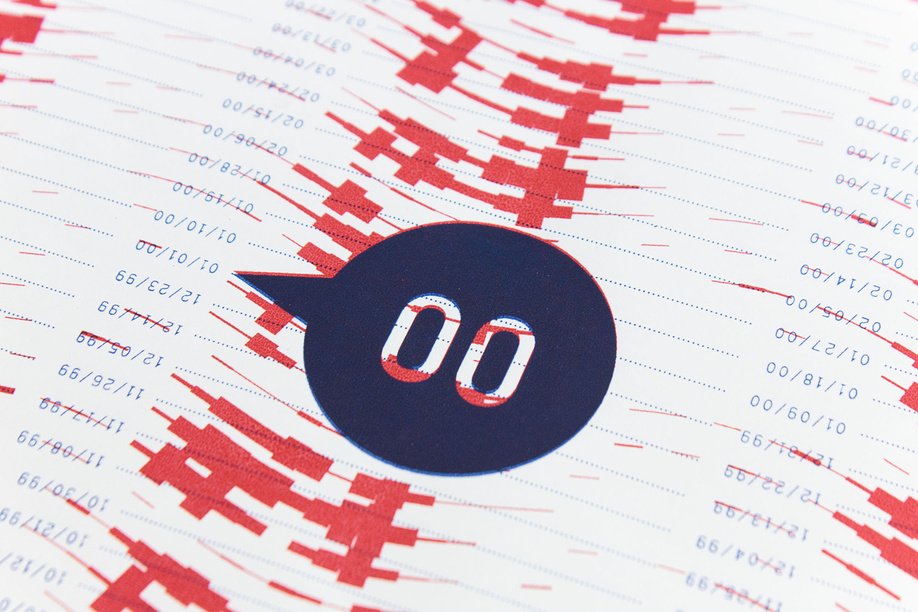
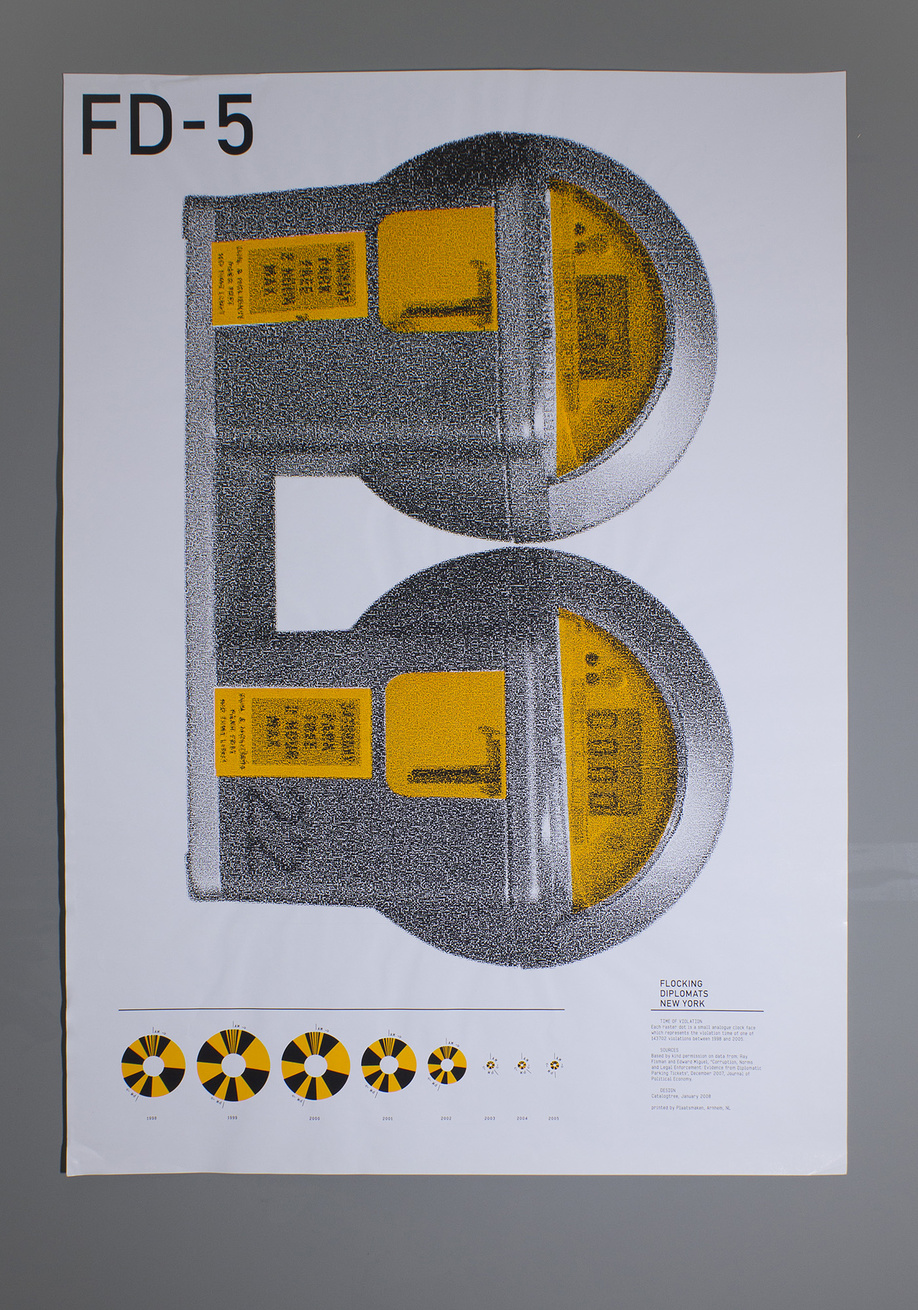
FD5: The photo consists of about 140,000 clock hands as screen dots showing the exact time of each violation between 1998 and 2005.
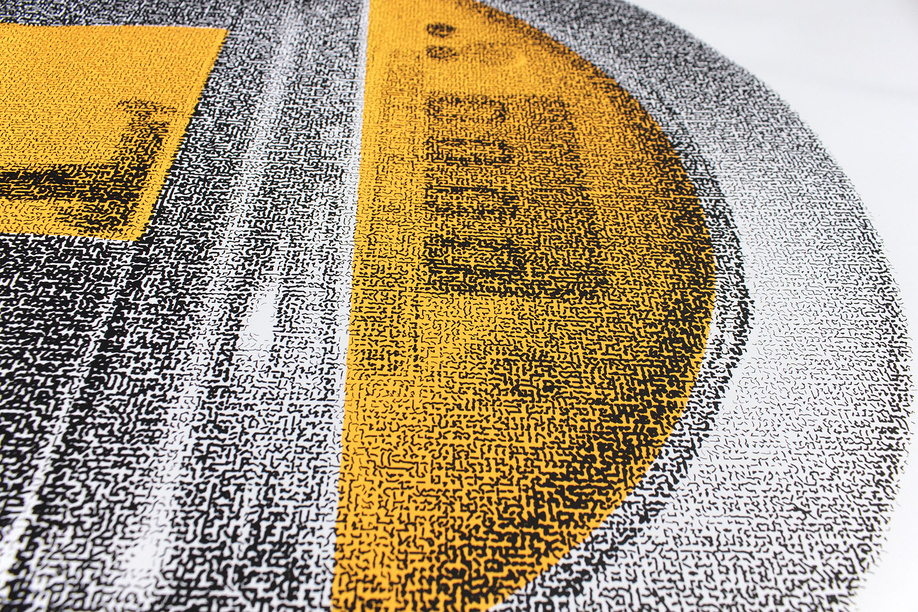
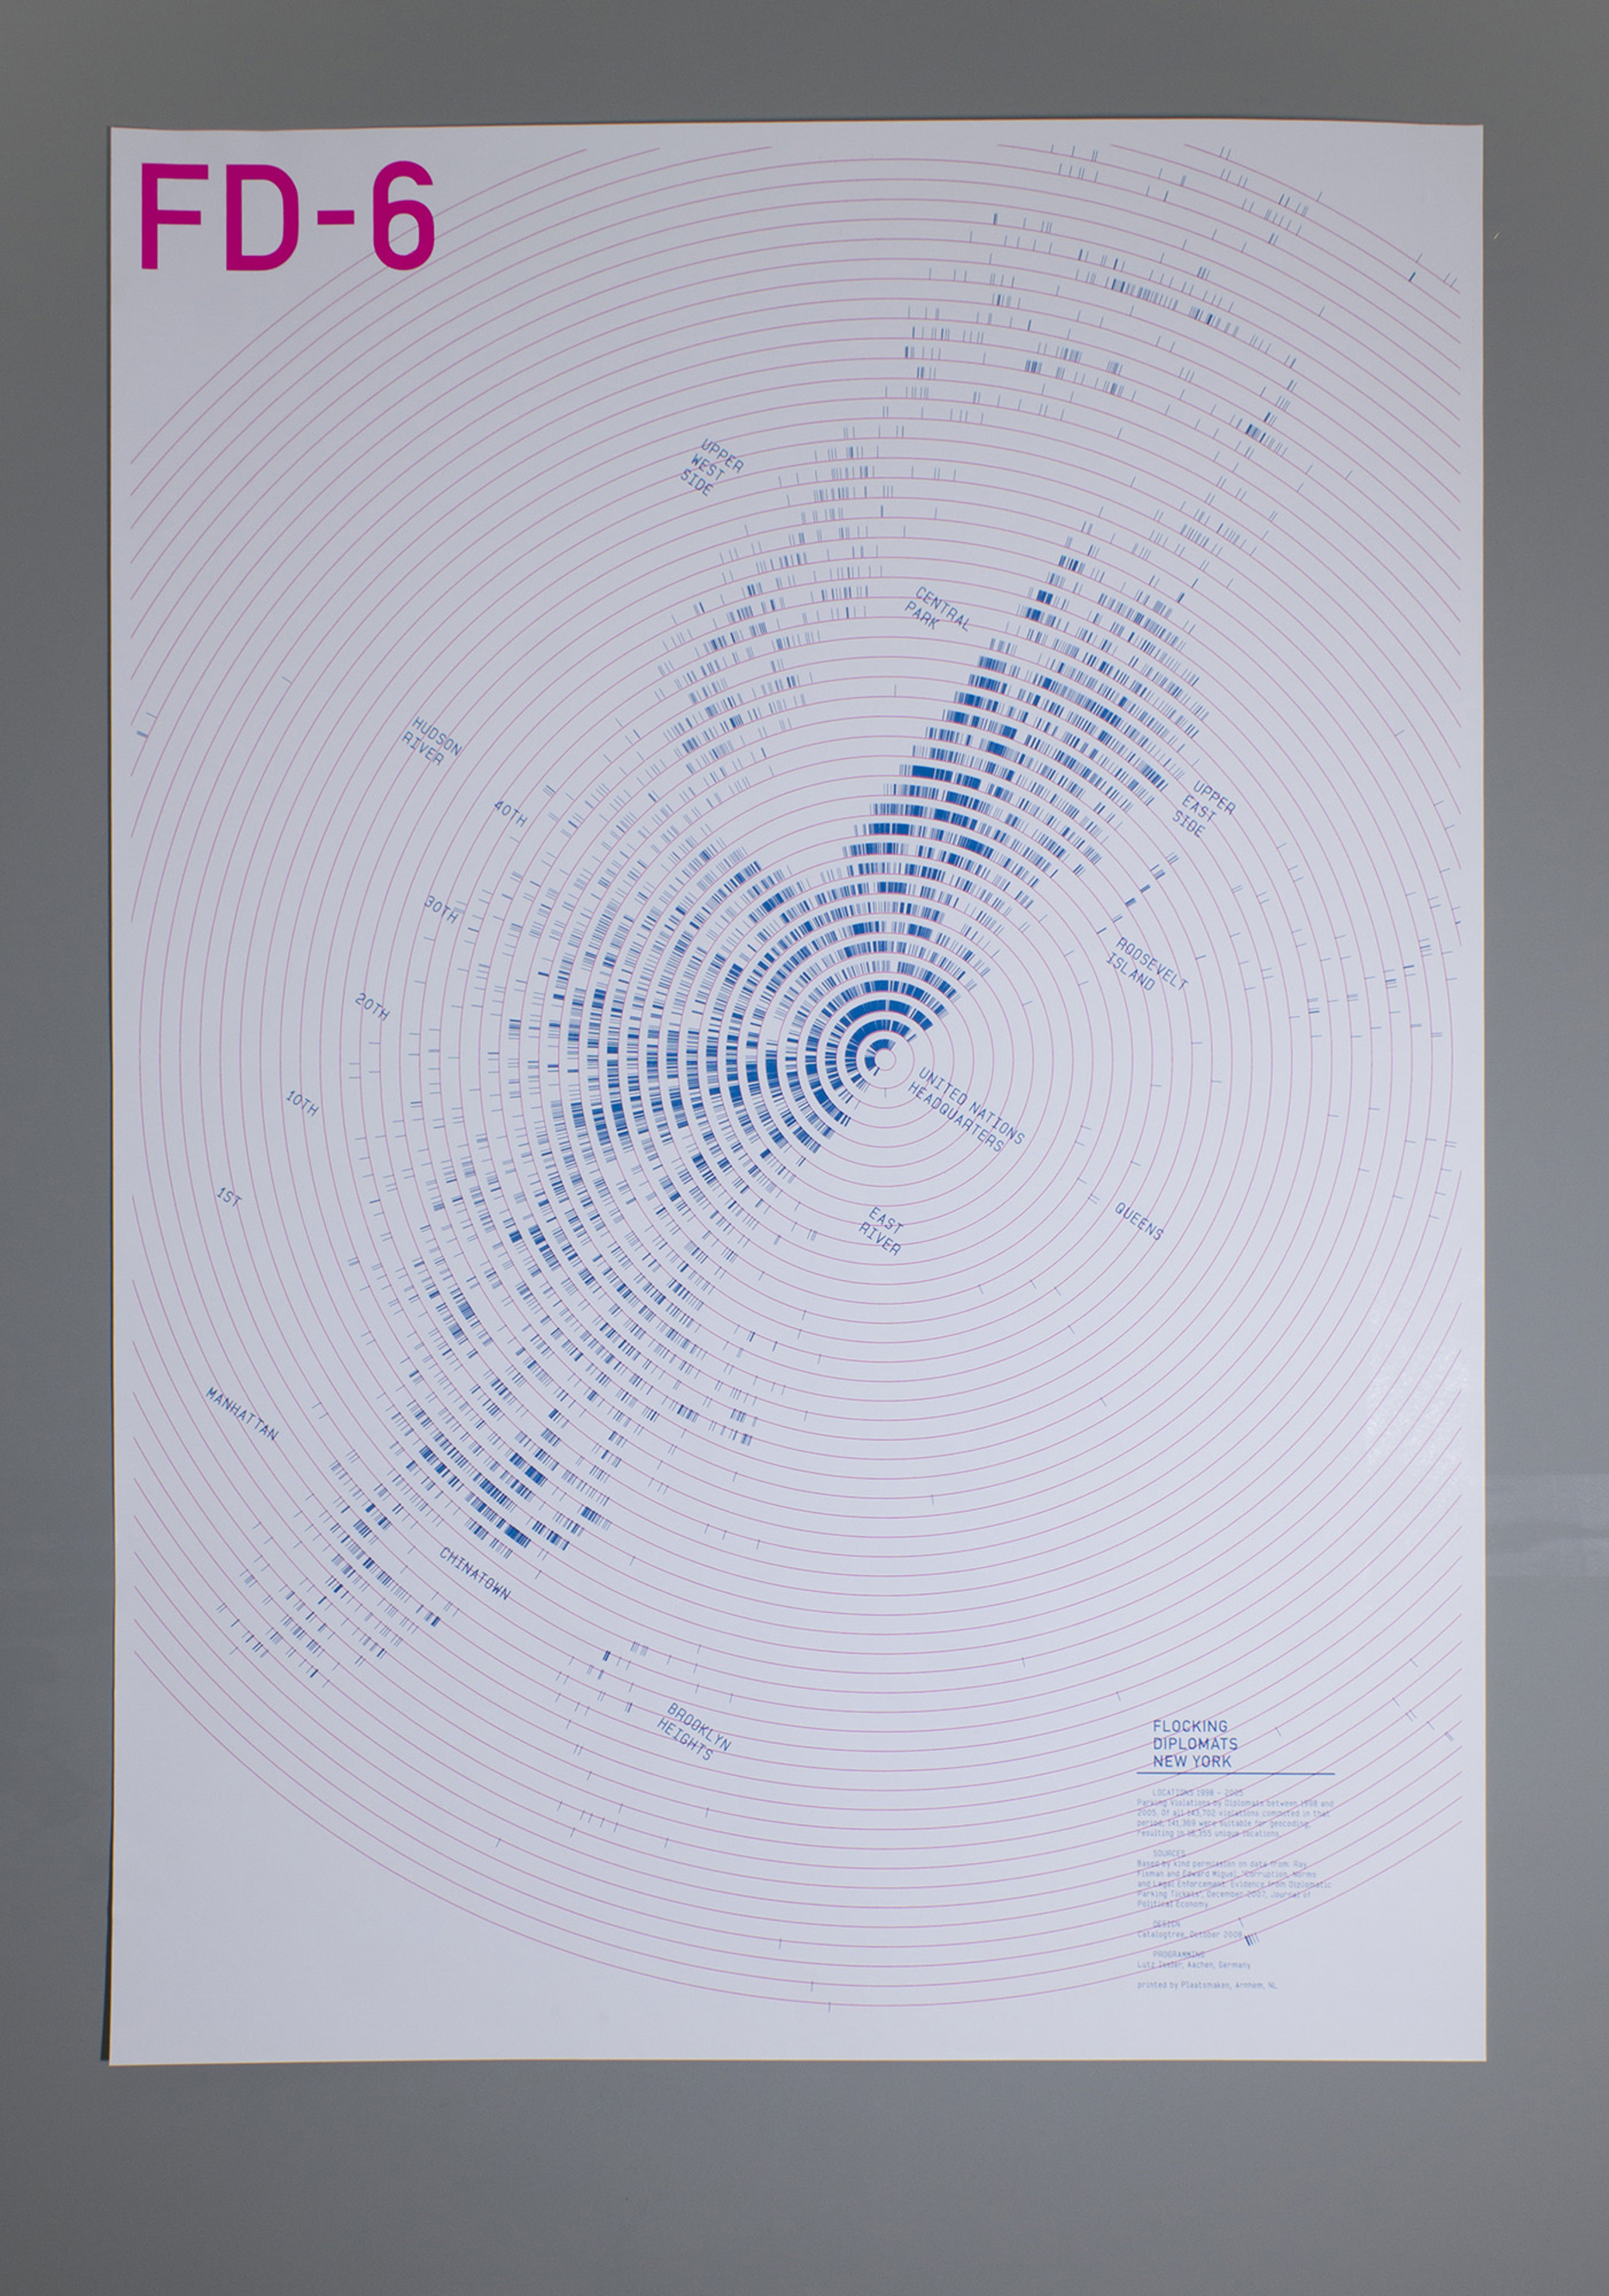
FD6: Of all 143,702 violations, 141,369 were suitable for geocoding, resulting in 16,355 unique loactions. In collaboration with Lutz Issler (geocoding and programming).