11
410

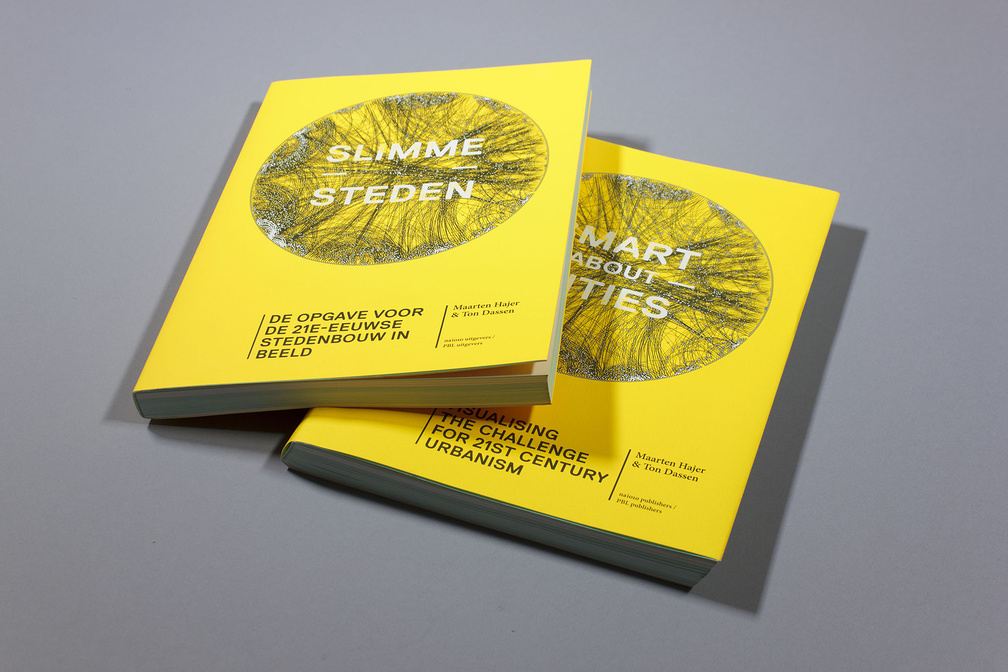
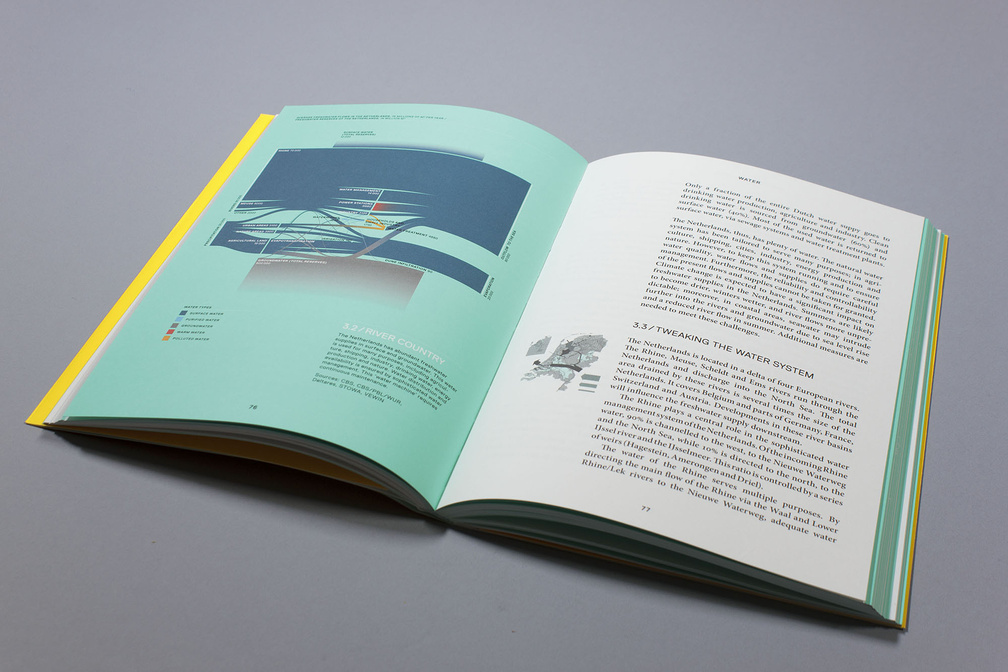
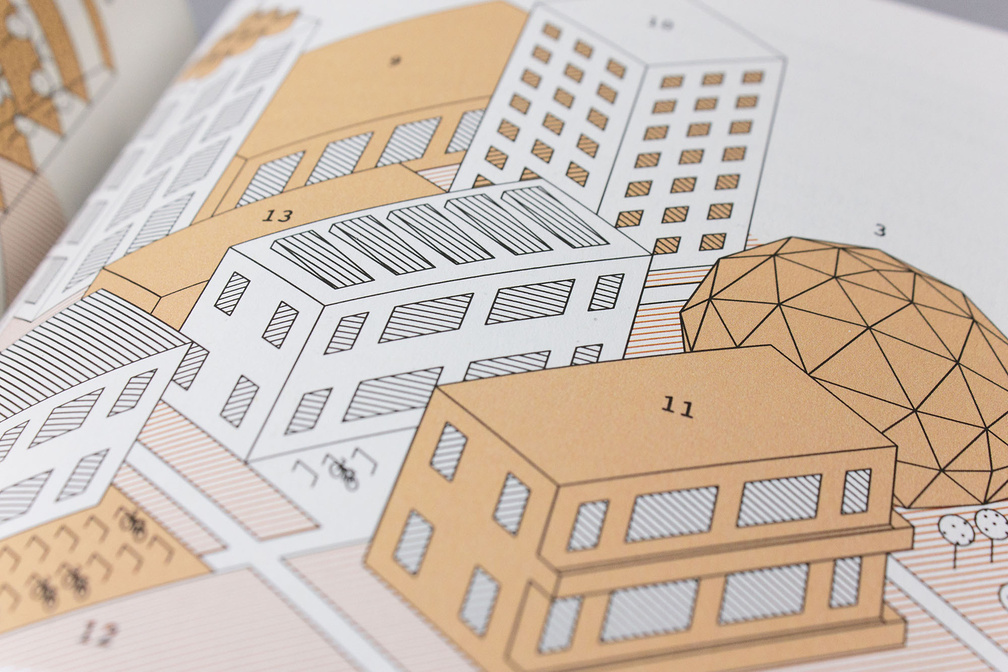
June 2014 – Book Design and Infographics for 'Smart about Cities' commissioned by PBL Netherlands Environmental Assessment Agency. more

2014 / atlas / book / IABR / illustration / information design / map / Rotterdam

October 2013 – Infographics for the book 'The World We Made' by Jonathon Porritt which is written from the viewpoint of a fictional history teacher in 2050. more

2013 / book / illustration / information design / Phaidon

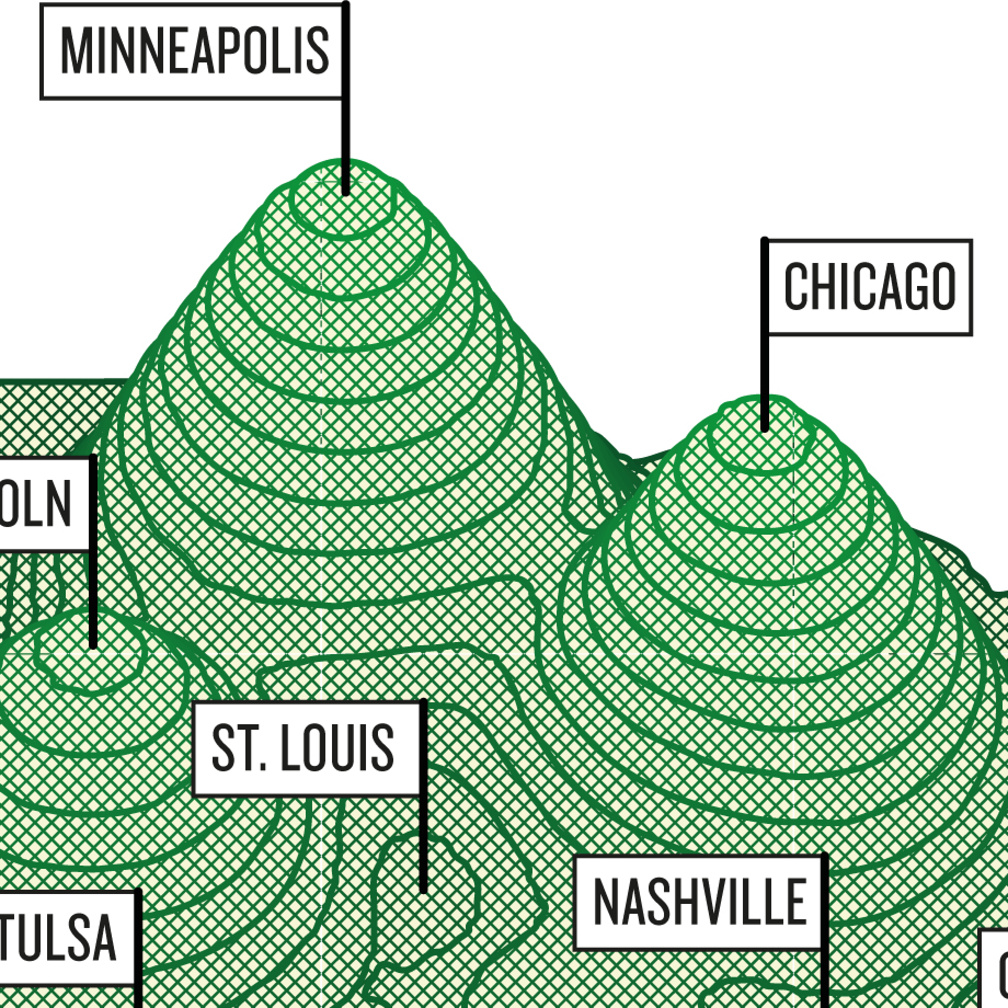
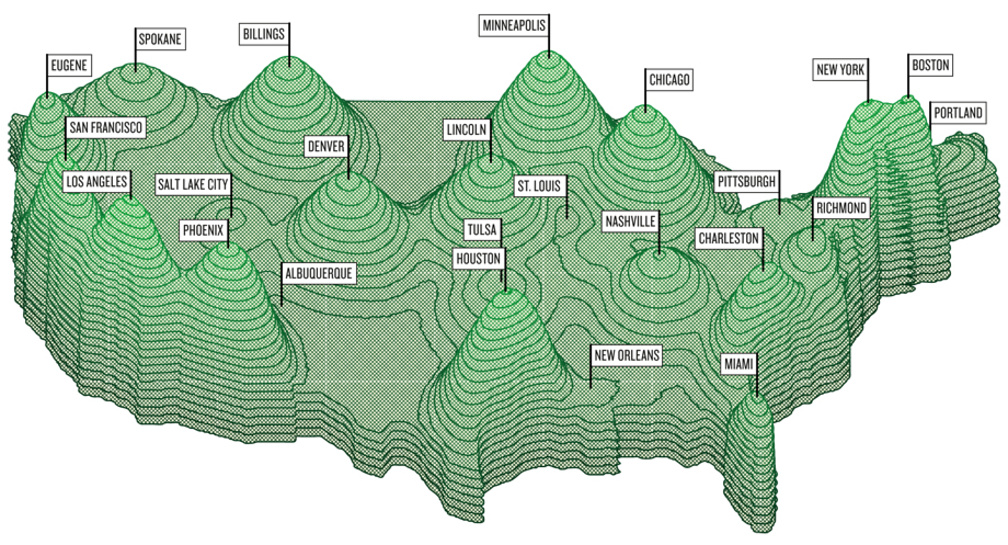
How Much Do You Have to Make to Be Successful?

May 2013 – Illustration for ESQUIRE magazine, New York (US). The map shows how much a family of four need to have to live very well in 24 cities of the US.

2013 / illustration / information design / magazine / map

March 2011 – Charts and map on obesity for Architect Magazine, Washington D.C. (US). more

January 2011 – Data illustrations for Architect Magazine, Washington D.C. (US). more

SWART

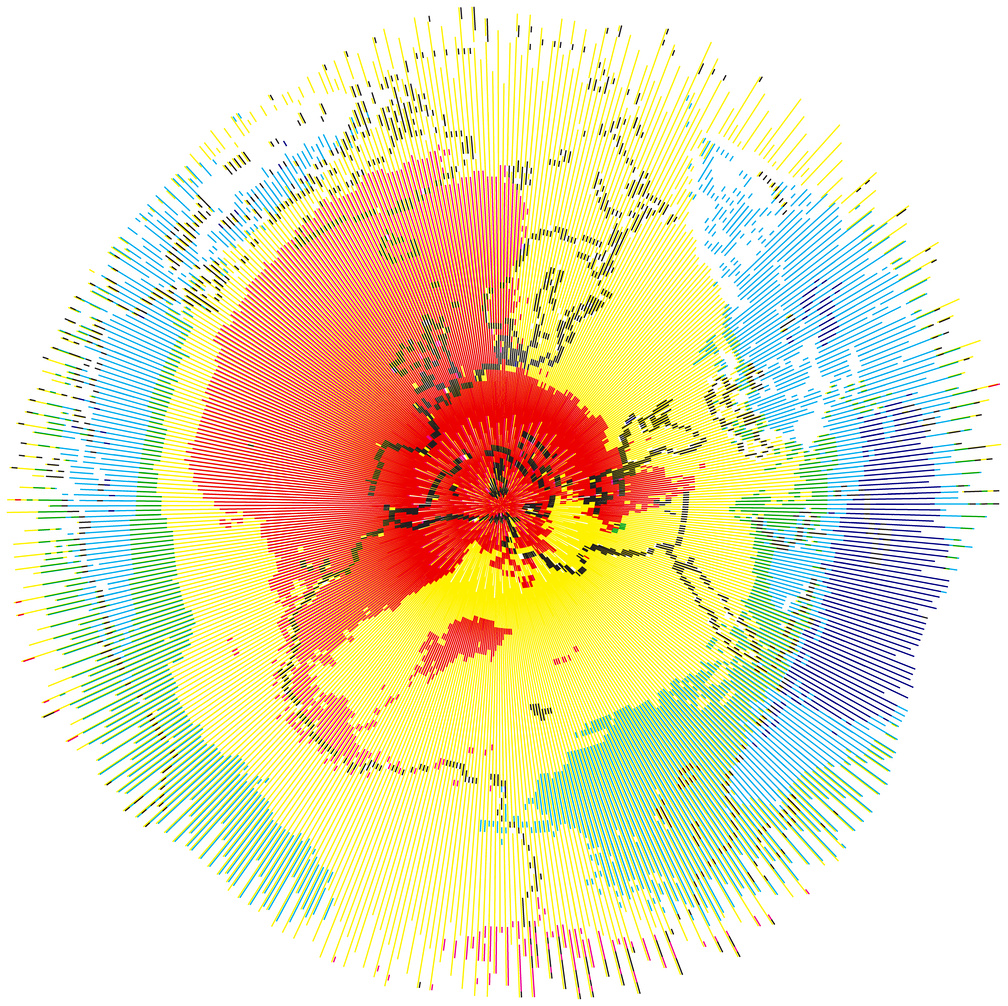
March 2010 – Visualisation of gravity fields on earth drawn in CMYK on a pen plotter.
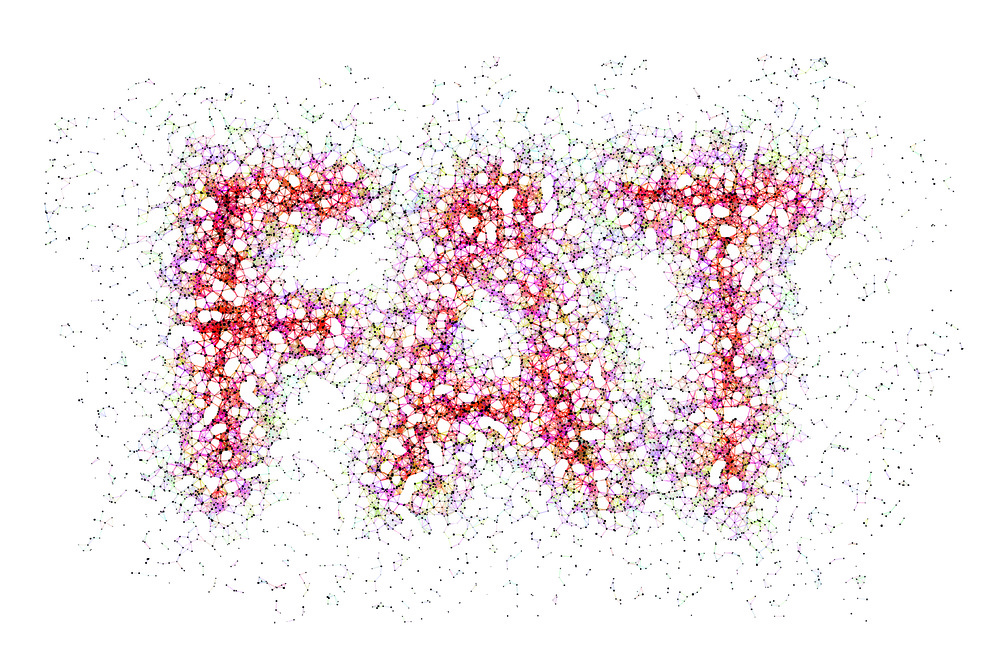
2010 / illustration / pen plotter

Fat

September 2009 – Illustration for The New York Times Magazine, New York (US). more

2009 / filter / illustration / magazine / New York Times / screen dots

Words

April 2009 – Illustration (detail) for Boston Magazine, Boston (US).

2008 / Boston Magazine / illustration / magazine

April 2009 – Illustration for Print Magazine, Blue Ash (US). more

kilo

November 2008 – Standard kilogram (surface deviation multiplied 1.000.000 times) drawn in CMYK on a pen plotter.

2008 / illustration / pen plotter

Usain Bolt

September 2008 – Illustration using a non-regular print screen pattern for ESPN the Magazine, Bristol (USA).

2008 / ESPN magazine / illustration / magazine / screen dots